Free tool
Vanna Exposure Heatmap (VEX)
Visualize vanna exposure across strike prices and expirations. Green = positive vanna, purple = negative vanna.
GEX Workspace
Multi-ticker dashboard with alerts
GEX Intraday PlayTape
Intraday gamma movement & replay
Max Pain Calculator
Options pain strike by expiration
What is a VEX Heatmap?
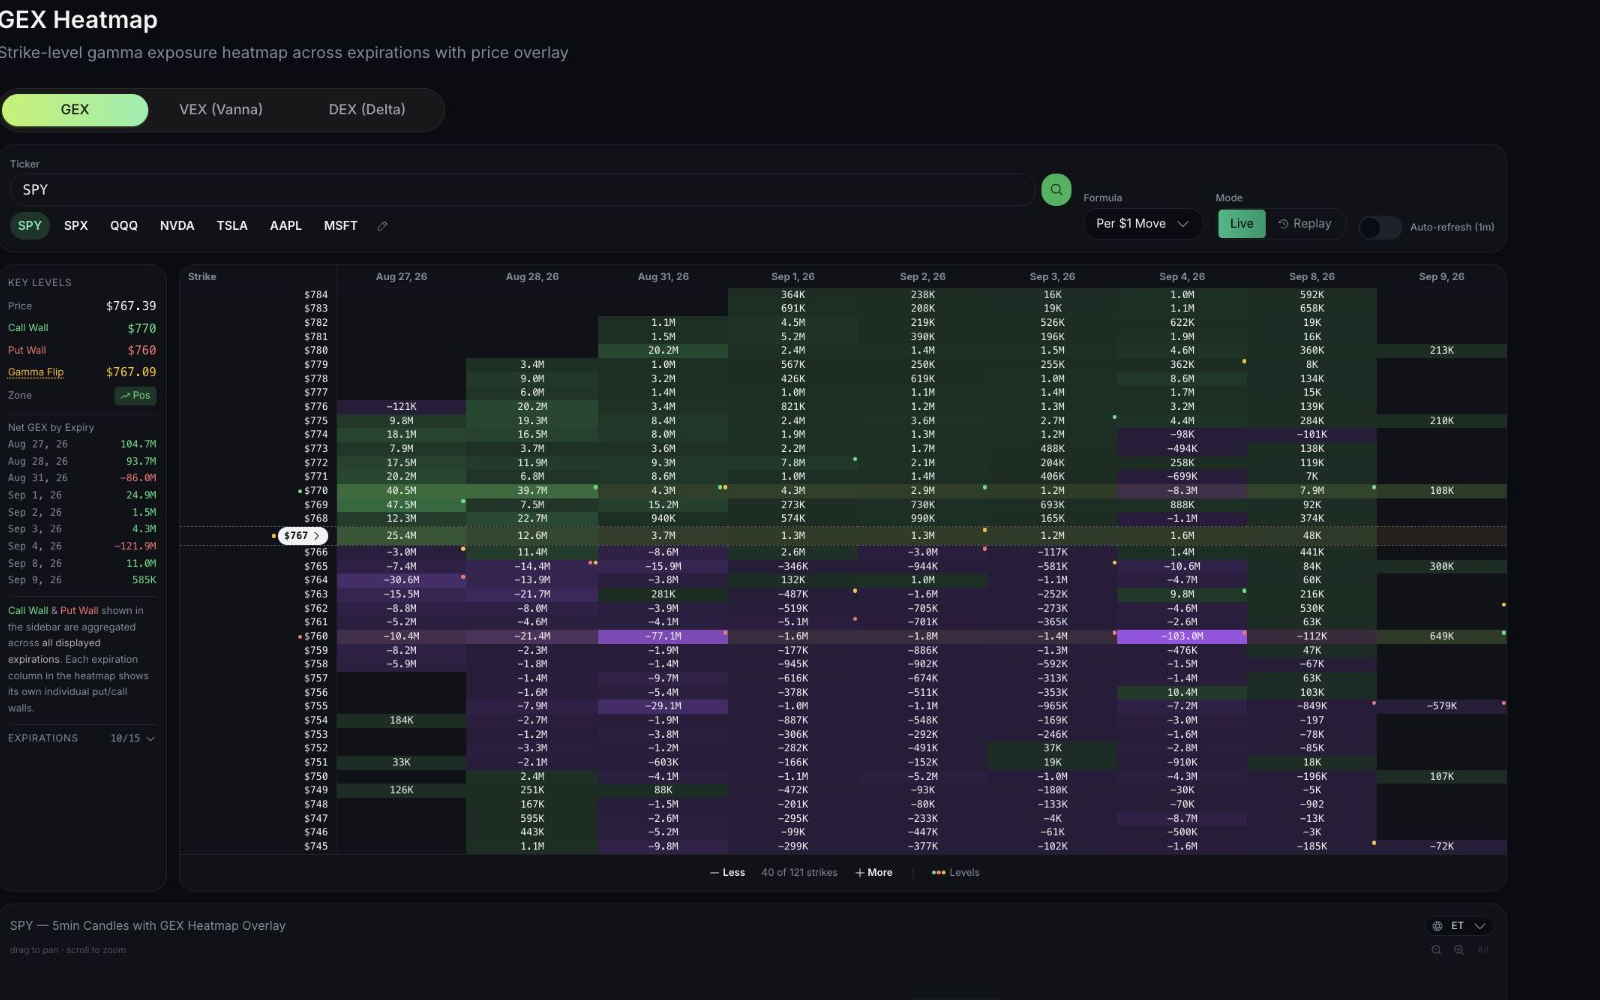
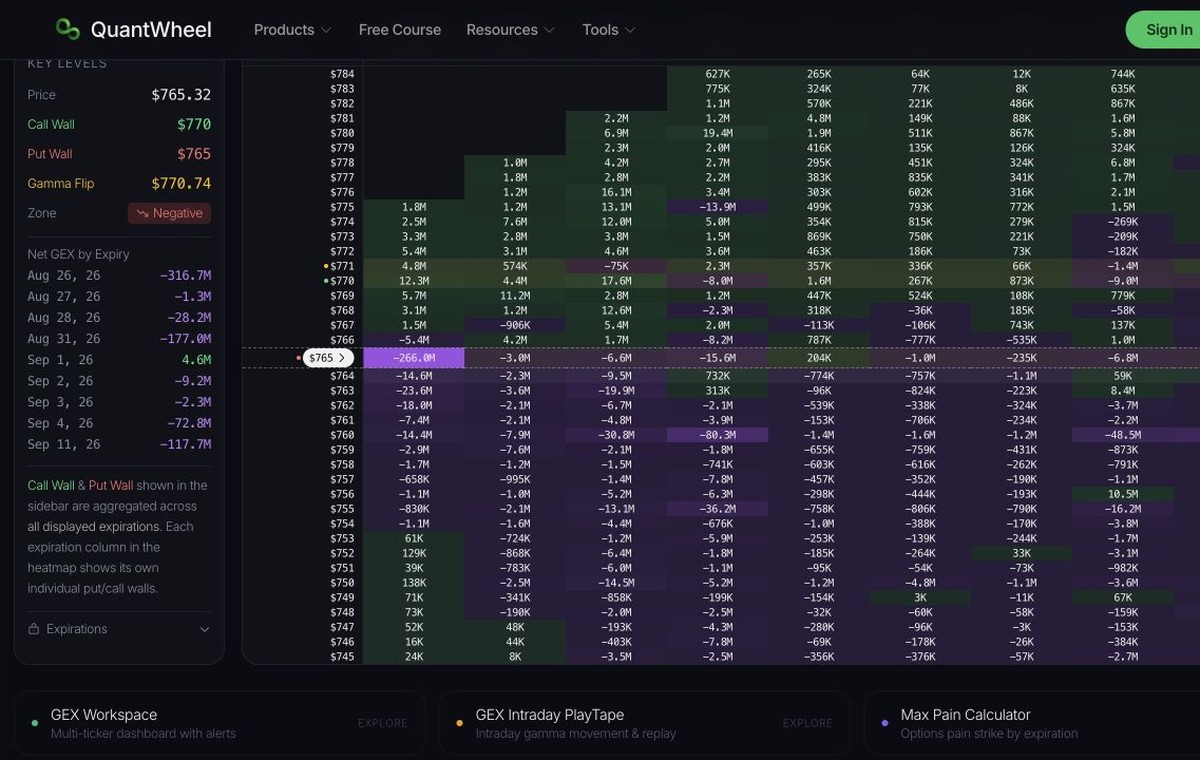
A VEX (Vanna Exposure) Heatmap displays modeled net vanna across strike prices and expiration dates in a color-coded grid. Each cell is net vanna at a strike for one expiration. Green cells are positive vanna. Purple cells are negative vanna. Color intensity reflects magnitude.
Unlike a single vanna chart that collapses expirations, the heatmap keeps the expiration breakdown so you can see which dates contribute the most vanna and how the vanna flip shifts further out in time.
How to Read the Vanna Exposure Heatmap
Strike prices sit on the vertical axis and expiration dates sit along the top. A simple read of the bright cells:
- Bright purple / pink cells: Support on the downside.
- Bright green cells: Slow vanna drift targets in a stable or decreasing IV regime.
- Key Levels sidebar: Total vanna, the vanna flip, and the net vanna regime across the displayed expirations.
- Net Vanna by Expiry: Total net vanna for each expiration column.
Stronger color marks larger modeled vanna. Compare those cells with spot and with the vanna flip row.
Frequently Asked Questions
Next step
Where to go next
Try the whole product with sample positions. No account needed.