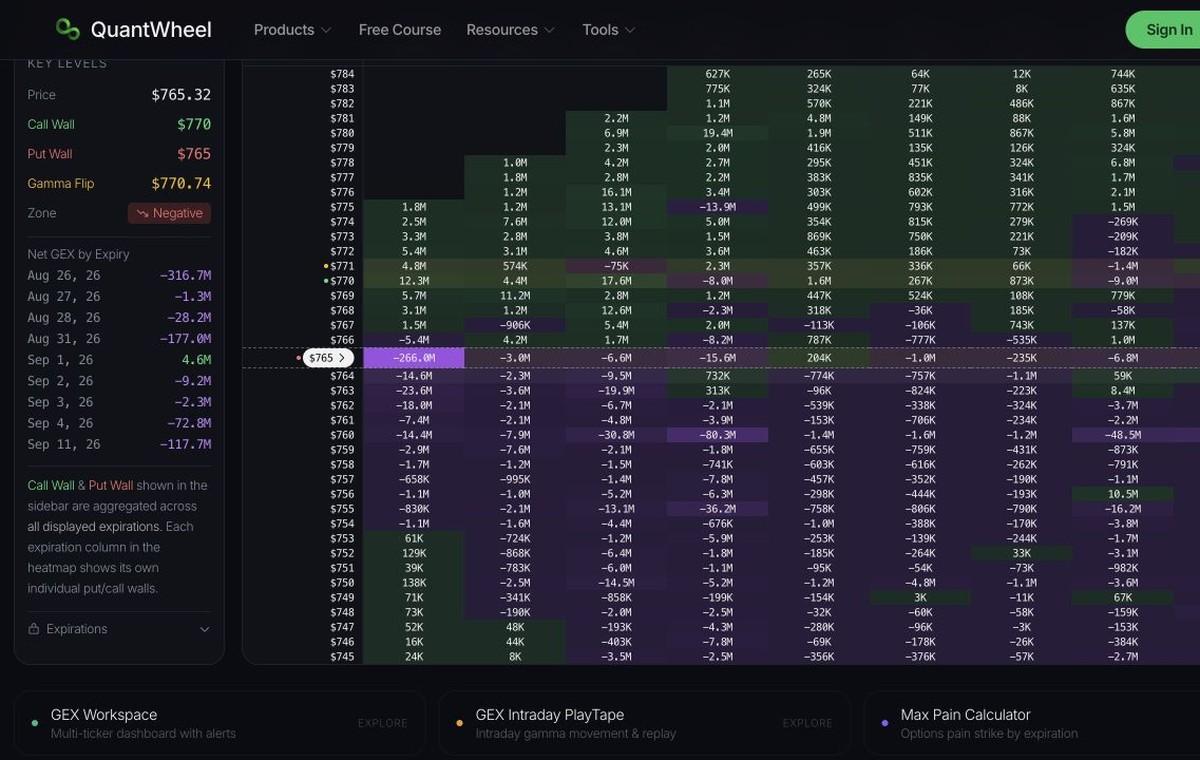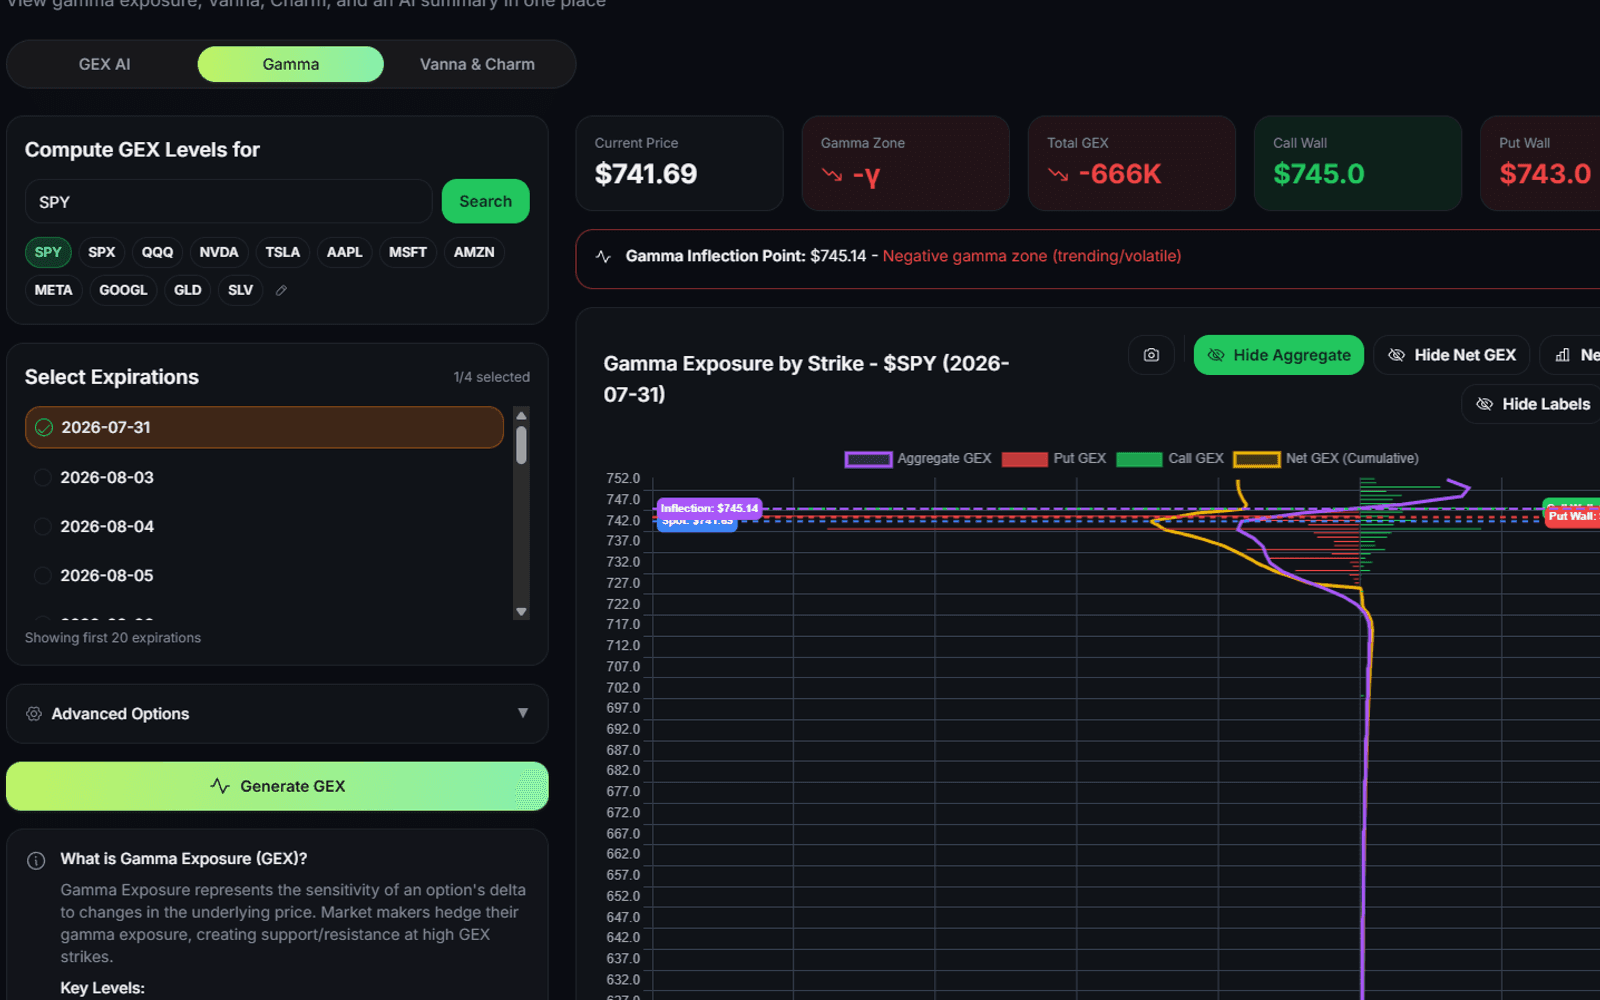
GEX, VEX, and DEX
One grid, three exposure measures: gamma, vanna, delta.
Gamma Exposure
See where dealer gamma is concentrated, strike by strike and expiry by expiry, so you know which levels matter before you place a directional trade.
$1 for 7 days • Cancel anytime • 14-day money-back guarantee
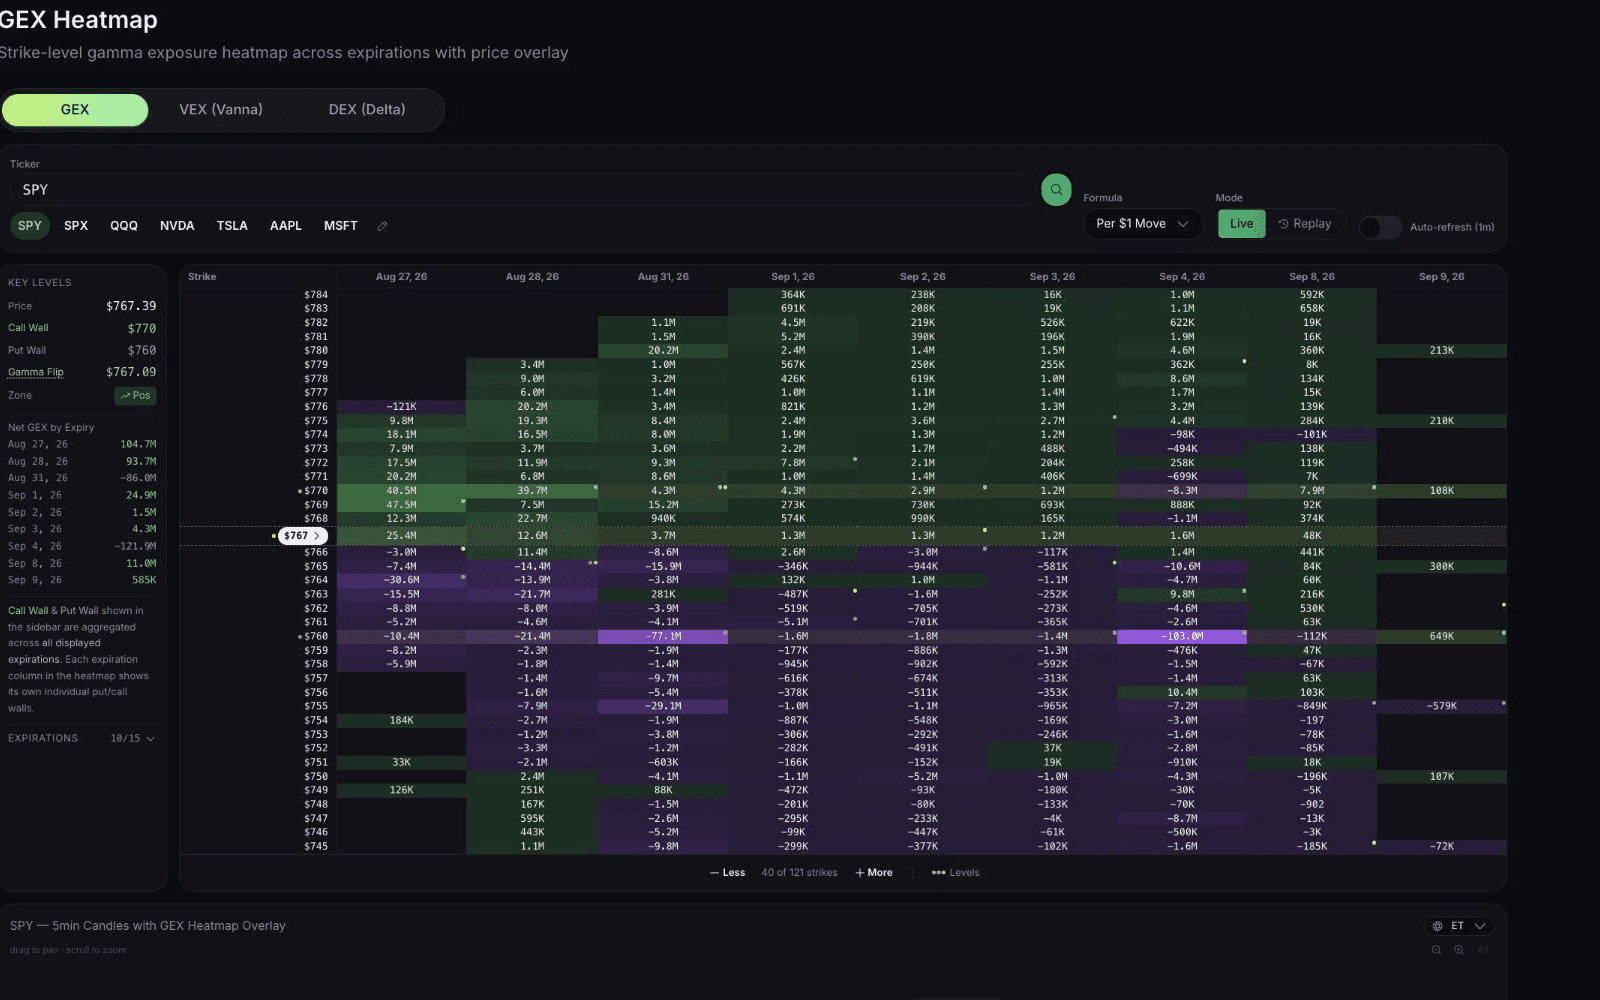
Capabilities
One grid, three exposure measures: gamma, vanna, delta.
See which expiry carries the weight at each strike.
Compare with five-minute price, or step through captured frames.
How it works
Any supported symbol.
Expirations, then GEX, VEX, or DEX.
Strike concentrations, key levels, the price overlay.
Modeled from supported options data. Not observed dealer inventory, not a forecast, and no guarantee that a level holds.
Continue your workflow
FAQ
Gamma Exposure Heatmap
$1 for 7 days • Cancel anytime • 14-day money-back guarantee
Options trading involves substantial risk and is not suitable for all investors. QuantWheel provides software for research, analysis, screening, tracking, and workflow support. It does not provide personalized investment advice or guarantee trading outcomes.