Gamma Exposure Analysis
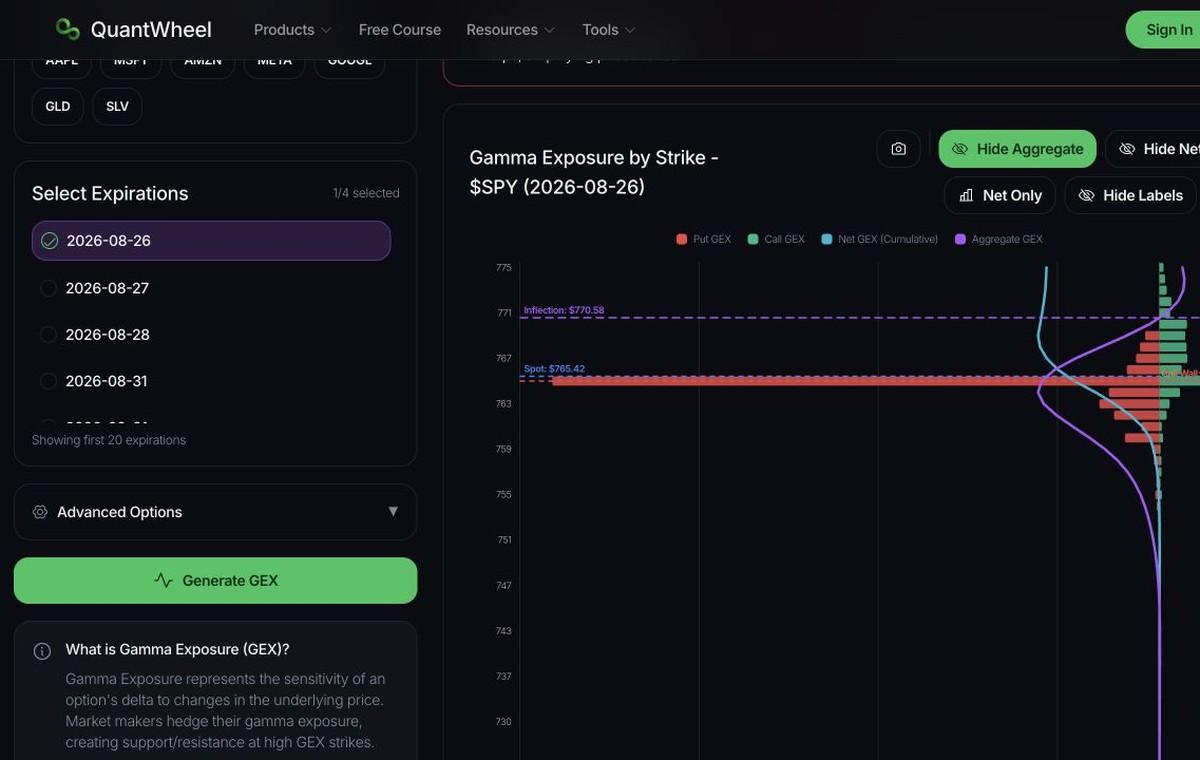
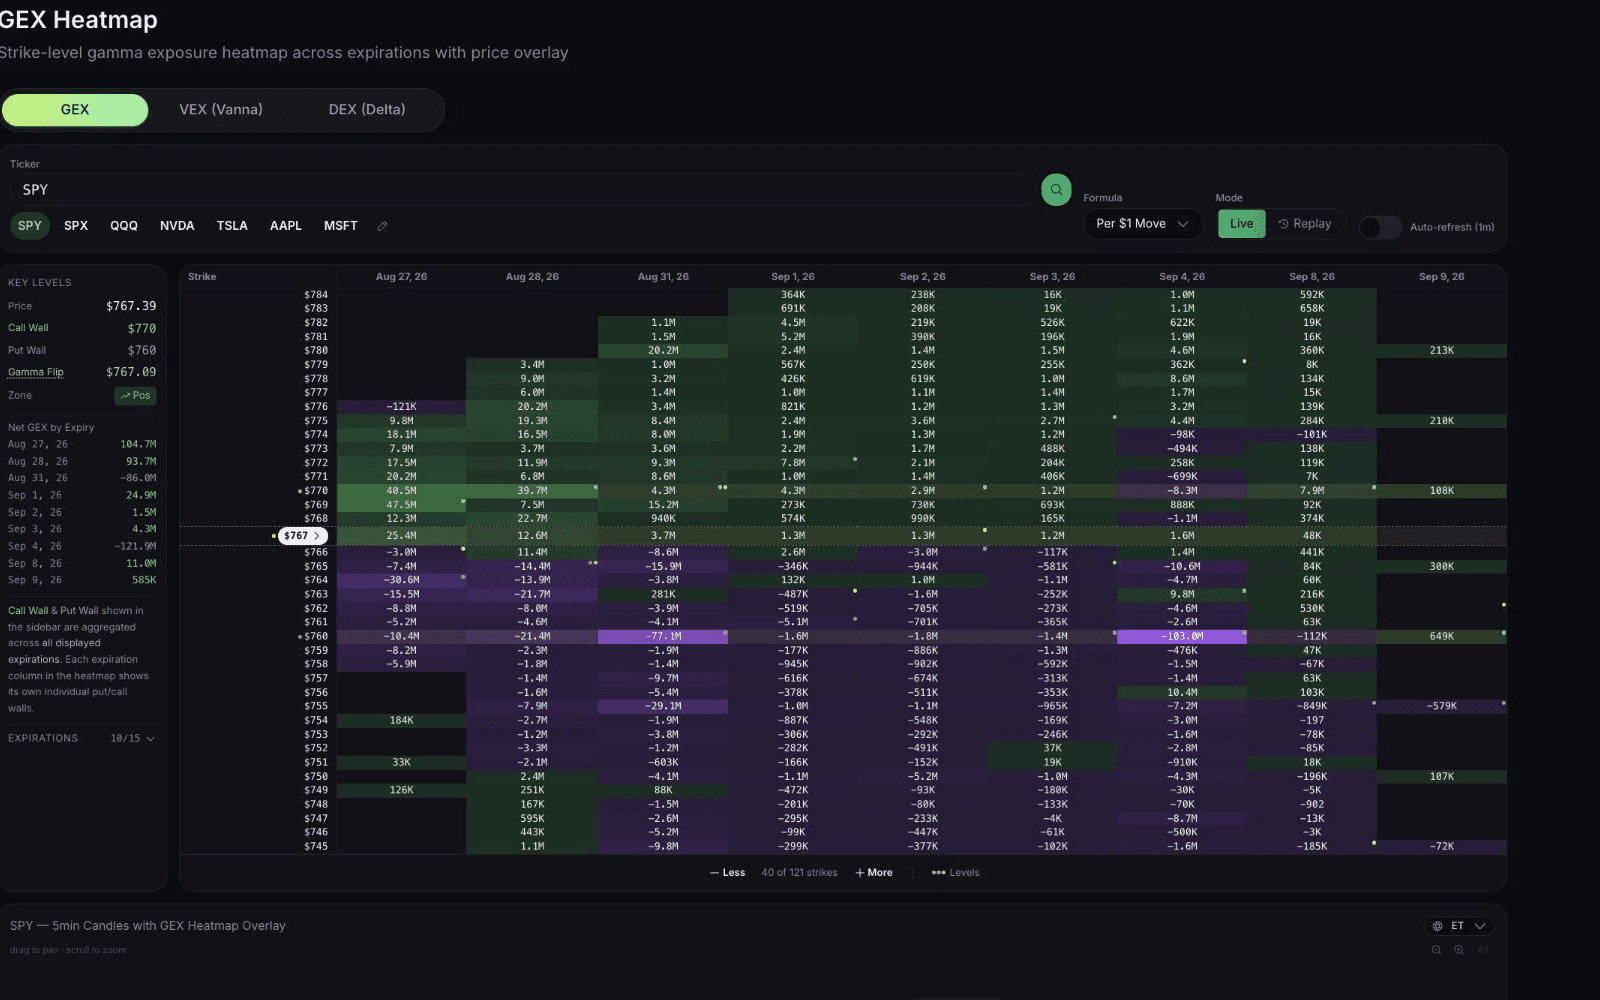
Visualize gamma exposure by strike price. Identify call walls, put walls, and gamma inflection points that drive market behavior.
Gamma Exposure Analytics
Track gamma exposure, identify inflection points, and understand the forces that move markets. Vanna, Charm, and multi-chart workspace included.
$1 for 7 days • Cancel anytime • 14-day money-back guarantee
Capabilities
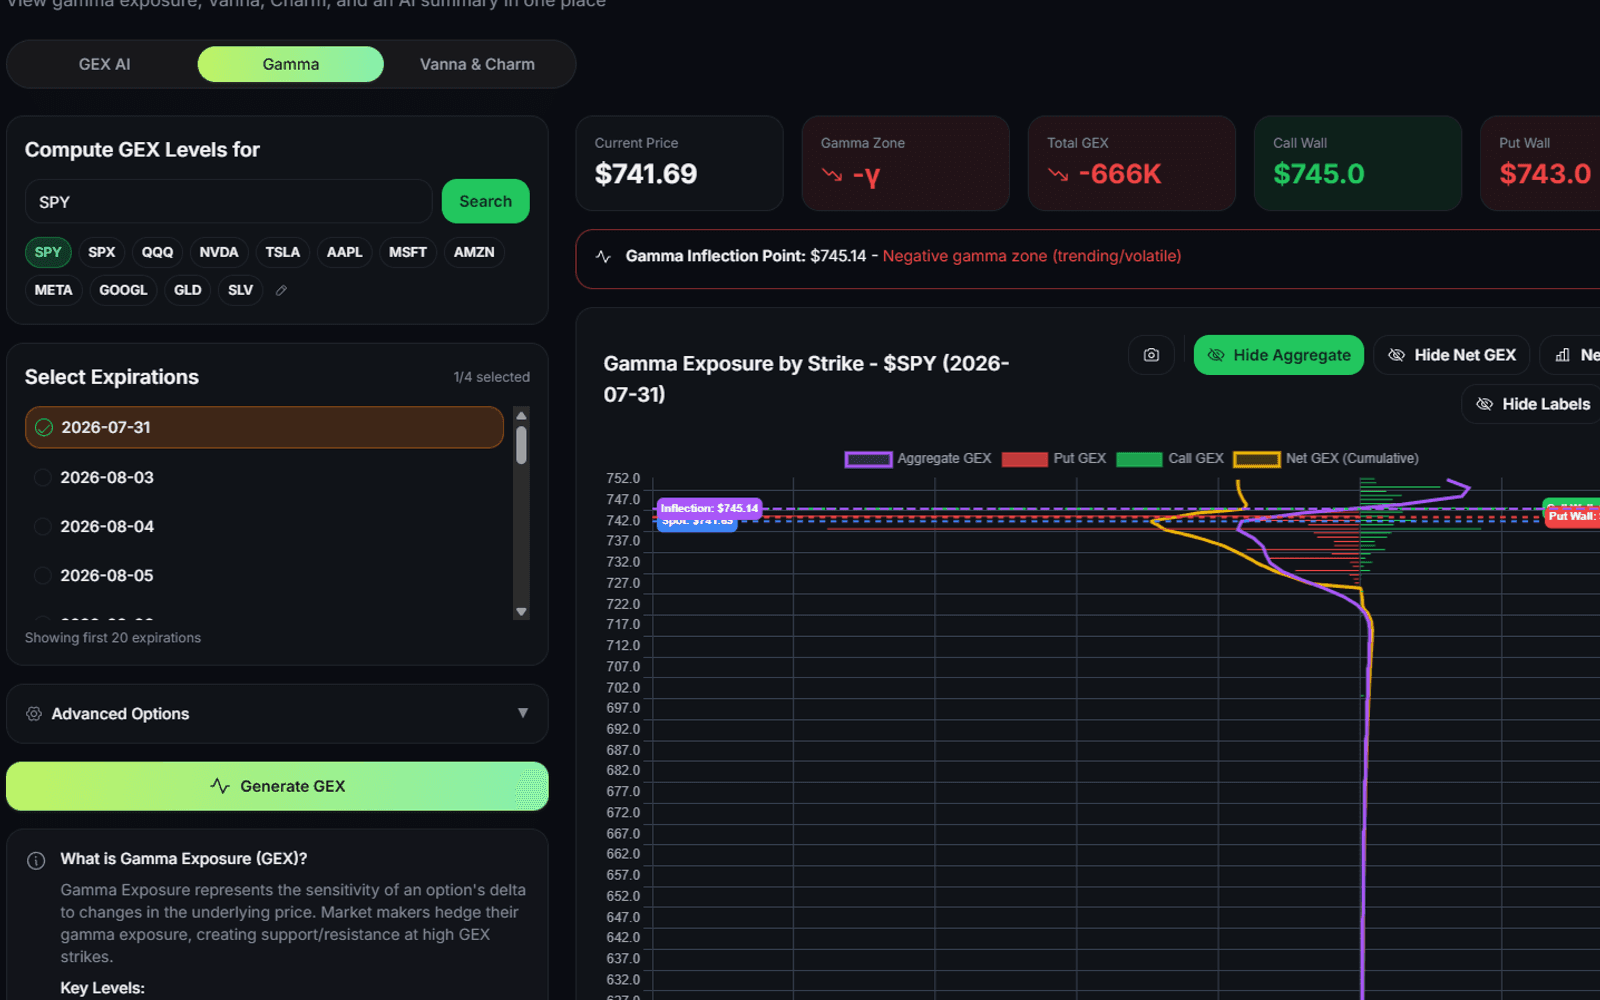
Visualize gamma exposure by strike price. Identify call walls, put walls, and gamma inflection points that drive market behavior.
Understand how delta changes with volatility (Vanna) and time (Charm). Critical for predicting option-driven price moves.
Track when gamma flips from positive to negative or vice versa. Stay ahead of major volatility regime changes.
How it works
Track gamma exposure by strike price: call walls, put walls, and the gamma inflection point.
See how delta changes with volatility (Vanna) and time (Charm) beside the gamma chart.
Build a custom dashboard with up to 20 charts. Monitor gamma, vanna, and charm across multiple tickers simultaneously. Keep your data current with automatic refresh intervals: 30 seconds, 1 minute, 2 minutes, or 5 minutes.
GEX charts describe dealer hedging pressure from listed options, not a forecast. Every trade is yours to place in your own broker.
Continue your workflow
FAQ
GEX Analytics
Join traders who use gamma exposure to understand market dynamics.
$1 for 7 days • Cancel anytime • 14-day money-back guarantee
Options trading involves substantial risk and is not suitable for all investors. QuantWheel provides software for research, analysis, screening, tracking, and workflow support. It does not provide personalized investment advice or guarantee trading outcomes.