The Results tab is the fourth and final tab of the Wheel workflow. It shows how your wheel has performed - income collected, realized P&L, win rate, and a running visualization of open and closed wheel cycles. This is the page you check weekly to confirm the strategy is working, and monthly to decide whether to adjust.
Before you start
Required:
- QuantWheel PRO, QuantWheel GEX, or an active $1 trial.
- At least one connected broker with wheel-strategy trades (CSPs, assignments, covered calls, or called-away events) in the last 90 days.
Time to complete: 5 minutes to read; ongoing weekly and monthly use.
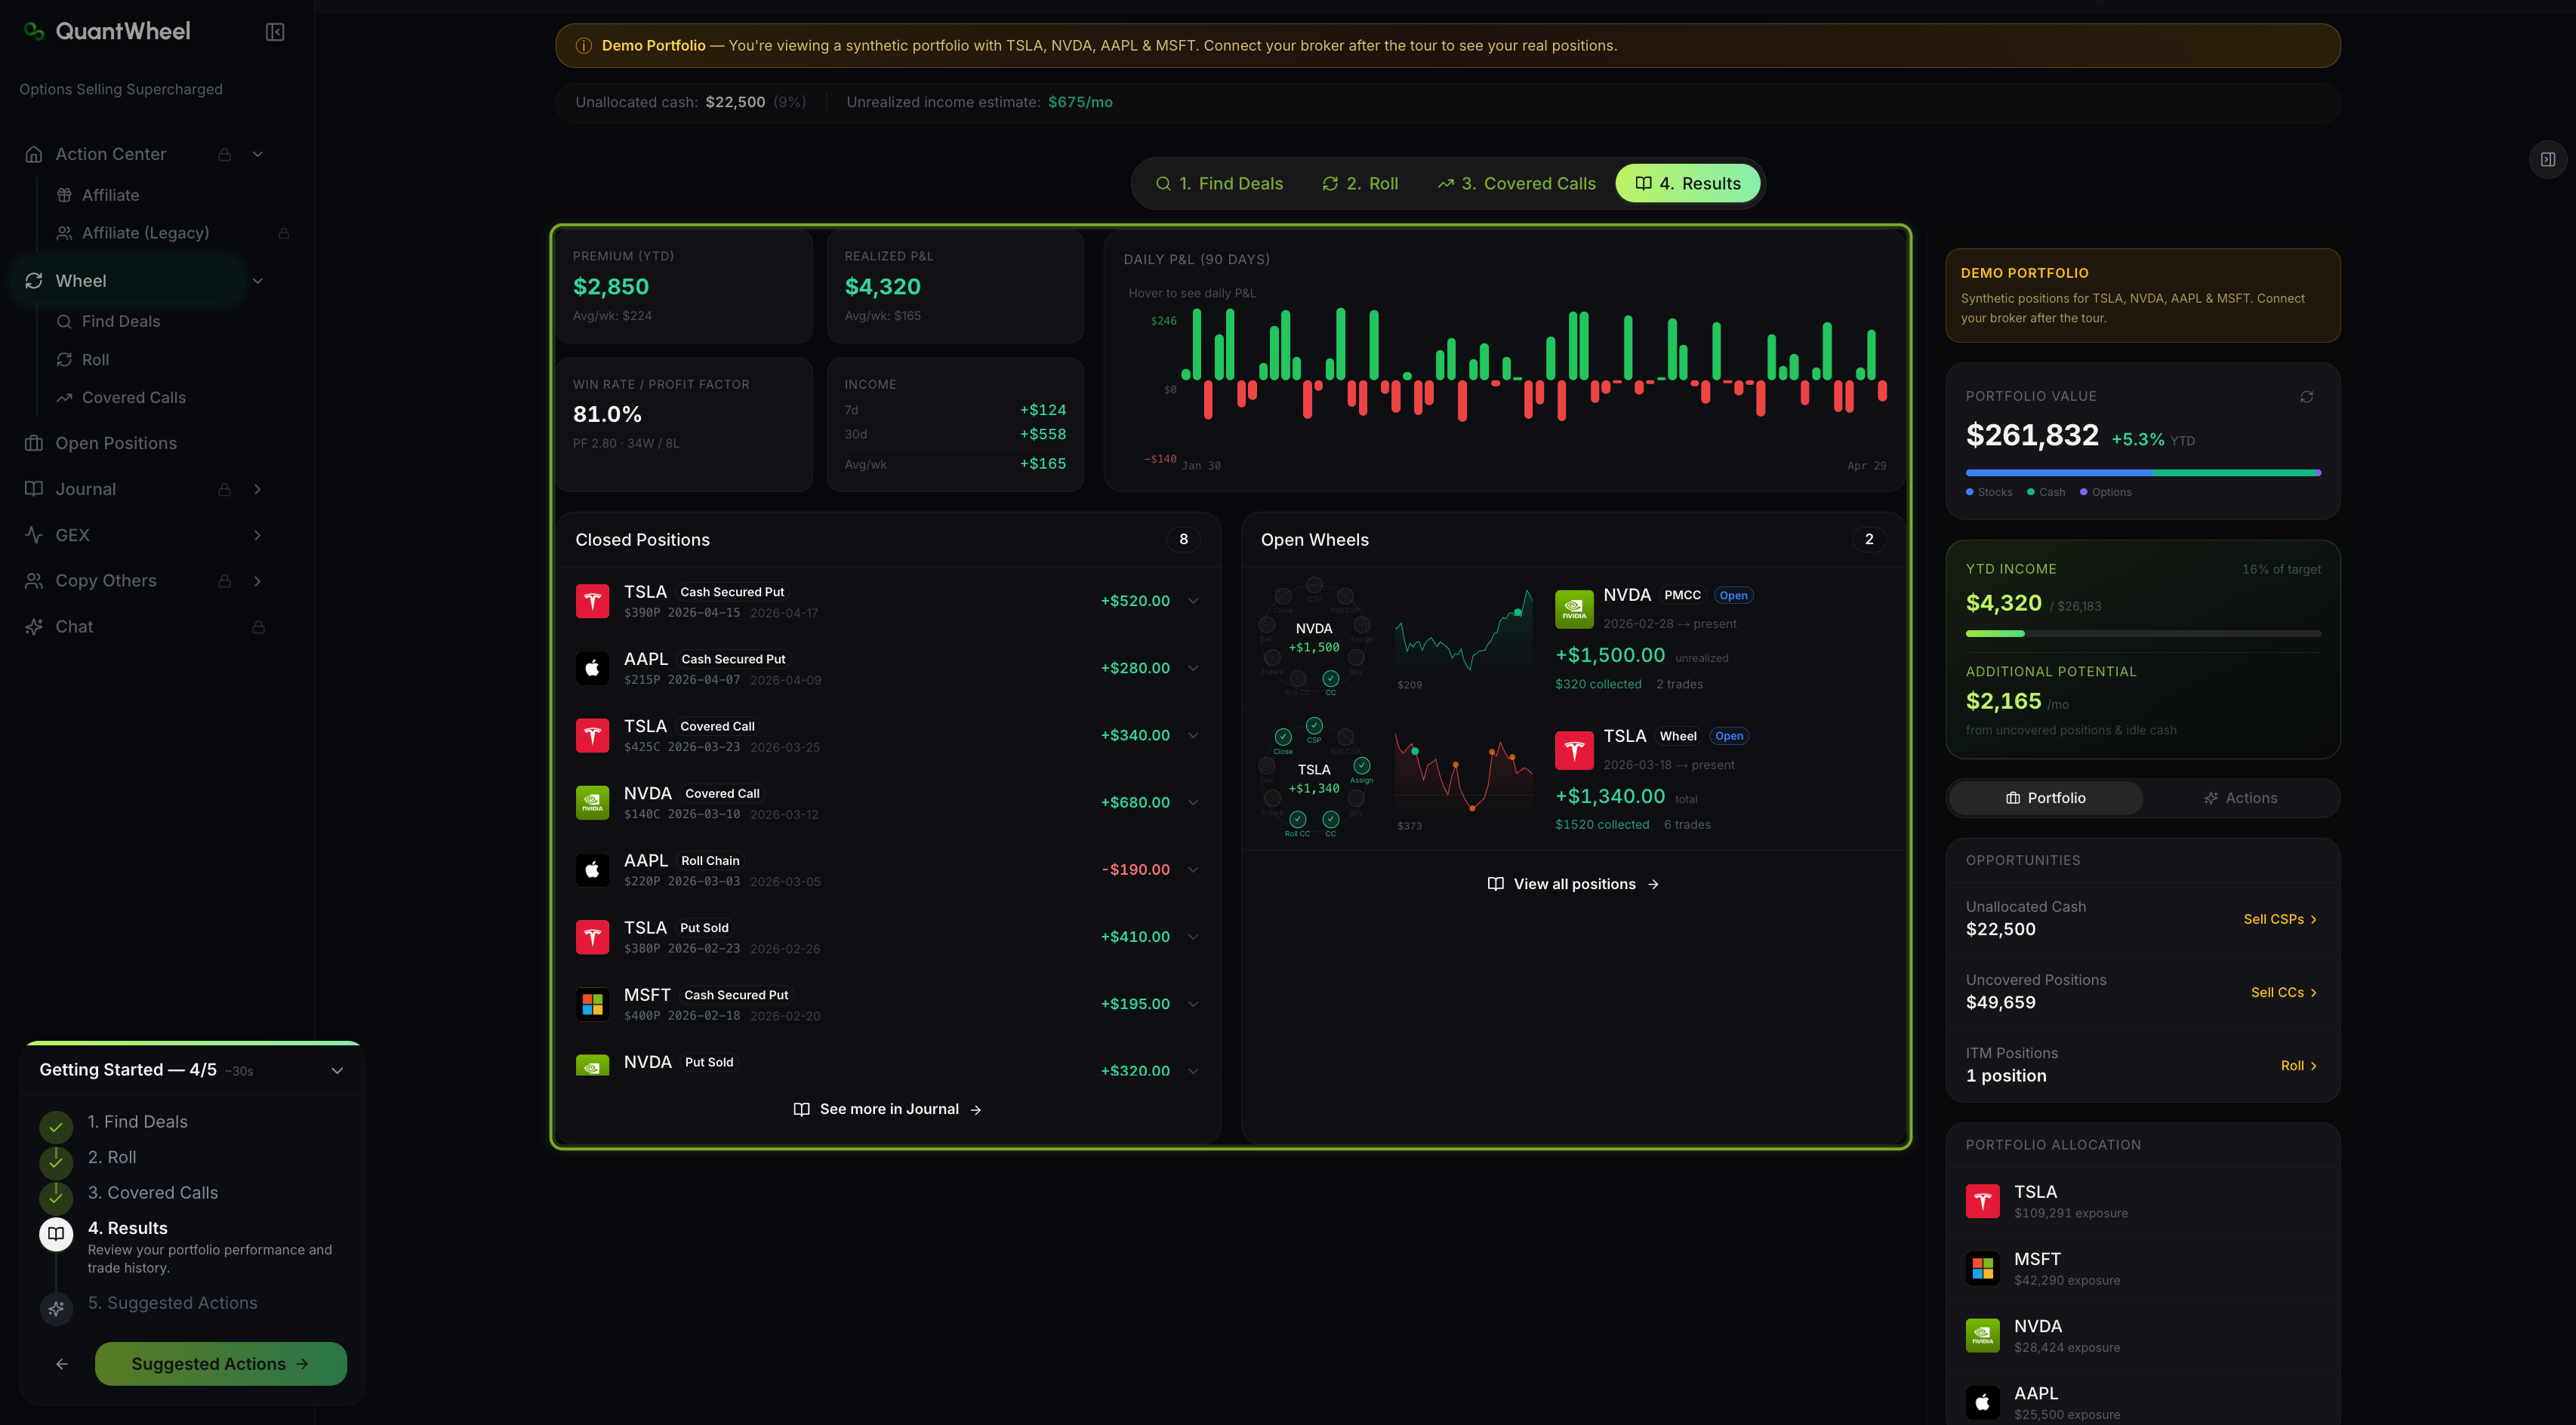
What's on the screen
1. Summary cards at the top
Three top-row cards give the headline numbers:
- Premium (YTD) - total option premium collected so far this year, across every wheel position.
- Realized P&L - realized gain or loss from closed positions. Unlike Premium YTD, this subtracts losses from called-away below cost and any losing covered calls.
- Daily P&L - a 90-day line chart of daily profit/loss, showing whether income is smooth or spiky.
2. Win Rate and Profit Factor card
A second card shows two performance ratios:
- Win Rate - percentage of closed wheel positions that ended profitably. A healthy wheel typically runs 70%+.
- Profit Factor - total gross profit divided by total gross loss. A Profit Factor above 2.0 means you're making $2 for every $1 lost. Values above 5.0 are exceptional.
The card also shows the split (e.g., "52W / 7L" for 52 wins and 7 losses), so you can see whether the ratios come from many small wins or a few large ones.
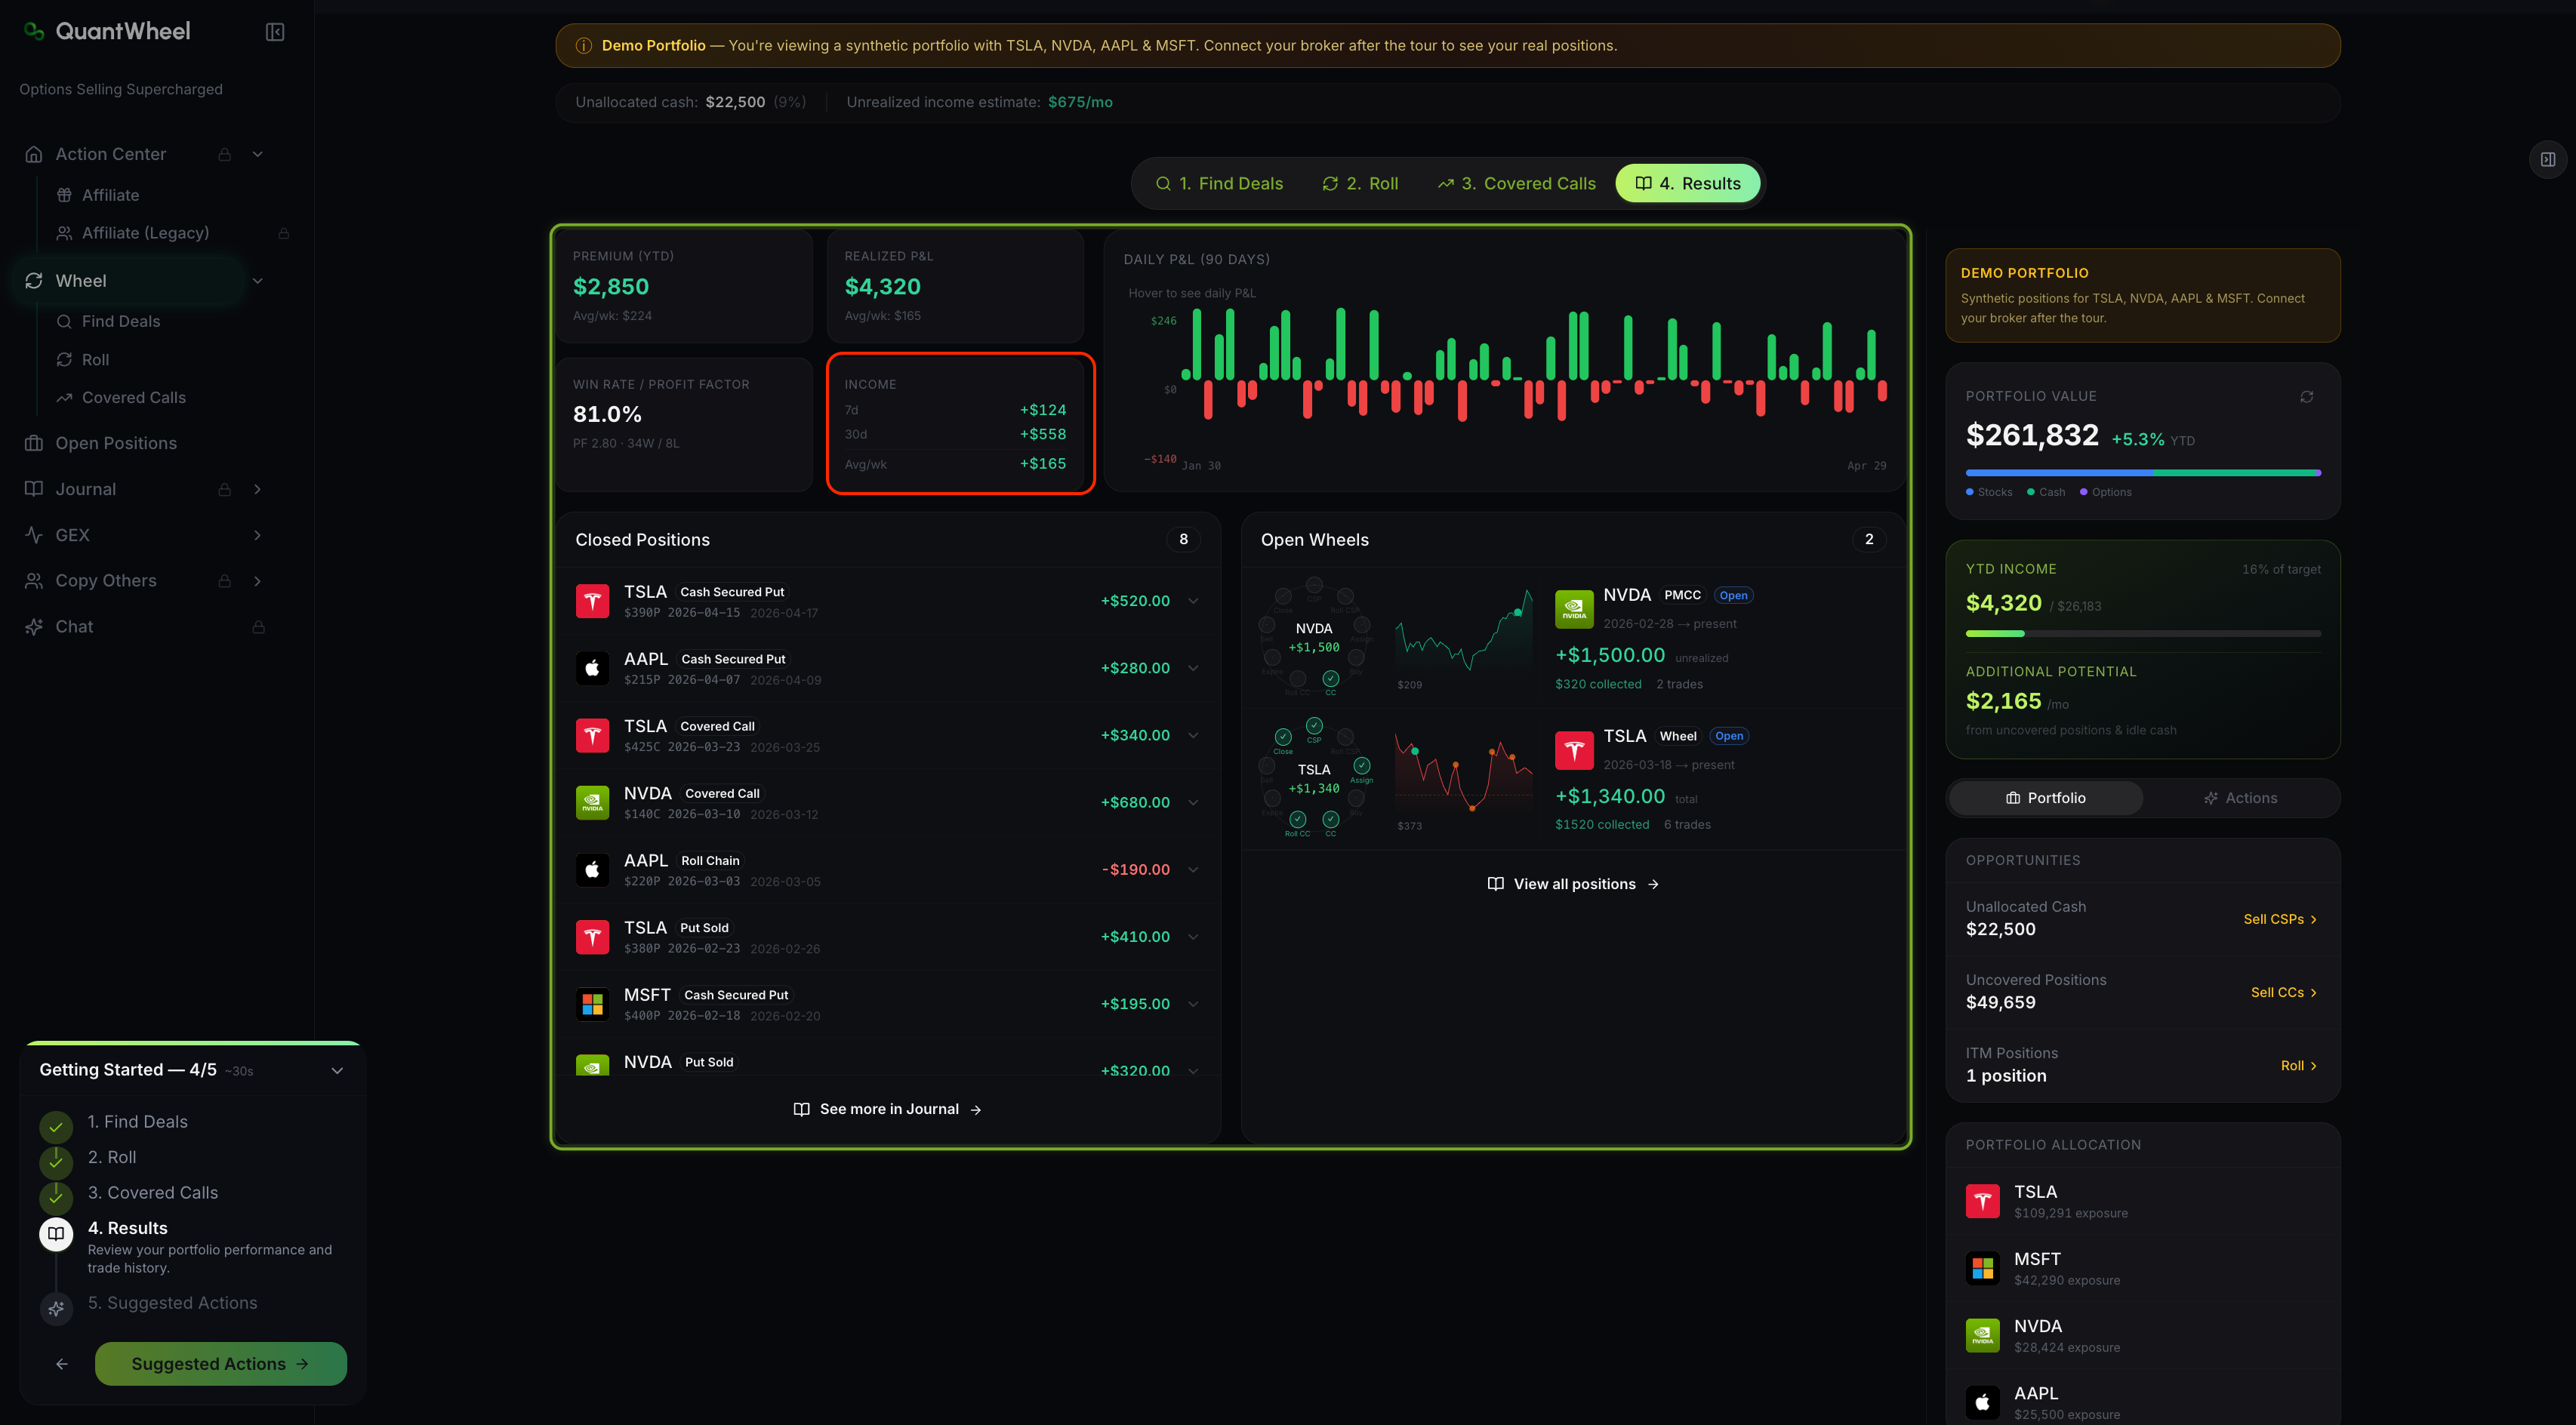
3. Income card
A third card breaks income into four time windows: 7d, 30d, Avg/wk. This lets you see whether recent weeks are trending up, down, or flat relative to your running average - the earliest signal that market conditions have changed your wheel's cadence.\
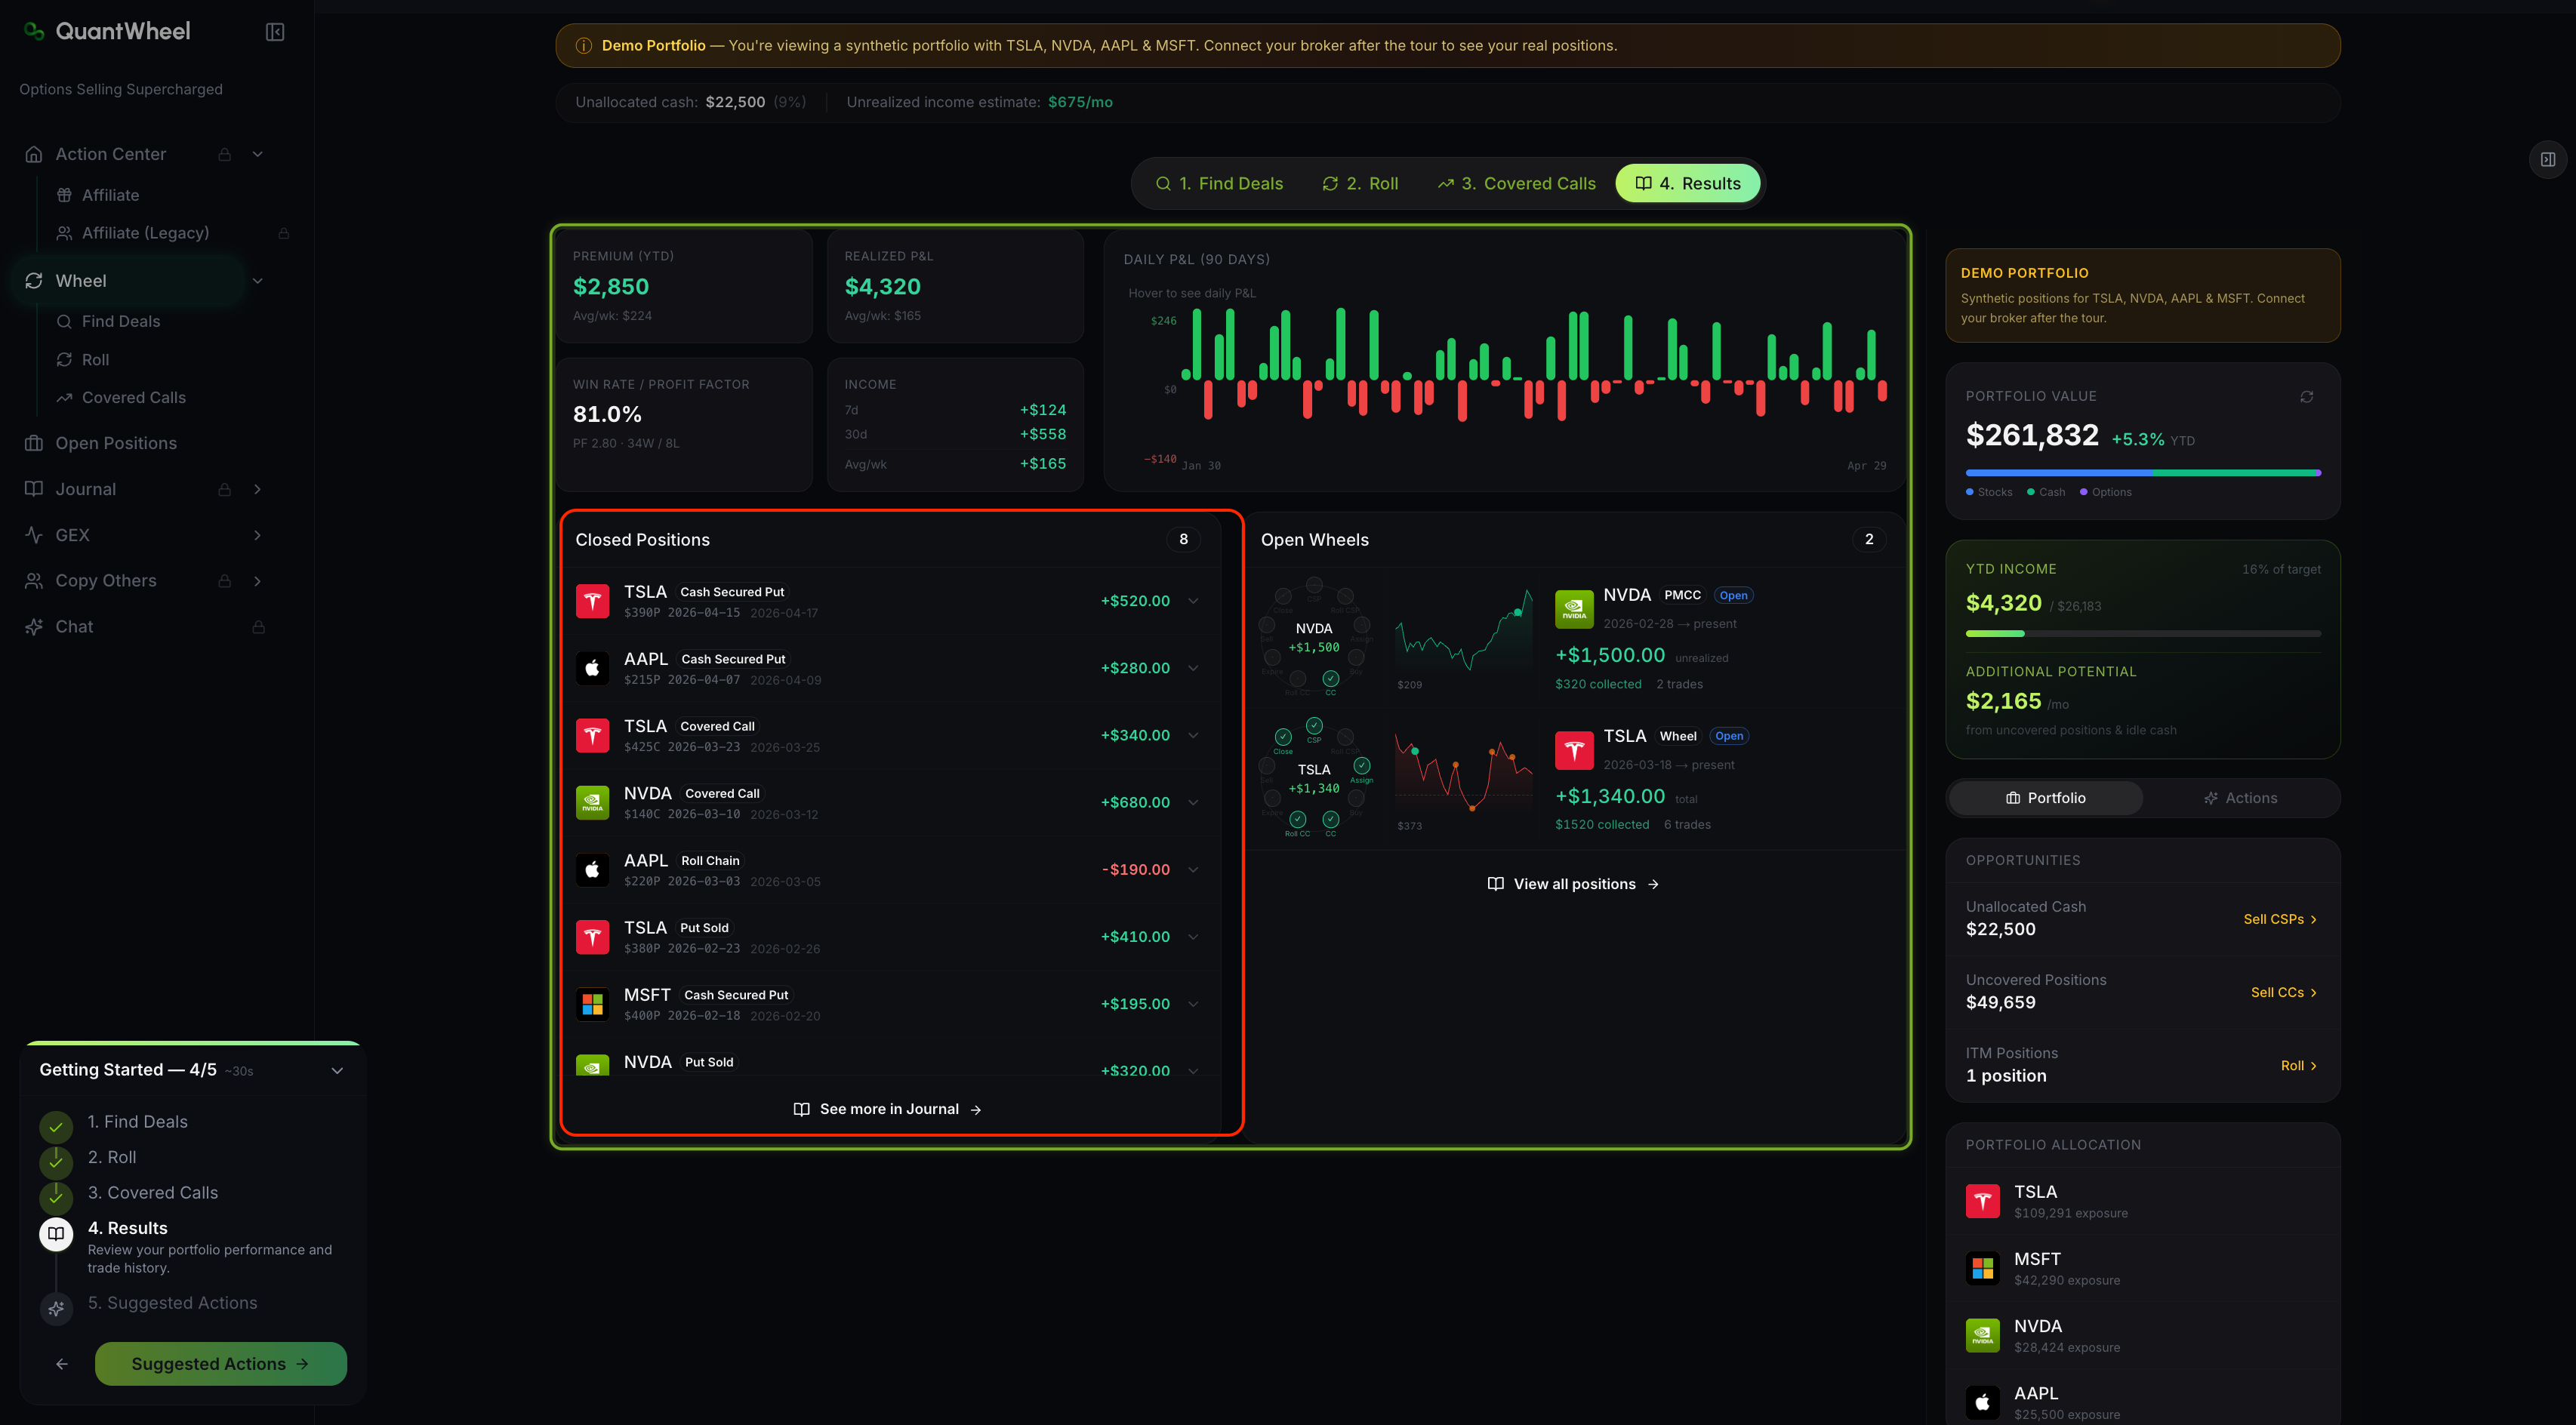
4. Closed Positions list
Below the summary cards, the Closed Positions list shows every wheel cycle that has finished - positions taken from opening CSP through to called-away or closed. Each row includes the ticker, total premium collected, total P&L, duration, and the sequence of actions that completed the cycle.
5. Open Wheels panel
At the bottom, to the right of the closed positions list is the Open Wheels panel.
It visualizes each in-progress wheel cycle on a timeline. For each position, you see which stage of the wheel it's currently in - CSP open, assigned, covered call open, or transitioning - and the premium collected so far on this ticker across all stages.
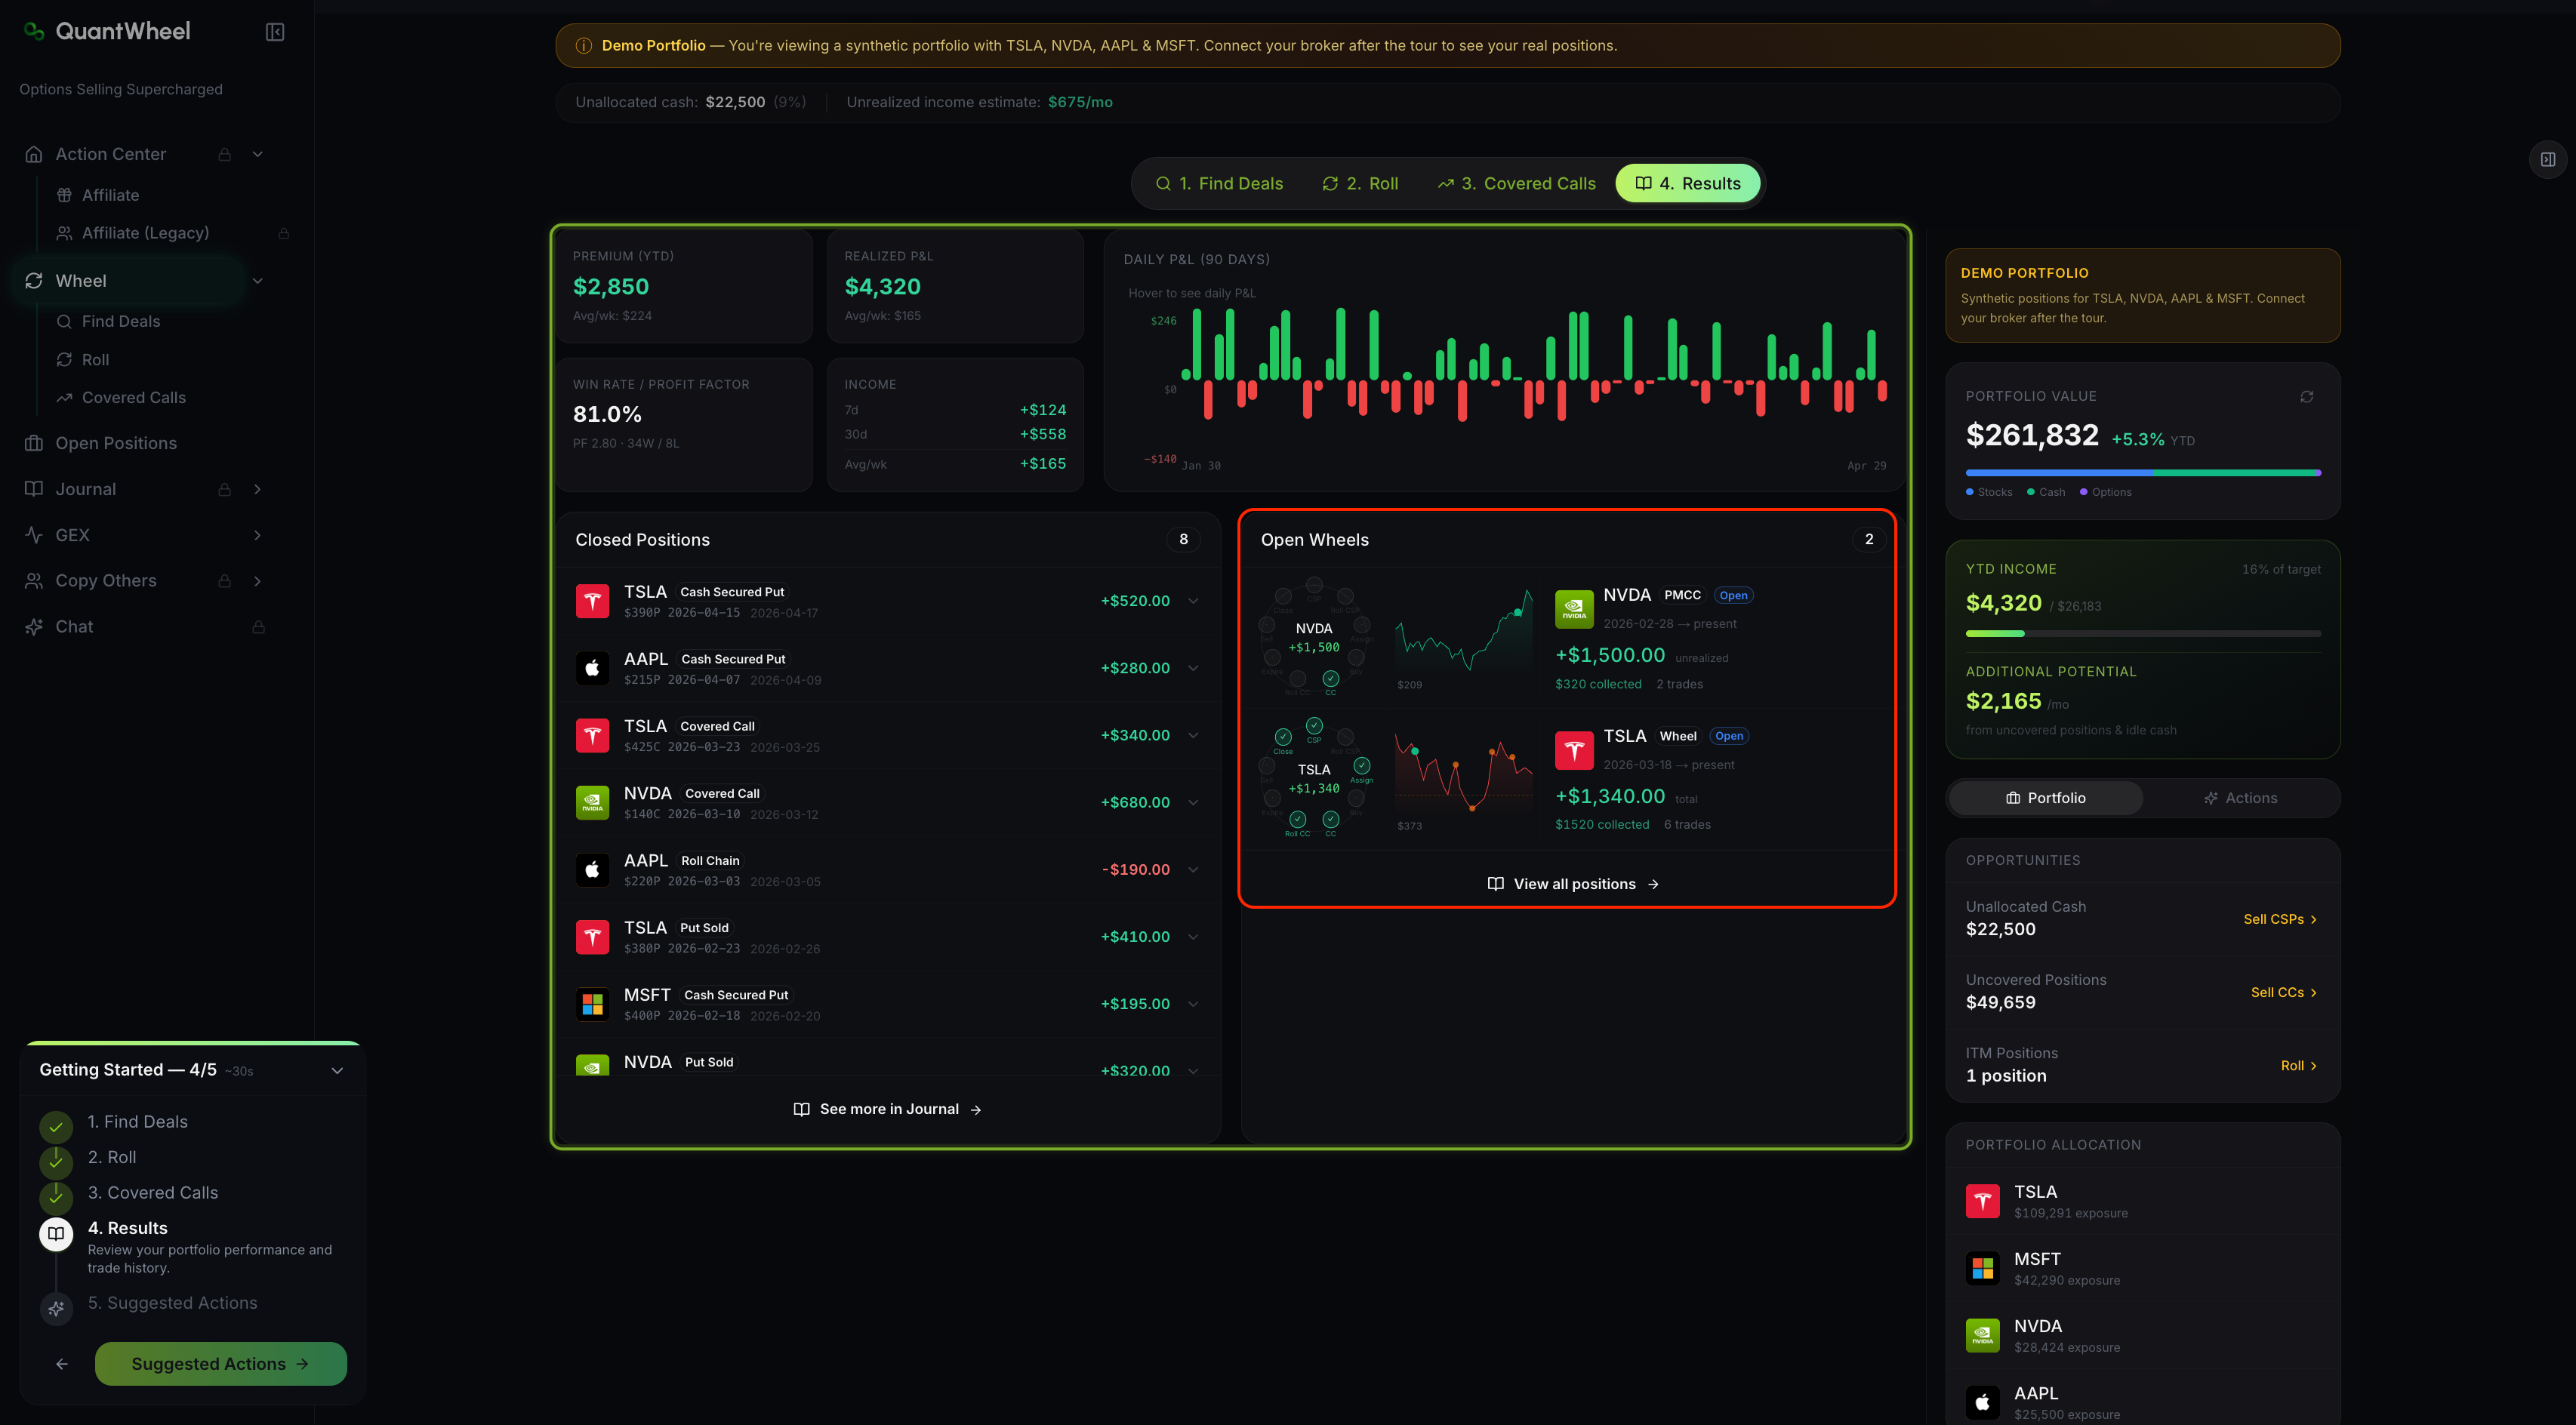
This panel is the main mental-model tool. At a glance, you can see which tickers are making income quietly and which are stuck in a losing stretch.
6. See more in Journal
A "See more in Journal" link at the bottom takes you to the Options Journal, which has deeper analytics - per-ticker performance, calendar view, transaction history, and profit-view charts. Results is the summary; Journal is the deep dive.
How to read Results
Weekly check-in
Look at the 7d income card and the Daily P&L chart's last 7 days. Compare the 7d figure to your Avg/wk. If 7d is materially below average for two or three weeks running, something has shifted - either market conditions (lower IV, fewer screens matching your filters) or your own behavior (you've been slower to redeploy capital).
Monthly review
Check Win Rate and Profit Factor at least monthly. A sudden drop in Win Rate usually means a few recent assignments went against you on stocks that didn't recover. A drop in Profit Factor without a drop in Win Rate means your losses are getting larger, not more frequent.
Quarterly review
Scan the Closed Positions list for patterns. Are particular tickers showing up repeatedly as wins? As losses? A wheel running well on 5 tickers but losing on a 6th suggests either that 6th ticker isn't a good wheel candidate or your filter criteria need adjustment for its sector.
Walkthrough video
🎬 VIDEO: review-wheel-results-walkthrough.mp4
Silent, about 30 seconds. Tours summary cards, Win Rate, Income, Closed Positions, and Open Wheels.
Common issues
Realized P&L is lower than Premium YTD. Why?
Premium YTD counts every dollar of premium collected, including the premium on positions that later lost money elsewhere in the cycle (e.g., a CSP that was assigned, then a covered call that got called away well below cost basis). Realized P&L nets all of that out. Premium YTD is the gross; Realized P&L is the net. Both numbers are useful - Premium tracks activity, Realized P&L tracks profitability.
My Win Rate just dropped after one bad week. Is the wheel broken?
Win Rate is a running ratio, not a trailing window. Adding one losing close to a history of 50 wins moves the rate by a percentage point or two. Don't over-react to short-run changes. What matters is whether the rate is trending down over months, not weeks.
Profit Factor shows a very high number. Can I trust it?
Profit Factor is sensitive to small denominators. If you've had very few losing trades, the ratio can look spectacular (e.g., PF 15) but is based on an insufficient sample. Profit Factor becomes reliable after 30+ closed positions. Before then, treat it as directional, not definitive.
Results shows fewer closed wheels than I remember having.
A "closed wheel" requires the full cycle to complete - at minimum, the opening CSP plus either its expiration or assignment-plus-called-away. Open positions that haven't completed a cycle don't count in Closed Positions; they appear in Open Wheels. If you're missing something you expect to see, check Open Wheels first before concluding the data is wrong.
I want to see per-ticker breakdowns, not aggregate.
Follow the "See more in Journal" link at the bottom of the Results page. The Journal's Per-Ticker tab shows Real Cost, Real P&L, and premium collected for each ticker you've wheeled. See How to view per-ticker performance for the full walkthrough.
Related
Risk disclaimer: Options trading involves substantial risk of loss and is not suitable for all investors. Past performance does not guarantee future results. This content is for educational purposes only and is not investment advice.