Company fundamentals filters screen for financial quality - companies with solid balance sheets, durable earnings, and reasonable valuation. For wheel traders, these filters answer the most important wheel question: if I get assigned, is this a company I'd actually want to own? Options filters tell you about the contract; fundamentals tell you about the business behind it.
Before you start
Required:
- Familiarity with the Find Deals layout. See How to use the Find Deals screener.
- Simple/Advanced toggle set to Advanced.
- Comfort with basic financial metrics. These filters reference concepts from fundamental analysis - not required for the wheel, but useful if you want long-term ownership confidence on every CSP.
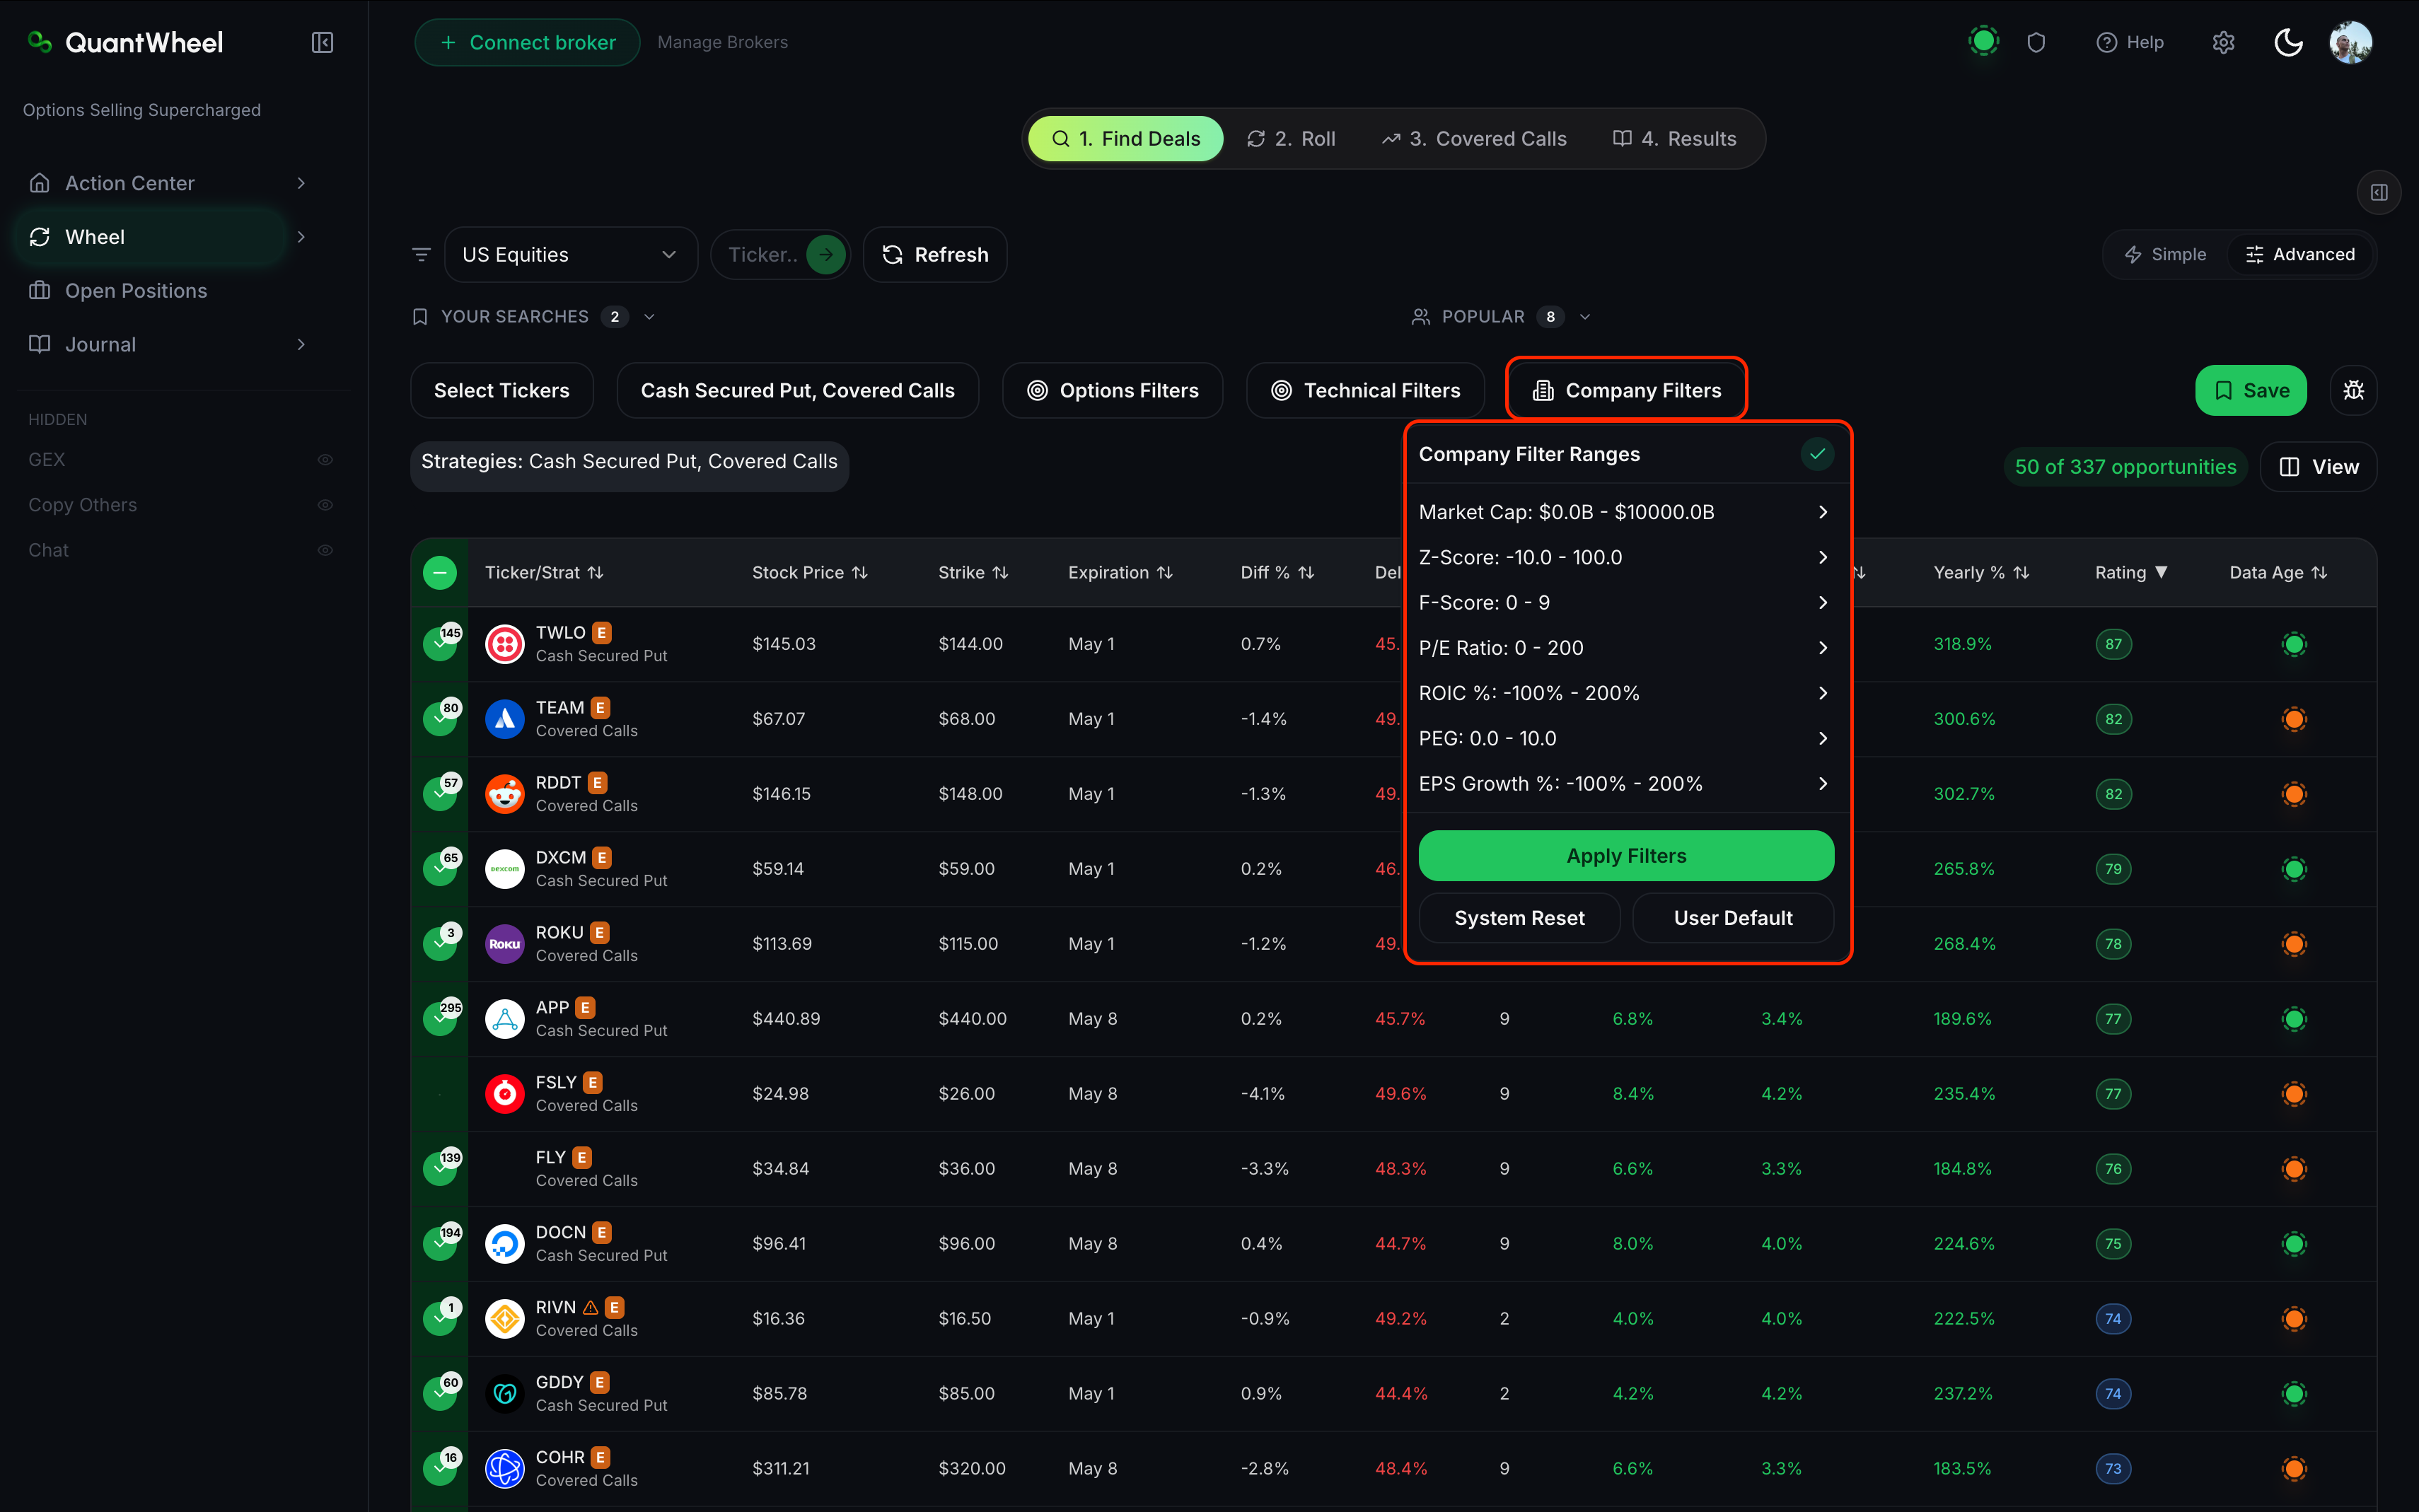
The 7 fundamental filters
Market Cap
What it is: The total dollar value of a company's outstanding shares - share price × shares outstanding. A common size classification: mega-cap ($200B+), large-cap ($10B-$200B), mid-cap ($2B-$10B), small-cap ($300M-$2B), micro-cap (below $300M).
In QuantWheel: A range filter, typically in dollars or billions.
How to use it: Market Cap is primarily a liquidity proxy. Larger-cap stocks have deeper options markets (tighter bid-ask spreads, more open interest) and more stable price behavior. Wheel traders typically filter to mid-cap or larger (roughly $5B+) to avoid thin options chains and wild gap risk. Aggressive traders go smaller for higher IV; conservative traders stay in the mega-cap zone ($50B+).
Z-Score
What it is: Altman Z-Score, a financial-distress predictor. Combines five ratios (working capital, retained earnings, EBIT, market value, sales) relative to total assets into a single score. Higher is healthier.
In QuantWheel: A minimum-value filter.
How to use it: Altman's original thresholds:
- Z > 3.0: Safe zone (low bankruptcy risk)
- 1.8 < Z < 3.0: Grey zone
- Z < 1.8: Distress zone (elevated bankruptcy risk)
For wheel traders, filtering "Z-Score > 1.8" excludes distressed companies. Filtering "Z-Score > 3.0" restricts to financially healthy ones. Useful specifically because assignment on a distressed company can leave you holding a stock with fundamental solvency problems.
F-Score
What it is: Piotroski F-Score, a 0-9 scale that checks nine fundamental criteria (profitability, leverage, liquidity, and operating efficiency). Higher is better.
In QuantWheel: A minimum-value filter.
How to use it: Piotroski's framework:
- F-Score 8-9: Strong fundamentals
- F-Score 4-7: Average
- F-Score 0-3: Weak fundamentals
Filtering "F-Score ≥ 6" is a reasonable quality floor for wheel candidates. F-Score rewards companies that are improving across multiple dimensions at once, not just scoring high on any single metric.
P/E (Price-to-Earnings Ratio)
What it is: Share price divided by earnings per share. Measures how much investors are paying for each dollar of current earnings.
In QuantWheel: A range filter.
How to use it: P/E varies wildly by sector (utilities 15-20, tech 25-40, high-growth 50+). For wheel traders, P/E filtering is less about "cheap vs. expensive" and more about "avoid stocks with broken or missing earnings." Filtering "P/E > 0" excludes companies currently unprofitable. Filtering "P/E < 50" excludes growth-priced stocks where a miss would trigger a sharp correction.
ROIC % (Return on Invested Capital)
What it is: Net operating profit after tax divided by invested capital, expressed as a percentage. Measures how efficiently a company turns capital into profit.
In QuantWheel: A minimum-value filter.
How to use it: ROIC is one of the cleanest quality metrics - a sustained ROIC above the company's cost of capital (usually 8-10%) signals genuine value creation. Filtering "ROIC > 10%" restricts to businesses that earn real returns on the capital they deploy. Wheel candidates with ROIC above 15% are generally high-quality by any fundamental standard.
PEG (Price/Earnings-to-Growth Ratio)
What it is: P/E ratio divided by the earnings growth rate. Normalizes valuation against growth so you can compare a 20-P/E slow-grower to a 40-P/E fast-grower on a level field.
In QuantWheel: A range filter.
How to use it: The classic Peter Lynch heuristic:
- PEG < 1.0: Potentially undervalued relative to growth
- PEG ~ 1.0: Fairly priced
- PEG > 2.0: Potentially overvalued relative to growth
Filter "PEG < 1.5" to exclude extremely growth-priced stocks. PEG is more useful than raw P/E when mixing across growth profiles.
EPS Growth %
What it is: The percentage change in earnings per share over a recent period (typically year-over-year).
In QuantWheel: A range filter.
How to use it: Strong, consistent EPS growth is the fundamental signal of a healthy business. Filter "EPS Growth > 0" to exclude companies with flat or declining earnings. More aggressive: filter "EPS Growth > 10%" for growth-oriented wheel candidates. Note that a single year's EPS growth can be misleading - if QuantWheel shows a trailing metric, one good year can mask multi-year stagnation.
Common issues
Using all 7 fundamental filters returns almost nothing.
Fundamental filters stack aggressively. A screen asking for "Market Cap > $50B AND Z-Score > 3 AND F-Score ≥ 7 AND ROIC > 15% AND PEG < 1.5" will find maybe 10 companies in the whole market. Start with 2 or 3 fundamental filters and expand from there.
Fundamentals don't match recent news on a ticker.
Fundamental data is typically reported quarterly or annually - there's lag between when business reality changes and when the metrics update. A company's Z-Score today reflects last quarter's balance sheet, not this week's news. Use technical filters (Momentum, Sentiment) to catch recent shifts.
Why would I filter fundamentals if I'm only holding options, not the stock?
Because the wheel strategy explicitly accepts assignment. Every CSP you sell is a conditional commitment to own 100 shares at the strike. If that commitment is triggered on a fundamentally weak company, you've bought a bag of problems. Fundamentals filtering is how you prevent that.
Which fundamental metric matters most for the wheel?
Z-Score is the single best "avoid a disaster" filter. Companies that enter distress usually show it in the Z-Score well before the stock collapses. If you only use one fundamental filter, use Z-Score.
What if a stock passes my fundamentals filter but I still wouldn't want to own it?
Fundamentals are a necessary filter, not a sufficient one. Pass them through fundamentals, then apply your own judgment on business quality, industry dynamics, and what you'd pay. Tools screen; humans decide.
Related
- How to use the Find Deals screener
- How to filter by options metrics
- How to filter by technical indicators
- How to save and reuse filter combinations
Risk disclaimer: Options trading involves substantial risk of loss and is not suitable for all investors. Past performance does not guarantee future results. This content is for educational purposes only and is not investment advice.