The Free Earnings Scanner surfaces upcoming earnings reports where the options market's implied move may differ from typical historical earnings moves. It's a starting point for earnings-season trade ideas - if the market is pricing in an unusually large or unusually small move relative to history, that's often a signal worth investigating.
Free to use. No account required.
What this tool does
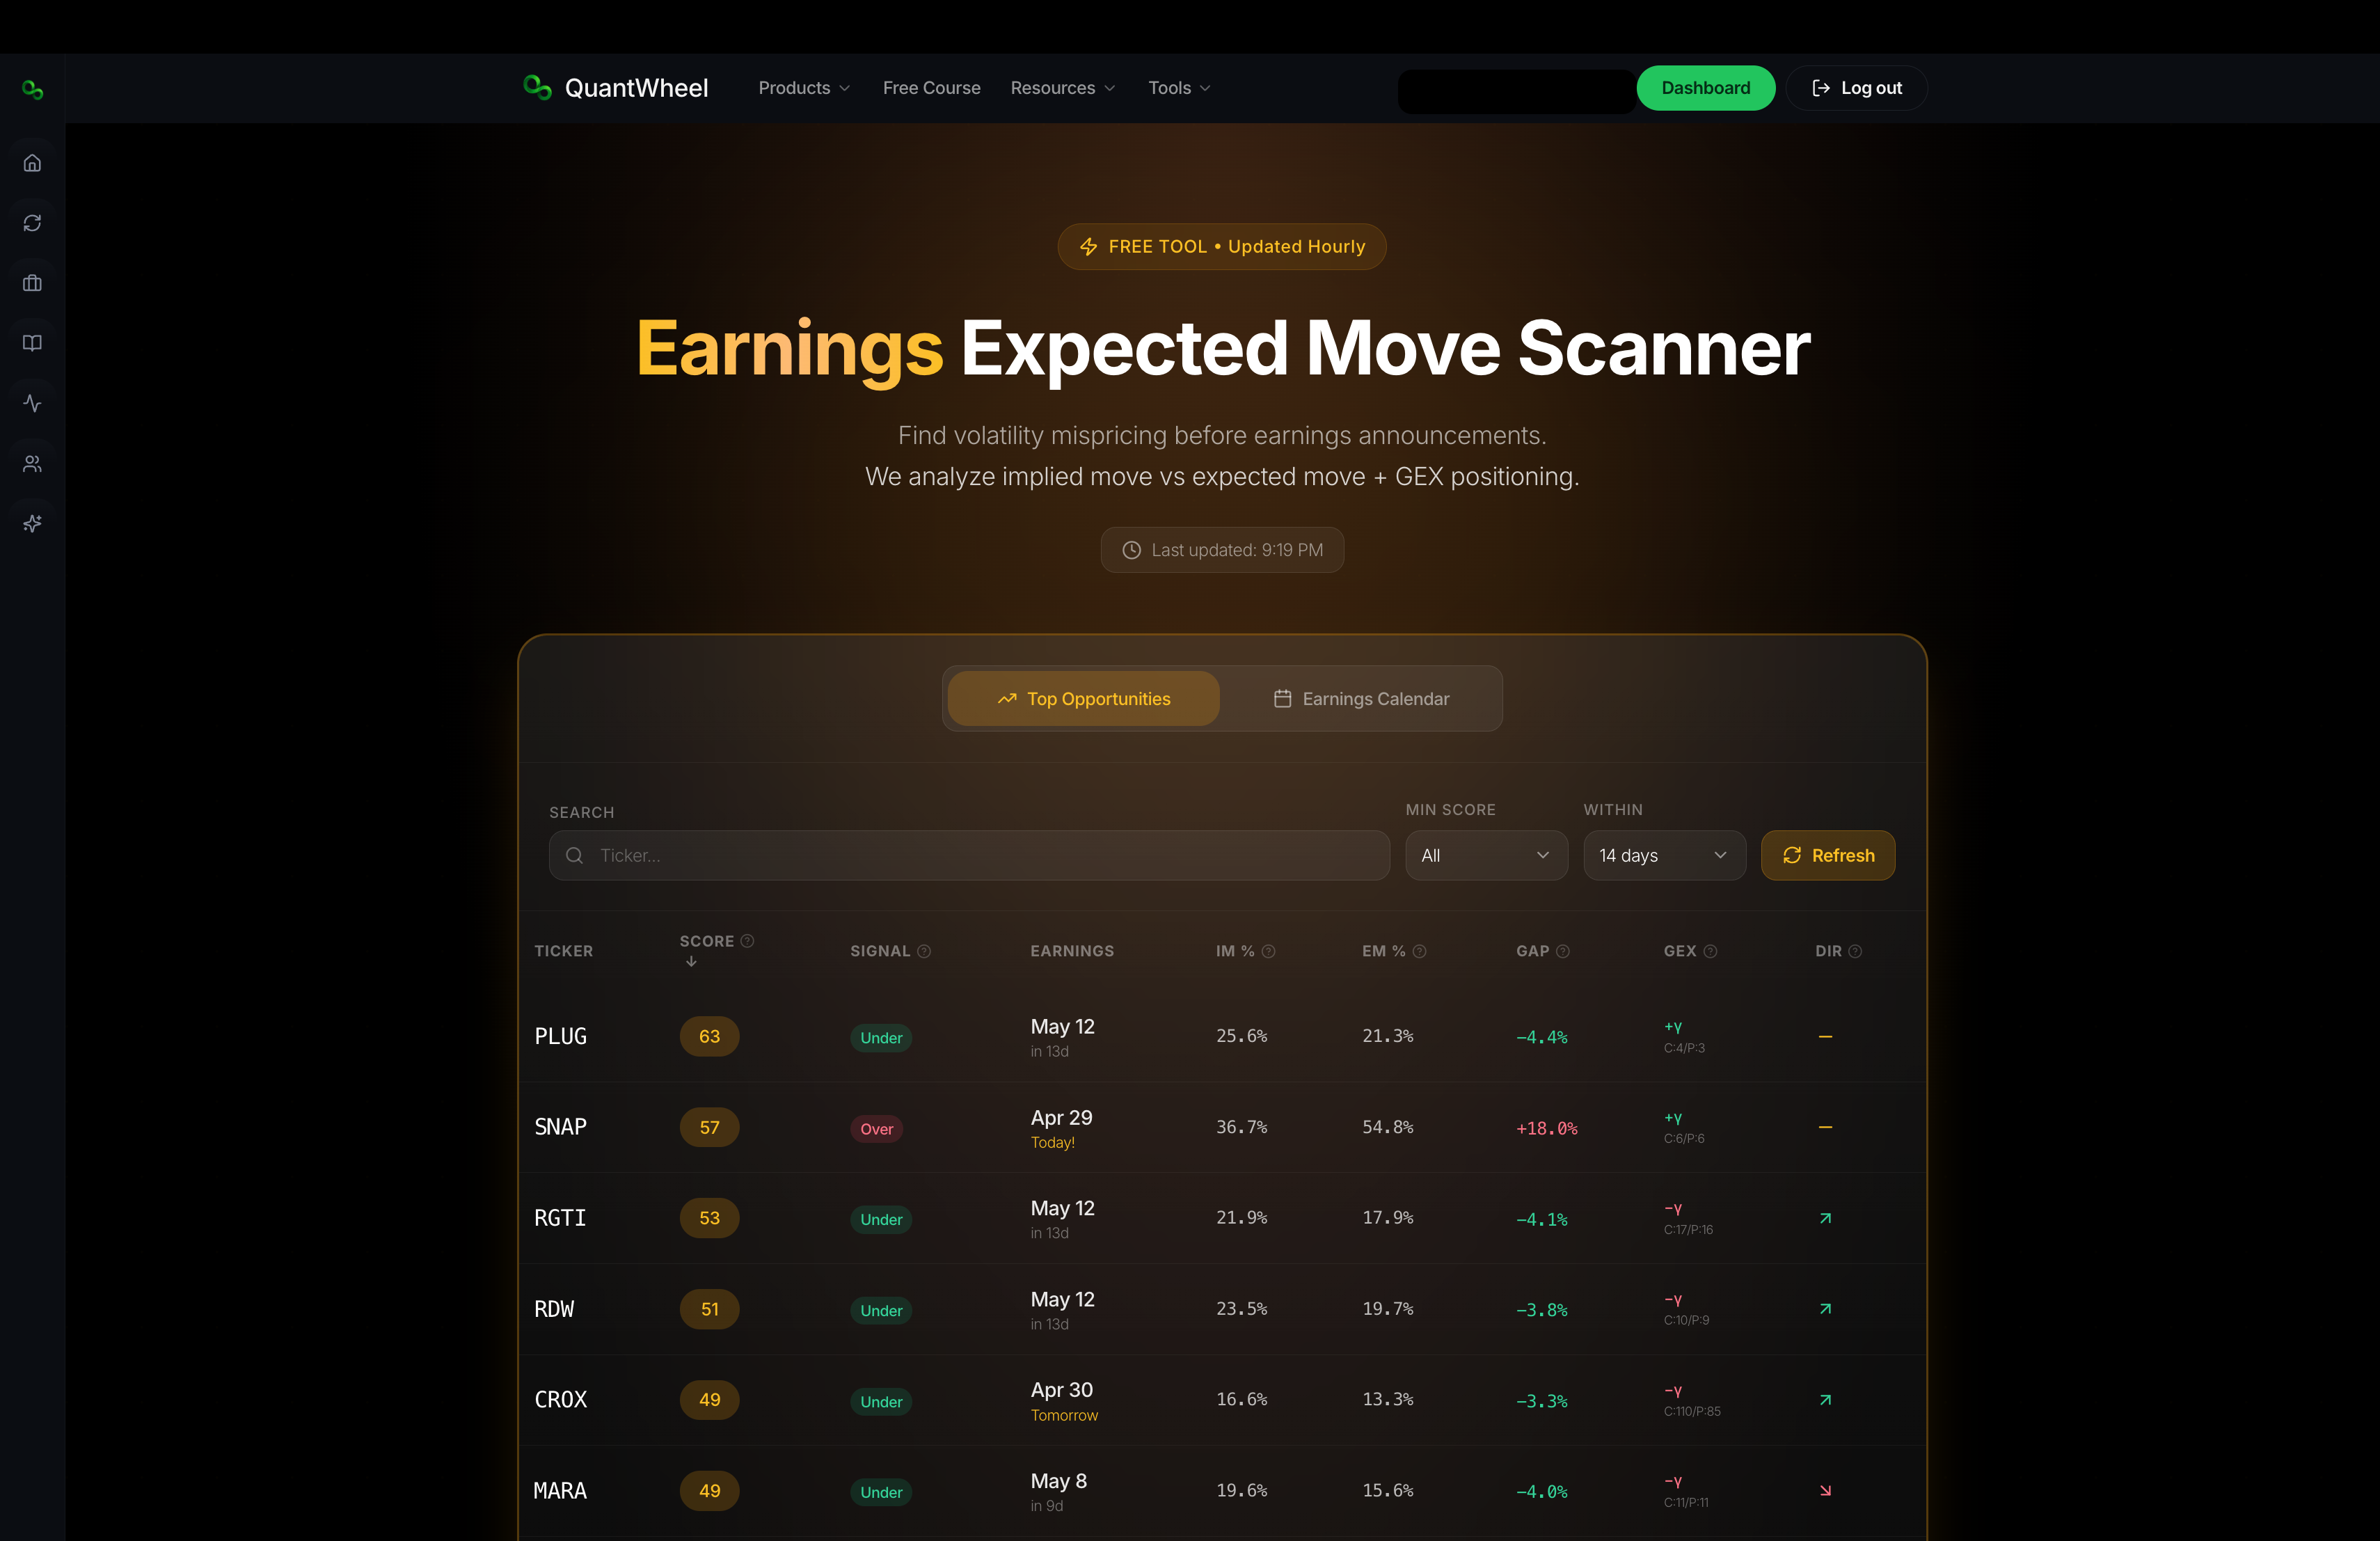
For each upcoming earnings date, the scanner computes:
- Implied move - the magnitude of price movement the options market is currently pricing in (derived from at-the-money straddle premium)
- Historical average move - the typical absolute move over the last several earnings reports
- Difference - how the current implied move compares to history
- Report date and time - exactly when the release drops (BMO = before market open, AMC = after market close)
Tickers where implied move is much larger or much smaller than history get flagged.
Who it's for
Options traders who want to scan the earnings calendar efficiently. Useful for:
- Finding earnings straddles or strangles worth selling (when implied > historical)
- Finding event-driven long setups (when implied < historical, but conviction suggests a bigger move)
- Avoiding earnings on your existing positions you don't want exposure to
- General earnings-week awareness
How to use it
- Open the scanner - shows upcoming earnings, typically the next 1-2 weeks
- Filter by date range, market cap, or sector if the default list is too broad
- Sort by the "Implied vs. Historical" column to surface the biggest mismatches at the top
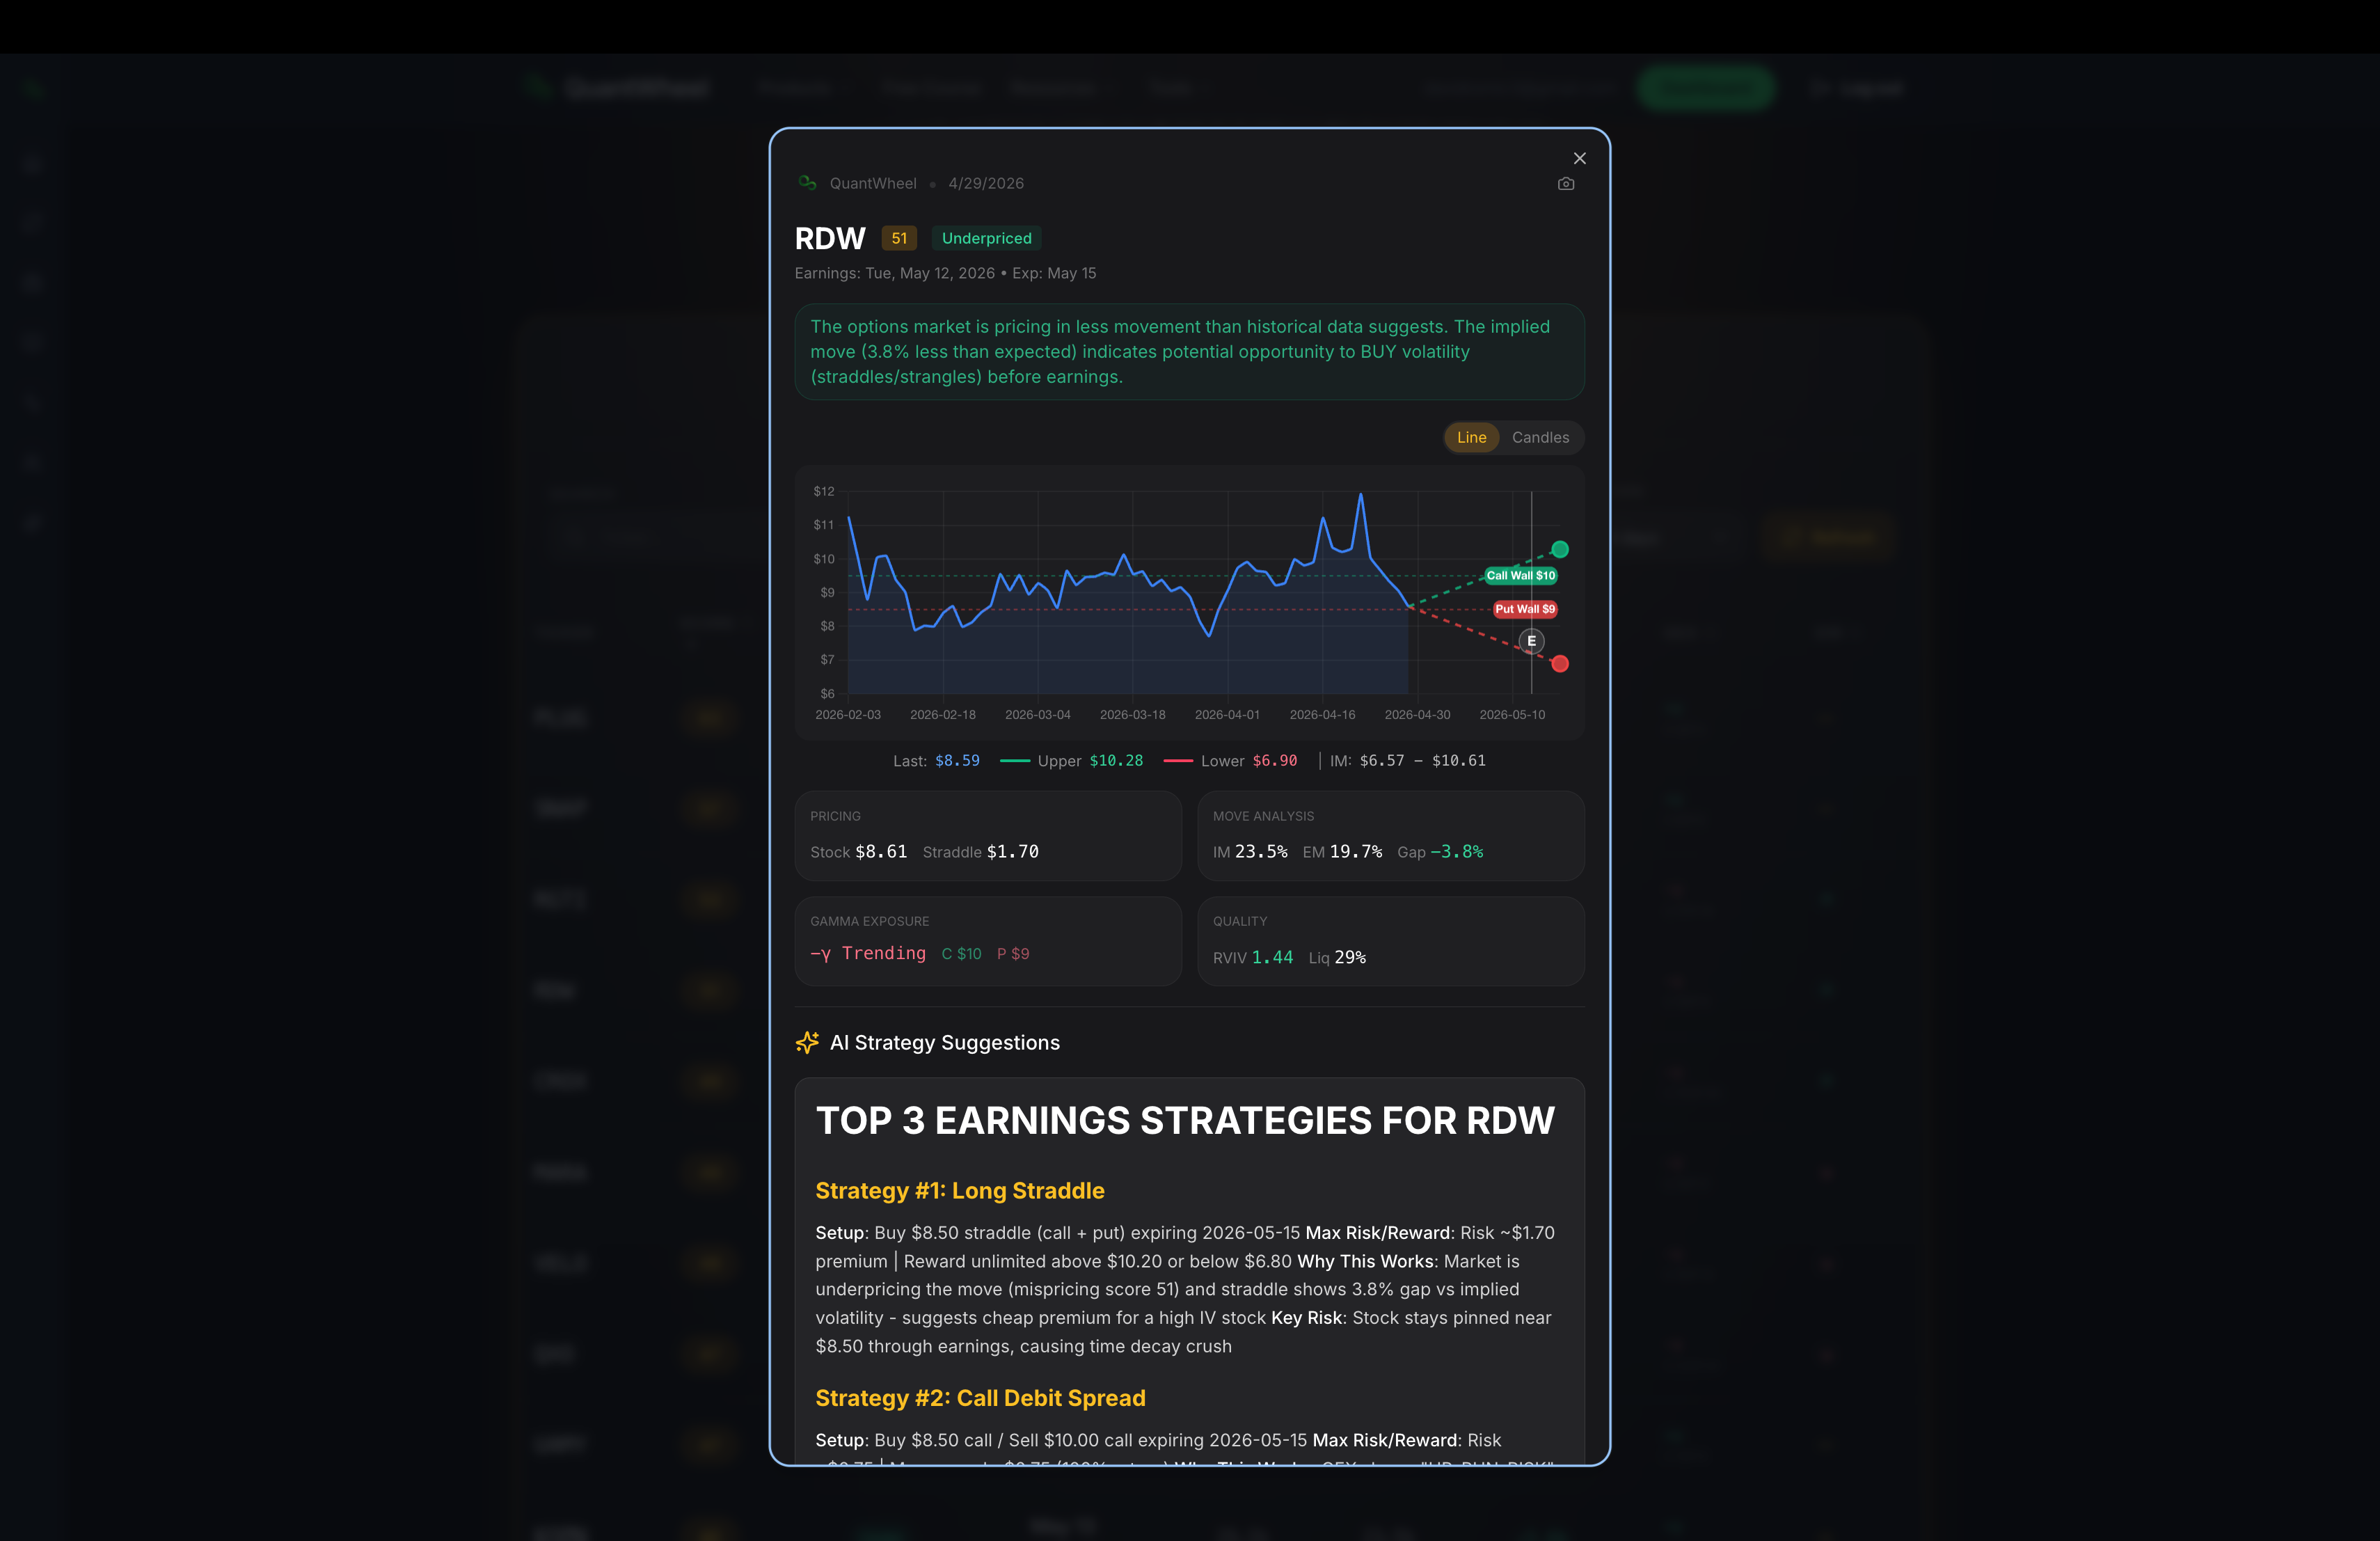
- Click any ticker to see its implied move, history, and a breakdown
How to interpret the results
Implied move > historical average - the options market is pricing in more movement than typical.
Common causes for this are: known catalysts (guidance revision, product launch), recent stock momentum, elevated overall volatility. Sometimes overpriced, sometimes warranted.
Implied move < historical average - the market is complacent.
Sometimes this is justified (low-drama earnings, mature business), sometimes it's a setup for a surprise move.
Implied move ≈ historical average - the market is pricing earnings efficiently against history. Less opportunity for a contrarian play.
What this tool doesn't do
- Doesn't predict earnings direction (up or down). Only magnitude.
- Doesn't account for announcement-specific factors (management change, macro context, recent news) - those are your job to weigh.
- Doesn't guarantee past patterns will continue. A stock that moved 5% on each of the last 4 earnings can still move 15% this time.
Use it as one input in your earnings research, not as a standalone signal.
Limitations of the free version
The Free Earnings Scanner shows the next 1-2 weeks with basic filtering. A deeper workflow typically wants:
- Extended date horizons - seeing the full earnings calendar out 4+ weeks
- Integration with your watchlist - only scanning stocks you care about
- Deeper historical data - move patterns from 8+ quarters instead of 4
- Options chain integration - jumping directly into a CSP, strangle, or iron condor screen on any flagged ticker
These live in QuantWheel's authenticated screener workflows - the Find Deals screener includes earnings-aware filters for options traders.
Related tools
- Free Options Calculator - model P&L and Greeks for any option position
- Free Strategy Explorer - visualize multi-leg earnings plays like strangles and iron condors