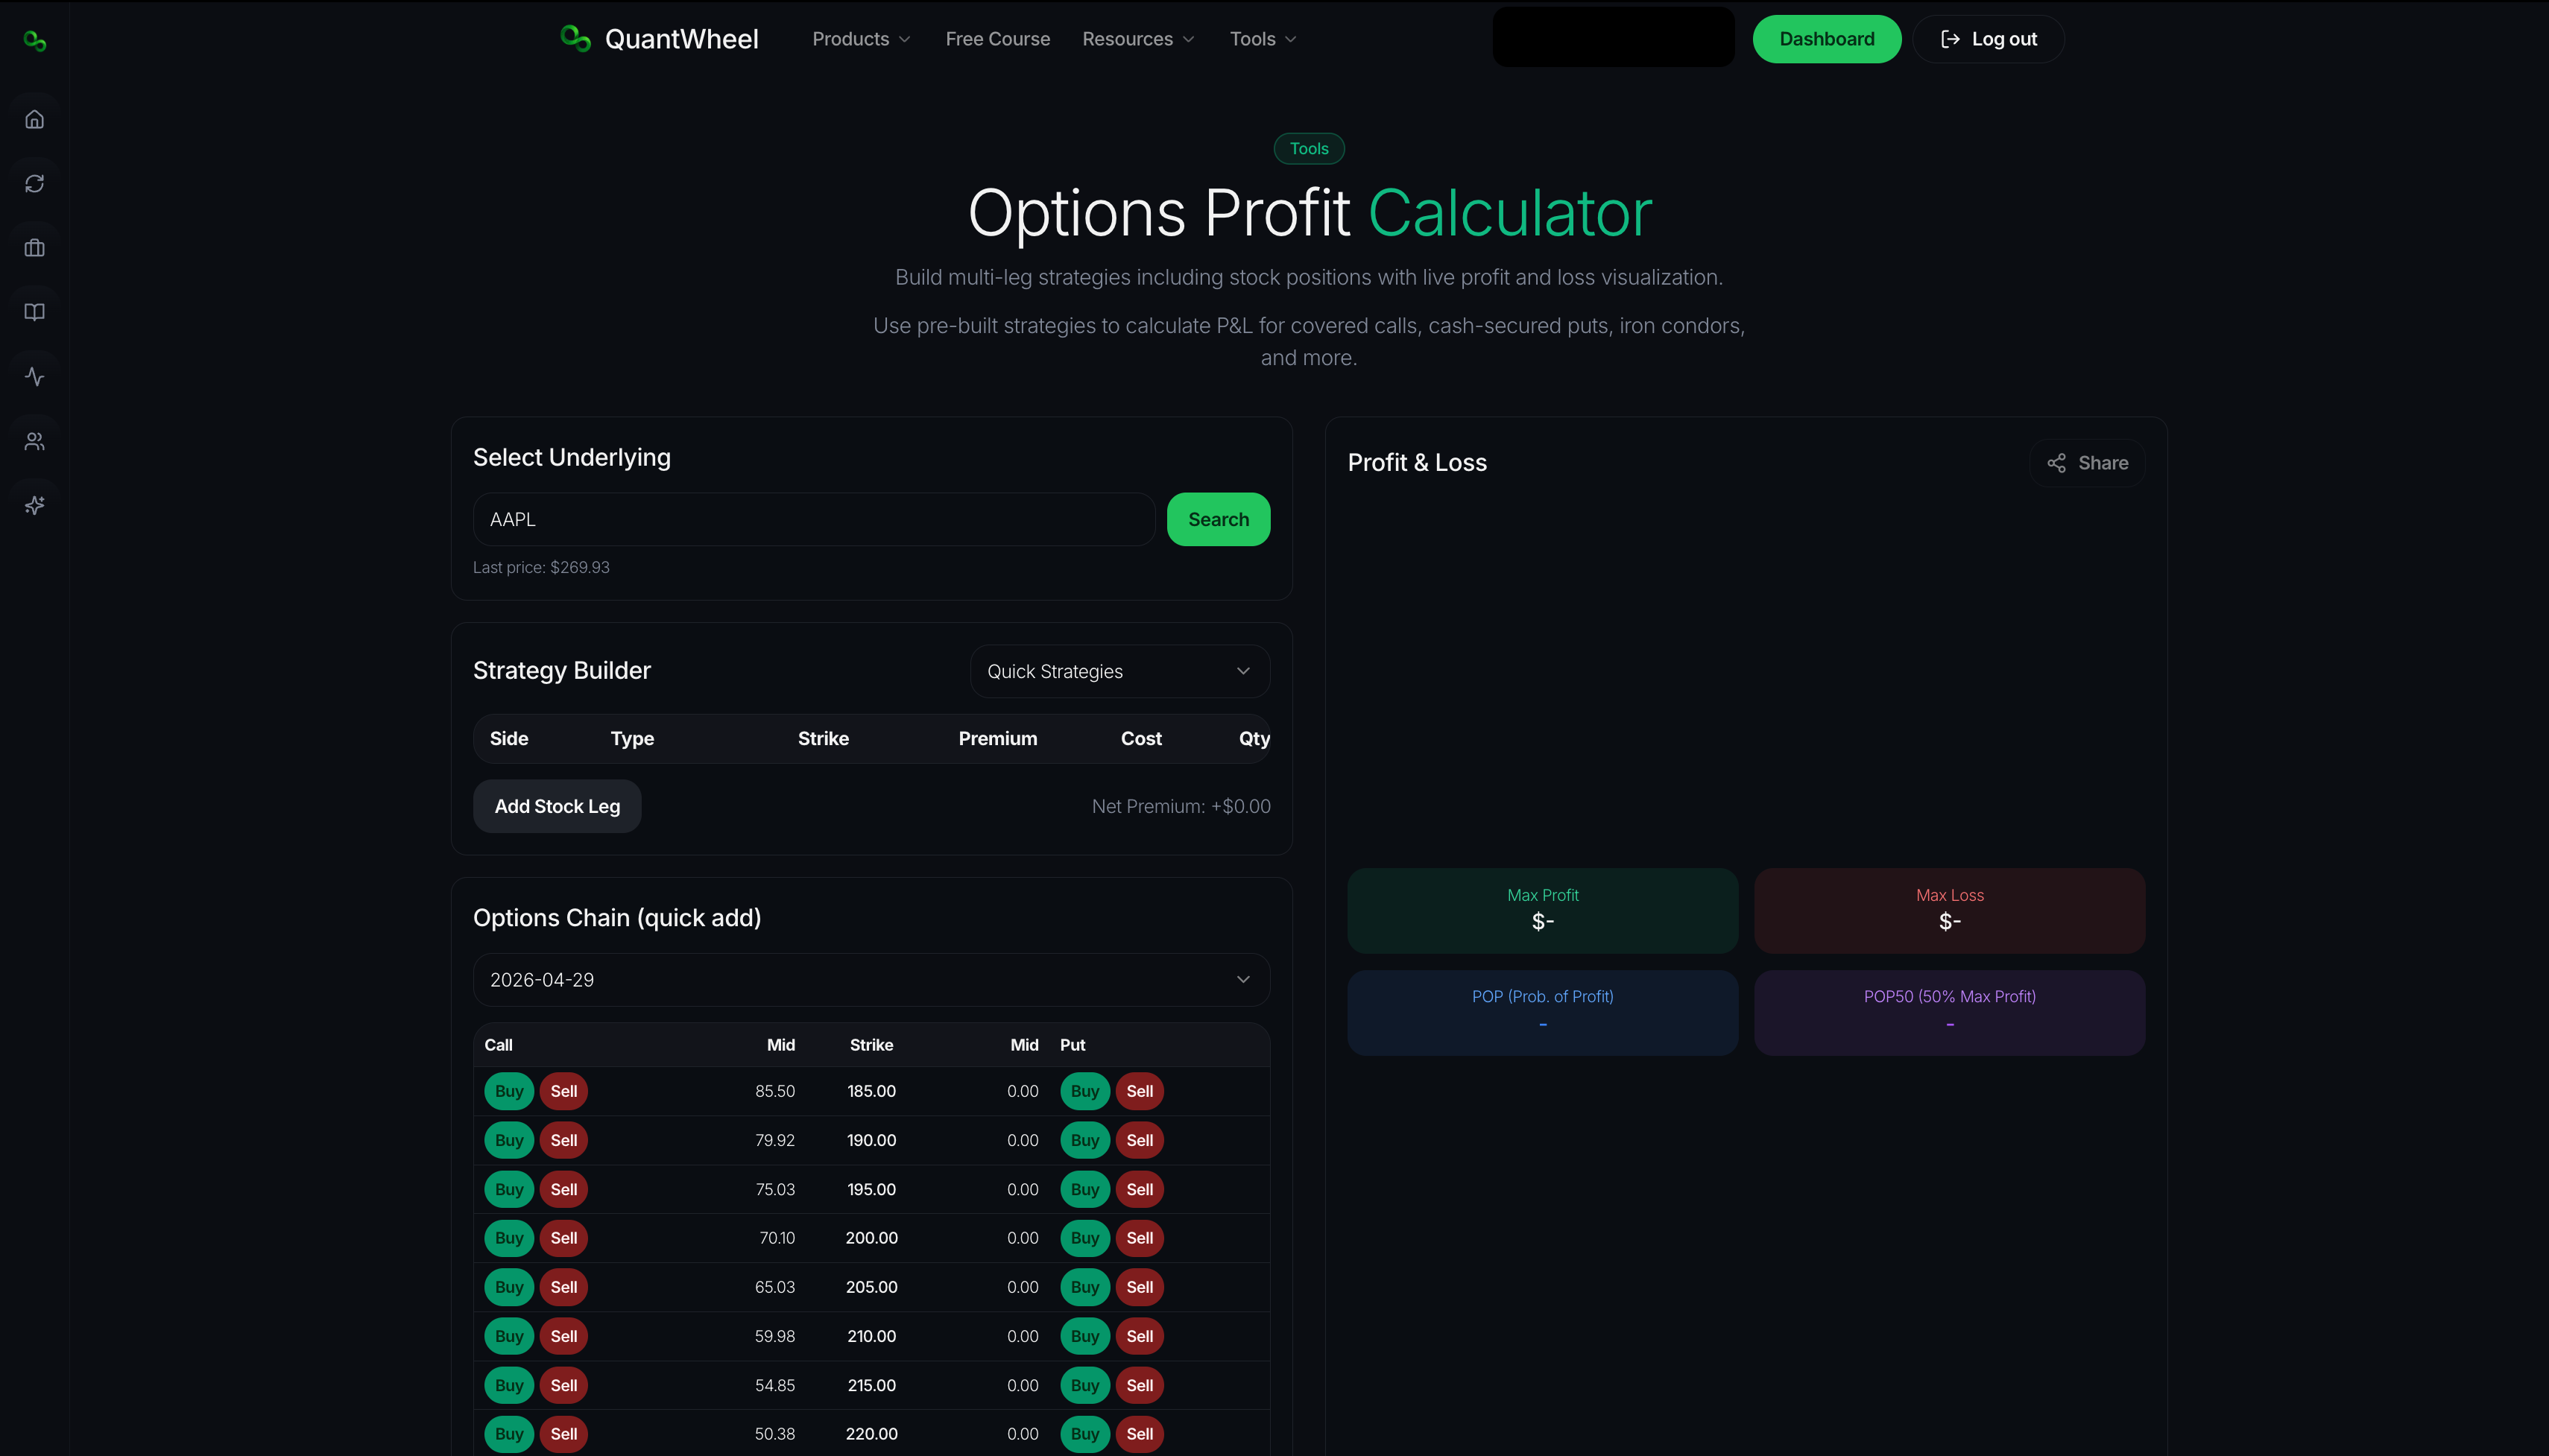
The Free Options Calculator is a general-purpose pricing and analytics tool for individual option contracts. Enter the underlying, strike, expiration, type (call or put).
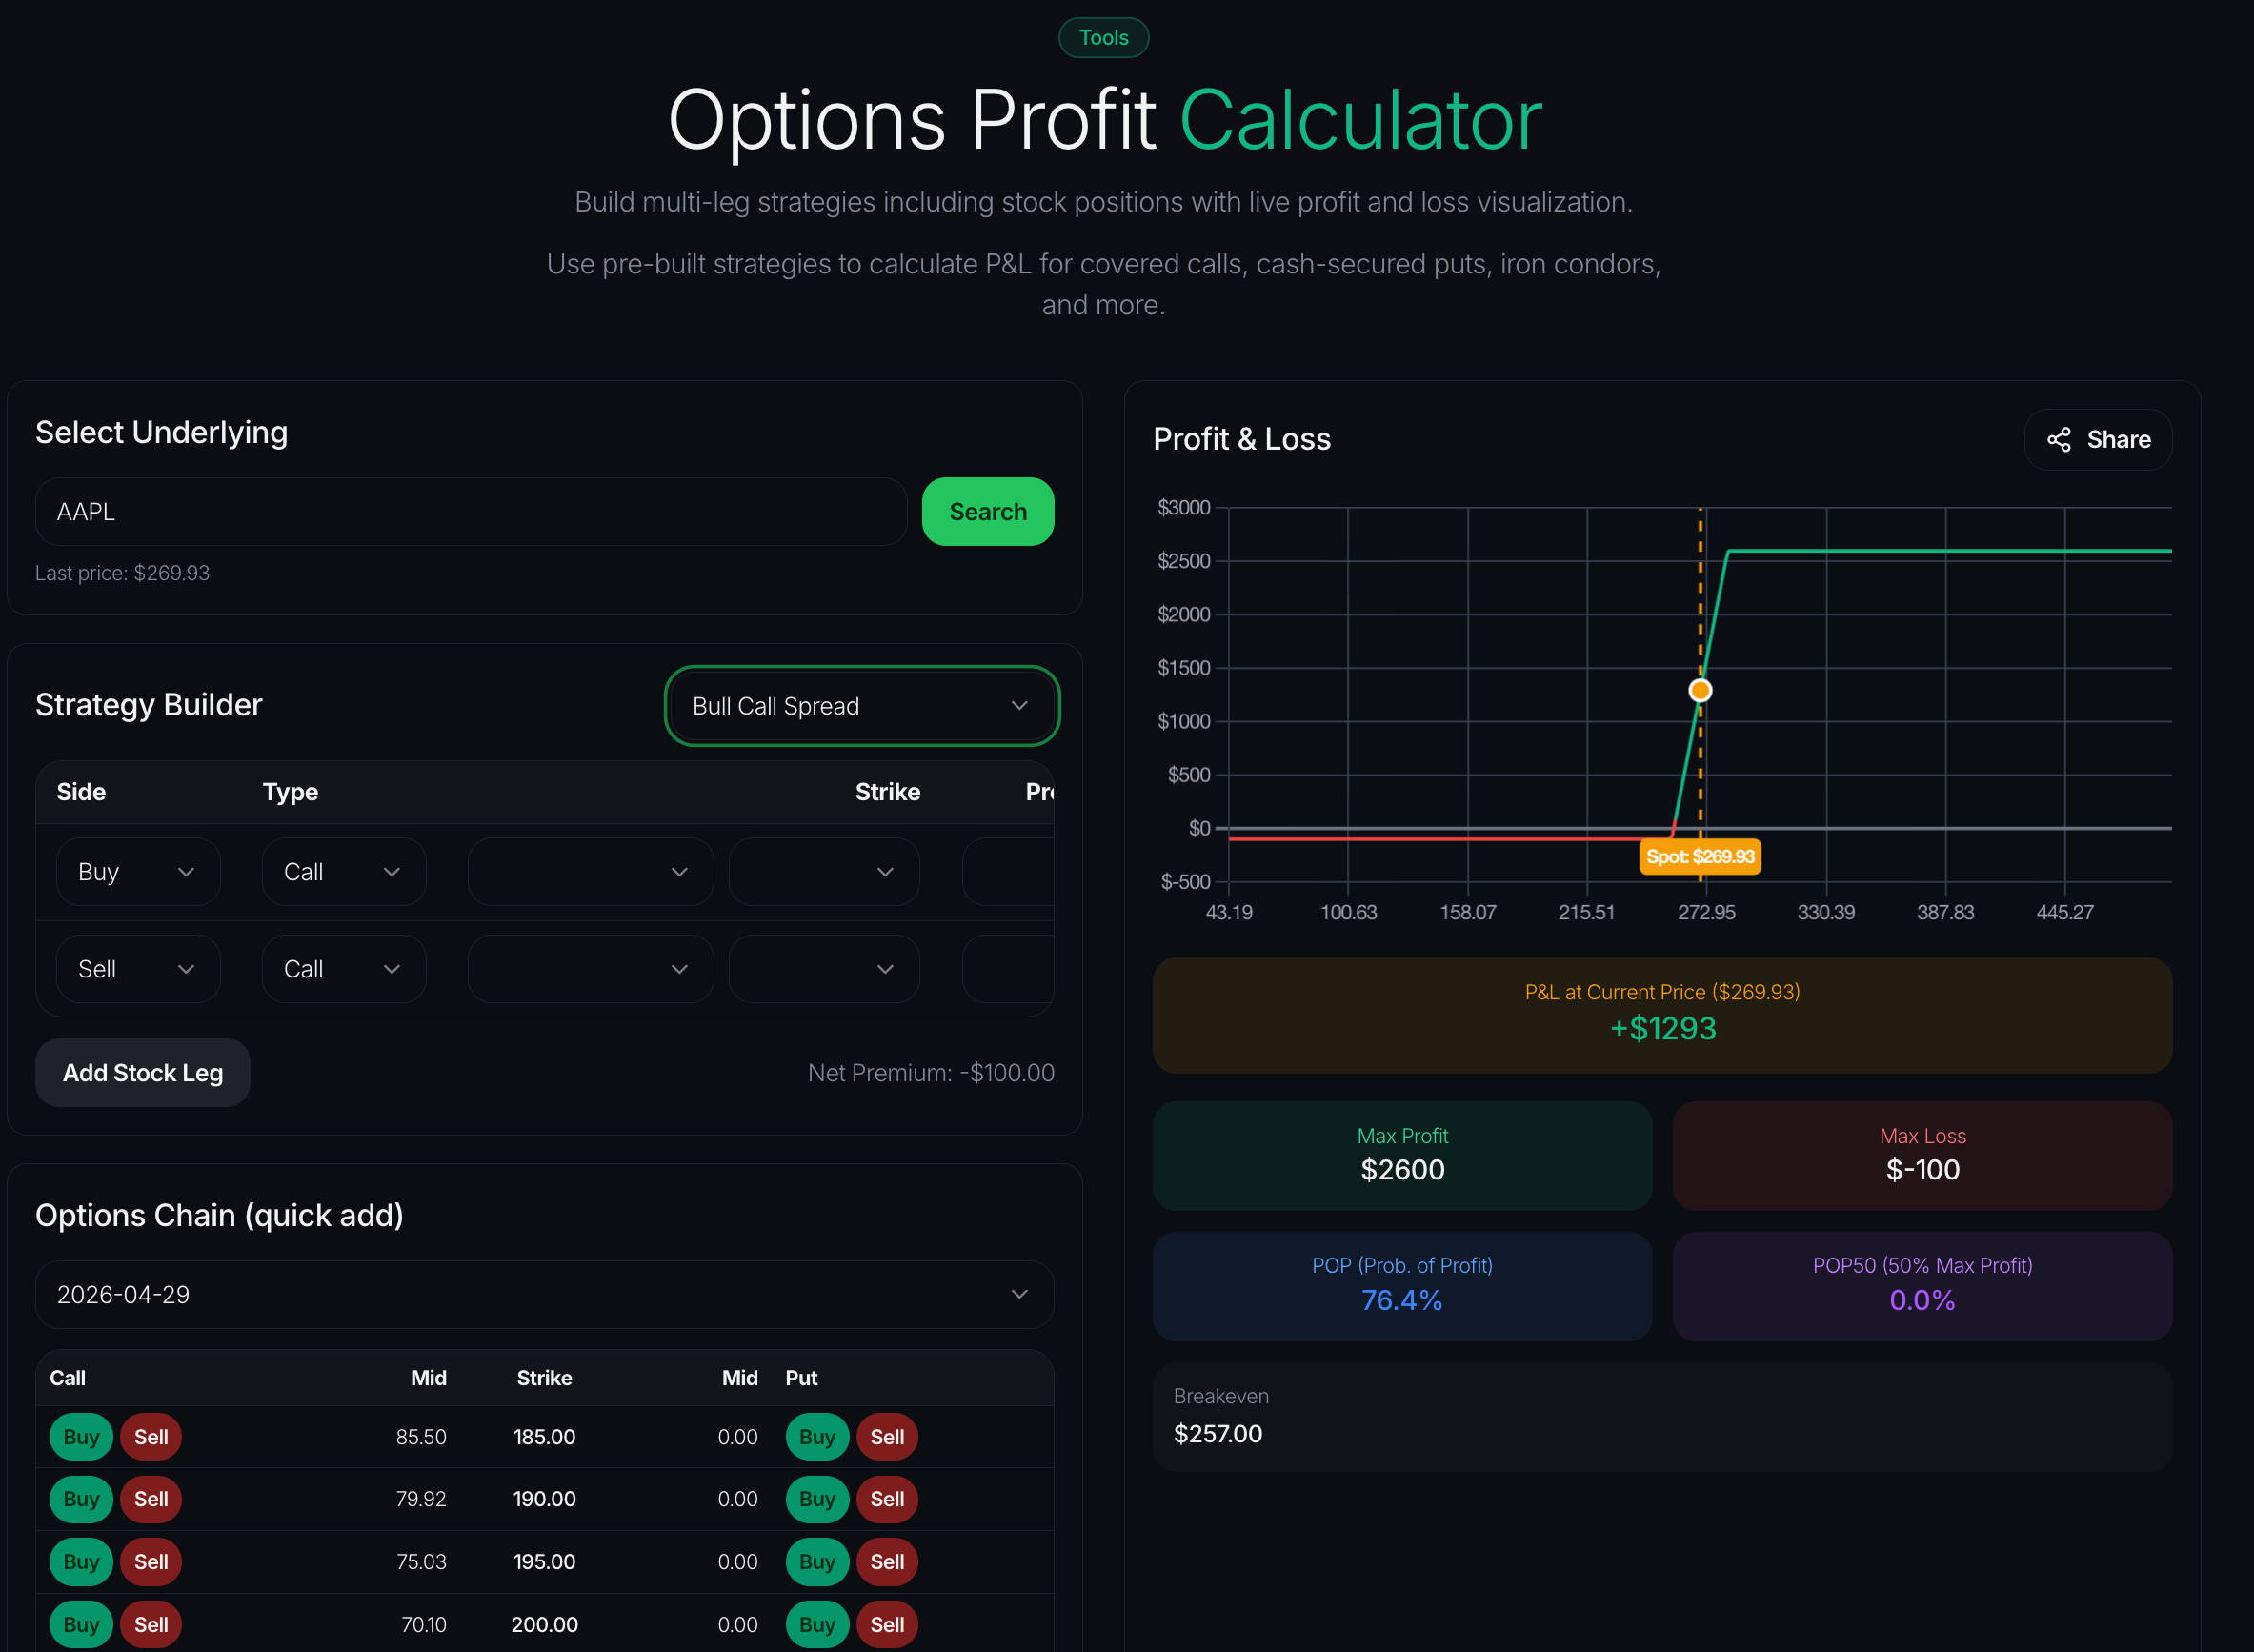
You can also build any strategy - iron condor, strangle, vertical spread, butterfly, covered call, or custom multi-leg structure - and see the combined P&L chart, aggregated Greeks, breakeven prices, maximum profit, and maximum loss in one view.
Free to use. No account required.
What this tool does
Using the standard Black-Scholes model (or similar), the calculator computes:
- Theoretical price - the fair value of the option given the inputs
- Delta - sensitivity to underlying price changes
- Gamma - rate of change of delta
- Theta - time decay per day
- Vega - sensitivity to implied volatility changes
- Rho - sensitivity to interest rate changes
- Probability of profit - likelihood the option finishes in the money at expiration (with configurable IV and drift assumptions)
- P&L chart - profit/loss across a range of underlying prices at expiration
Who it's for
Options traders at any level who want to model positions before placing trades. Useful for:
- Understanding how much theta a position collects per day
- Checking implied volatility's effect on position value (vega)
- Estimating probability of profit for premium-selling strategies
- Learning how option prices change as underlying moves (delta and gamma)
How to use it
- Enter the underlying price - either the current market price, or a hypothetical
- Enter strike price and expiration date
- Select option type - call or put
- Optionally enter quantity and whether you're long or short
- Click Calculate
- Review theoretical price, Greeks, and P&L chart
Reading the output
High positive theta (for short positions) means the position collects premium daily from time decay. Short options have positive theta; long options have negative theta.
Low gamma means the position's delta changes slowly as the underlying moves. Gamma is highest at-the-money and decays toward zero as options move further OTM or ITM.
Vega sensitivity tells you how much position value changes with a 1% change in implied volatility. High-vega positions are vulnerable to IV crushes (post-earnings, for example).
Probability of profit is model-based and depends heavily on the IV input. Use it as directional context, not as a precise forecast.
Things to know about option pricing models
The Black-Scholes model assumes constant volatility, no dividends, and lognormal returns. Real markets violate all three assumptions - so theoretical prices can differ from market prices, sometimes meaningfully.
Implied volatility is what the market is pricing into the option right now. When you enter IV for calculation, you're essentially asking "given this IV, what should the option be worth?" Entering market IV lets you reconcile market price with theoretical; entering a different IV shows you what the option would be worth under that assumption.
Greeks change as inputs change. A position with 0.30 delta today doesn't stay at 0.30 delta - as the underlying moves, time passes, or IV shifts, delta drifts. The calculator shows the Greeks at the moment defined by your inputs.
Limitations of the free version
The Free Options Calculator models one position at a time with manually-entered inputs. For deeper workflows you typically want:
- Live market data auto-filled from real option chains
- Portfolio Greeks - aggregated Greeks across all your current positions
- Scenario analysis - how all positions behave if the market drops 5%, rallies 10%, or IV spikes
- Integration with screeners - jumping from calculated Greeks to available contracts matching those Greeks
These live in QuantWheel's authenticated screener and portfolio views, which combine calculated values with your real holdings.
Related tools
- Free Strategy Explorer - multi-leg strategy visualization
- Free Optimal Roll finder - find the best roll for an existing short position
- Free Earnings Scanner - upcoming earnings with implied vs. historical moves