Author: David Romic – retail options trader and active member in the options trading communities on Reddit (u/thedavidromic).
I share wheel strategy setups, trade management, and lessons learned from real positions.
My main focus is in systematic income strategies with hard rules. Primarily an option seller doing the wheel, covered calls and cash-secured puts.
Let’s get into it.
Last updated: March 2026TLDR: Options Selling Checklist Summary
Before selling any put or call option, verify these 12 critical items:
- Buying Power: Confirm sufficient cash for assignment (strike price × 100 shares)
- Stock Quality: Validate fundamental strength (profitable, liquid, stable business)
- IV Rank: Ensure IV rank above 50 (premium worth the risk)
- Strike Selection: Choose strikes you’re happy to own (puts) or sell (calls) at
- Premium Target: Verify minimum 0.5% return per week or 2% per month
- Position Sizing: Keep individual position under 5% of portfolio
- Portfolio Exposure: Maintain total options exposure under 30%
- Sector Concentration: Limit single sector exposure to 40% maximum
- Expiration Date: Target 30-45 DTE for optimal theta decay
- Assignment Comfort: Genuinely okay owning 100 shares at this strike
- Profit Target: Set alert to close at 50% profit with 21+ DTE
- Stop Loss Rule: Establish exit plan if position down 20%+
Simple Example: You want to sell a $50 put on Stock XYZ for $2 premium.
First check: Do you have $5,000 cash? ($50 × 100 shares).
Is XYZ a quality stock you’d hold?
Is IV rank above 50?
That $200 premium = 4% return on $5,000 capital over 45 days = good.
If assigned, your real cost is $48 per share ($50 strike – $2 premium collected).
Are you comfortable owning XYZ at $48?
If yes to all, the trade passes your checklist.
Why You Need an Options Selling Checklist
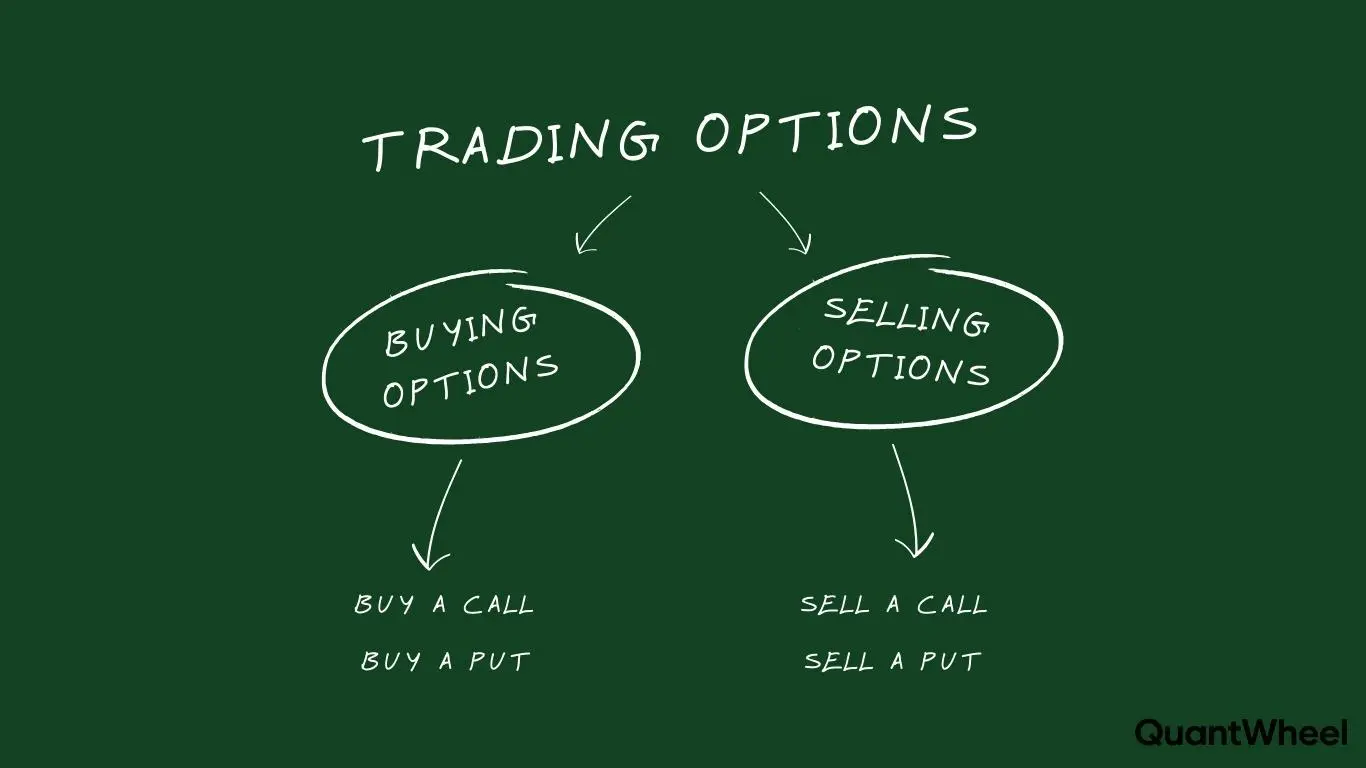
Options selling looks simple. Find a stock. Sell a put. Collect premium. What could go wrong?
Everything.
Without a systematic checklist, you’ll sell puts on stocks you don’t want to own, collect insufficient premium for the risk taken, over-concentrate your portfolio in correlated positions, and miss profit-taking opportunities that turn winners into losers.
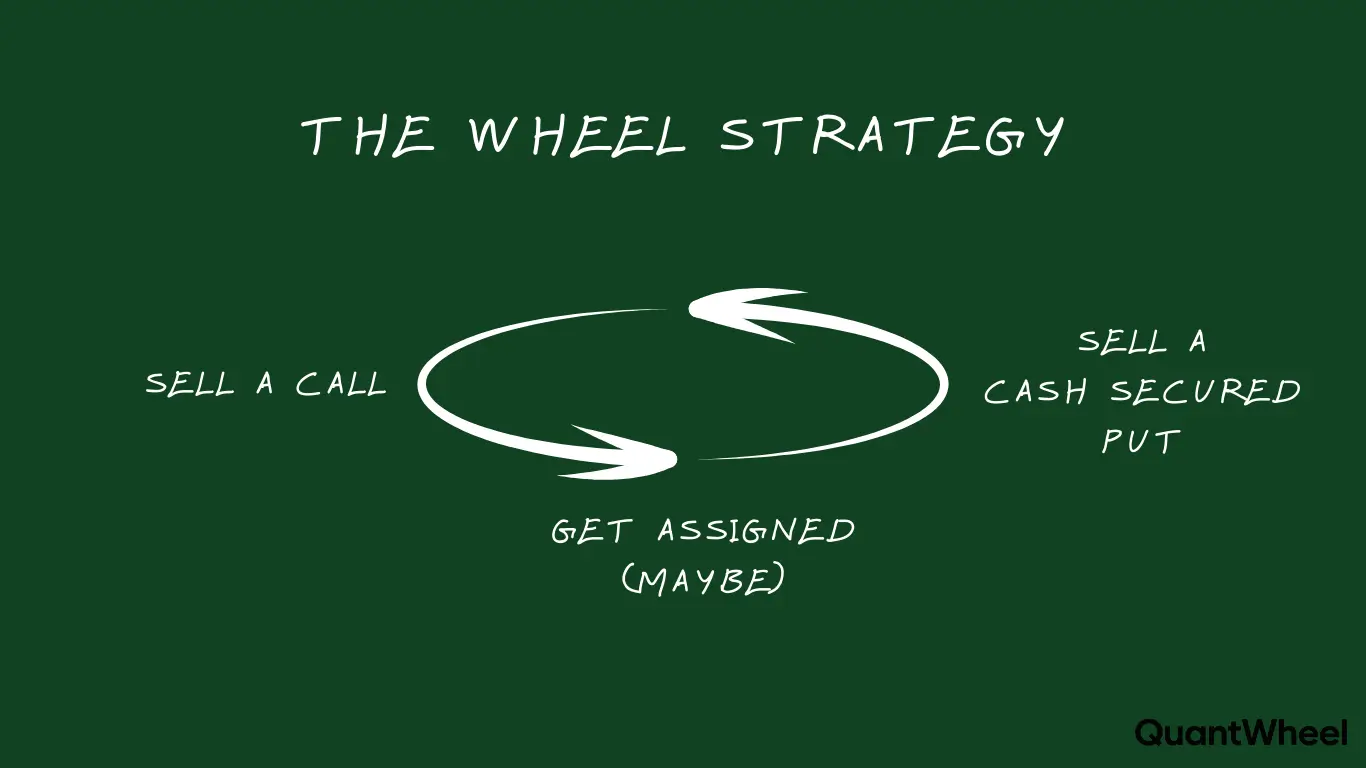
The wheel strategy succeeds through discipline, not luck. Your checklist enforces discipline when emotions tempt shortcuts.
Here’s exactly what to verify before every single options trade.
The Pre-Trade Verification Checklist
Step 1: Confirm Adequate Buying Power
What to Check:
- Cash-secured puts: Strike price × 100 shares in available cash
- Covered calls: Own 100 shares of underlying stock
- Portfolio margin: Understand actual requirement (often less than strike × 100)
Why This Matters: Insufficient buying power causes forced position closures at bad prices or margin calls during market stress. Your broker’s margin calculations change during volatility spikes.
The Check: Before selling a $100 put, confirm $10,000 available cash. Not “settled cash tomorrow” or “margin buying power.” Actual cash ready for assignment today.
Common Mistake: Traders use margin buying power for cash-secured puts, thinking “I have $50K buying power!” But during market drops, that buying power contracts, forcing emergency exits.
Step 2: Validate Stock Quality
What to Check:
- Profitable last 4 quarters (positive earnings)
- Daily trading volume above 1 million shares
- Market cap above $1 billion (liquidity protection)
- Stable business model (not speculative biotech or penny stock)
- You’d genuinely hold this stock for 6-12 months if assigned
Why This Matters: Assignment isn’t theoretical. It happens. Especially during market corrections when you’ve sold puts on garbage stocks chasing high premiums.
The Check: Ask yourself: “If assigned tomorrow, would I be okay holding 100 shares for the next year?” If the answer causes hesitation, don’t sell the option.
Common Mistake: Chasing premium on meme stocks, speculative plays, or companies you wouldn’t touch with regular stock buys. High premium usually signals high risk.
Step 3: Verify IV Rank Above 50
What to Check:
- Current implied volatility rank (IV rank)
- Historical IV range (52-week high/low)
- Premium relative to stock price
Why This Matters: Selling options in low IV environments generates terrible risk-reward. You take full downside risk for minimal premium compensation. High IV means you’re getting paid properly for the risk.
The Check: Only sell options when IV rank exceeds 50. Below 50, premiums don’t justify the capital commitment and risk exposure.
Calculation: IV Rank = (Current IV – 52 Week Low IV) ÷ (52 Week High IV – 52 Week Low IV) × 100
If current IV is 35, 52-week low is 20, and 52-week high is 60: IV Rank = (35 – 20) ÷ (60 – 20) × 100 = 37.5%
This stock fails your checklist. Wait for higher IV.
Step 4: Select Strike Price Strategically
What to Check:
- Cash-secured puts: Strike at price you want to own shares
- Covered calls: Strike at price you’re happy to sell shares
- Delta between 0.15 and 0.35 (conservative wheel strategy)
- Sufficient premium at your chosen strike
Why This Matters: Strike selection determines your breakeven, profit potential, assignment probability, and whether you’re implementing a sustainable strategy or gambling.
The Check: For puts: Choose strikes at technical support levels or valuations where the stock becomes genuinely attractive for long-term holding.
For calls: Select strikes above your cost basis (preferably 5-10% higher) where you’d profit on assignment.
Conservative Approach: Target 0.30 delta puts (roughly 30% probability of finishing in-the-money). This balances premium collection with reasonable assignment avoidance.
Step 5: Verify Premium Meets Minimum Target
What to Check:
- Minimum 0.5% return per week (2% per month)
- Calculate annualized return
- Premium covers expected volatility risk
Why This Matters: Insufficient premium means you’re taking risk without adequate compensation. Your opportunity cost of capital locked in options positions must exceed alternative investments.
The Calculation: Premium collected ÷ Capital at risk × (365 ÷ Days to expiration) = Annualized return
Example: $200 premium on $10,000 capital at risk for 45 days $200 ÷ $10,000 × (365 ÷ 45) = 16.2% annualized
If you can’t achieve 12-15% annualized, wait for better opportunities.
Common Mistake: Selling 7-DTE options for $0.20 per contract, generating 2% annual returns while taking assignment risk. The math doesn’t work.
Step 6: Respect Position Sizing Limits
What to Check:
- Individual position under 5% of total portfolio value
- Calculate exact capital at risk (strike × 100)
- Account for existing positions in same ticker
Why This Matters: Over-concentration in single positions creates portfolio-ending risk. One bad trade shouldn’t materially damage your account.
The Check: $50,000 portfolio = $2,500 maximum per position. That means maximum $25 strike for cash-secured puts (avoiding puts on expensive stocks unless portfolio scales).
Conservative Approach: Start at 2-3% position sizing until you’ve successfully executed 20+ wheel trades. Increase gradually as competence builds.
Step 7: Monitor Total Portfolio Exposure
What to Check:
- Total capital committed to options positions
- Aggregate delta across all positions
- Correlation between holdings
- Available cash for new opportunities
Why This Matters: Filling your entire portfolio with options positions eliminates flexibility during market dislocations. You want dry powder for opportunities when others face margin calls.
The Check: Keep maximum 30% of portfolio in active options positions. Maintain 70% in cash, earning interest, available for assignments or new trades.
Portfolio Management: 10 positions maximum for accounts under $100,000. Above that, scale proportionally but maintain position tracking rigor.
Step 8: Limit Sector Concentration
What to Check:
- Exposure to single market sectors
- Correlation during market stress
- Industry-specific risks
Why This Matters: Sector crashes happen. Technology corrections. Financial crises. Energy collapses. If 80% of your positions correlate, you don’t have 10 positions—you have one leveraged bet.
The Check: Maximum 40% exposure to any single sector. During the trade setup, calculate: “If I add this position, what’s my new sector allocation?”
Sector Diversification: Spread across technology, financials, consumer, healthcare, industrials. Boring beats concentrated when sector rotation happens.
Step 9: Choose Optimal Expiration (30-45 DTE)
What to Check:
- Days to expiration (DTE)
- Theta decay curve optimization
- Your management timeline
Why This Matters: Theta decay accelerates in final 30 days. But selling weekly options chains you to constant management. The sweet spot balances theta capture with management efficiency.
The Check: Target 30-45 DTE at trade entry. This provides optimal theta decay while allowing multiple management opportunities before expiration.
Theta Decay Reality: 45 DTE option might collect 60% of total theta by 21 DTE. Close at 50% profit with 21+ days remaining, redeploy capital into new position. You just completed 2.5 full theta cycles per quarter versus 1 cycle holding to expiration.
Step 10: Confirm Assignment Comfort
What to Check:
- Genuine willingness to own 100 shares
- Capital available if assigned today
- Hold duration tolerance (6-12 months minimum)
- Strategy for managing assigned shares
Why This Matters: Assignment is not failure. In the wheel strategy, assignment is part of the plan. Traders who panic on assignment make emotionally-driven mistakes that destroy returns.
The Check: Visualize your reaction if assigned tomorrow. If it causes stress, anxiety, or financial strain, you’ve selected the wrong strike or wrong stock.
After Assignment: Your real cost basis becomes strike price minus premium collected. A $50 put with $2 premium = $48 cost basis on assignment. Your broker shows $50, but you track $48. This is where manual tracking breaks down and platforms like QuantWheel automatically adjust your cost basis when assignments happen.
Step 11: Set Profit Target (50% Rule)
What to Check:
- Alert set for 50% profit level
- Minimum 21 DTE remaining at target
- Plan for capital redeployment
Why This Matters: Holding options to expiration for the final 20% of profit ties up capital for diminishing returns. Close at 50% profit, redeploy into new position, compound faster.
The Math: Collect $200 premium, close at $100 cost (50% profit) with 24 days remaining. Redeploy $10,000 capital into new 45 DTE trade collecting $200 more.
Result: $300 total profit in 66 days versus $200 profit in 45 days holding to expiration. That’s 33% better capital efficiency.
Automation: Set alerts in your trading platform or use QuantWheel’s automatic alert system to notify when positions hit 50% profit. You’ll forget to check manually.
Step 12: Establish Stop Loss Rule
What to Check:
- Maximum acceptable loss (typically 20% of capital at risk)
- Rolling criteria (down 20%, roll to next expiration)
- Emergency exit plan if fundamentals change
Why This Matters: Options can move against you fast. Predefined exit rules prevent emotional decisions during stress. You decide your maximum pain tolerance before the pain happens.
The Check: If position moves 20% against you, trigger your response: Roll to next expiration for credit, close position and take loss, or (if fundamentals remain strong) accept assignment.
Example: Sold $50 put for $2 premium. Stock drops to $40. Your put now costs $10 to close.
- Capital at risk: $5,000
- Current loss: $800 ($10 current price – $2 collected = $8 loss × 100)
- Loss percentage: 16% of capital at risk
Approaching your 20% stop loss. Time for management decision.
Common Mistake: No predefined stop loss. Positions run to 50%+ losses. Panic selling at bottoms. Emotional trading destroys systematic strategies.
Post-Trade Management Checklist
After opening your position, your checklist doesn’t end.
Daily Checks:
- Monitor for profit target achievement (50% profit)
- Watch for stop loss triggers (down 20%)
- Track upcoming earnings dates
- Review overall portfolio exposure
Weekly Checks:
- Verify position Greeks (delta, theta)
- Assess rolling opportunities
- Review sector concentration
- Identify new opportunities meeting checklist
Monthly Checks:
- Calculate actual returns vs. targets
- Review win rate and profit factor
- Audit checklist compliance
- Adjust rules based on performance data
The Cost of Skipping Your Checklist
Real examples from wheel traders who skipped steps:
Skipped Buying Power Check: Sold $100 puts on $50K portfolio assuming margin would cover. Market dropped 5%, margin requirements increased, forced to close position at $3,000 loss. The position recovered next week.
Skipped Stock Quality Check: Chased 8% premium on speculative biotech. Got assigned at $30. Stock now trades at $12. Two years later, still holding hoping for recovery. $1,800 tied up generating nothing.
Skipped IV Rank Check: Sold options in low IV environment (IV rank 25). Collected $50 premium on $5,000 capital at risk. Position moved against him $800 before expiration. Risk-reward made no sense.
Skipped Position Sizing: Put 30% of portfolio in single position (NVDA put). Stock dropped 15% post-earnings. Now down $4,500 on $50,000 portfolio—completely changing risk tolerance and forcing emotional decisions.
Skipped Profit Target: Hit 50% profit at 25 DTE. Held for “maximum profit.” Stock rallied, position went from $100 profit to $50 loss. Final result: Turned winner into loser by ignoring exit rule.
Every skipped checklist item represents preventable loss. Your systematic approach beats market randomness over 100+ trades.
Automating Your Checklist with Technology
After executing 500+ wheel strategy trades, here’s the honest truth: Manual checklist management works until it doesn’t.
Your spreadsheet tracks 3 positions easily. At 10 positions, you’re spending 90 minutes per week updating cells, calculating cost basis adjustments after assignments, and setting calendar reminders for profit targets.
At 15+ positions, manual tracking breaks completely.
This is exactly the problem QuantWheel solves for serious wheel traders. It automates the tedious parts of your checklist:
- Position Tracking: Automatic sync from broker, real-time P&L across all positions
- Cost Basis Adjustment: Automatically updates your real cost basis when assigned (strike minus premium)
- Profit Target Alerts: Notifies you exactly when positions hit 50% profit
- Portfolio Analytics: Shows sector concentration, total exposure, position sizing at a glance
- Risk Management: Calculates aggregate delta, theta, and portfolio Greeks
- Rolling Analysis: Suggests optimal roll opportunities with calculated returns
The mechanical parts of your checklist get automated. Your brain focuses on the strategic decisions: Which stocks? What strikes? When to enter?
QuantWheel automatically calculates portfolio Greeks and correlation across all your positions.
Your Options Selling Checklist in Practice
Let’s walk through a complete example using the 12-step checklist.
Scenario: You want to sell a cash-secured put on AMD (Advanced Micro Devices).
Step 1 – Buying Power: AMD trading at $140. You’d sell $130 put. Need $13,000 cash available. ✓ Confirmed.
Step 2 – Stock Quality: AMD is profitable, $200B+ market cap, 100M+ daily volume, leading semiconductor company. Would own for 12+ months. ✓ Passes.
Step 3 – IV Rank: Current IV rank: 58. Above 50 threshold. ✓ Good premium environment.
Step 4 – Strike Selection: $130 put = 0.28 delta. Stock has support at $125. $130 strike represents 7% discount from current price. Comfortable owning at $130. ✓ Strategic strike.
Step 5 – Premium Target: $130 put 45 DTE pays $4.20 premium ($420 collected). $420 ÷ $13,000 × (365 ÷ 45) = 26.2% annualized return. ✓ Exceeds 15% minimum.
Step 6 – Position Sizing: Portfolio value: $100,000. This position: $13,000 = 13% of portfolio. ⚠️ Too large. Reduce to $65,000 max (5 contracts maximum on AMD).
Adjusted: Sell 2 contracts instead of 10. Position now 2.6% of portfolio. ✓ Acceptable.
Step 7 – Portfolio Exposure: Current active positions: $18,000 committed. Adding $13,000 = $31,000 total = 31% of portfolio. ⚠️ Slightly over 30% target.
Decision: Proceed but no additional positions until one closes.
Step 8 – Sector Concentration: Current tech exposure: $12,000 (NVDA position). Adding AMD = $25,000 tech = 25% of portfolio. ✓ Under 40% sector limit.
Step 9 – Expiration: 45 DTE option selected. ✓ Optimal theta decay window.
Step 10 – Assignment Comfort: If assigned: Cost basis = $130 – $4.20 = $125.80 per share. AMD at $125.80 is strong long-term hold. ✓ Comfortable.
Step 11 – Profit Target: Set alert: Close when option price drops to $2.10 (50% of $4.20 premium). ✓ Alert configured.
Step 12 – Stop Loss: If position moves to $8.40 cost to close (down 20% of capital at risk), evaluate roll or exit. ✓ Rule documented.
Final Decision: Execute trade. Sell 2 contracts AMD $130 put 45 DTE at $4.20 credit.
All checklist items satisfied. Position aligns with systematic wheel strategy approach.
Common Checklist Mistakes and Fixes
Mistake 1: Emotional Override
Problem: Checklist says “no” but you convince yourself “this time is different.”
Fix: If checklist fails, the trade doesn’t happen. Period. No exceptions. Build the checklist you’ll actually follow, not an idealized version you’ll ignore.
Mistake 2: Partial Checklist
Problem: Checking only 5 of 12 items because you’re in a hurry.
Fix: Use automation to speed checklist completion. QuantWheel auto-populates position sizing, portfolio exposure, and risk metrics. Your job: Verify stock quality and strike selection.
Mistake 3: No Documentation
Problem: Mental checklist with no accountability or tracking.
Fix: Document every trade decision. Screenshot your checklist completion. Review quarterly what worked versus what caused losses.
Mistake 4: Static Checklist
Problem: Never updating rules based on performance data.
Fix: Review checklist monthly. If 20% stop loss triggered too frequently, adjust to 25%. If 30 DTE doesn’t work for your schedule, shift to 45 DTE. Evolve systematically.
Mistake 5: Over-Complication
Problem: 50-item checklist you’ll never complete consistently.
Fix: Start with core 12 items. After 50 successful trades, add complexity if needed. Simplicity wins over perfection.
When to Break Your Checklist Rules
Sometimes breaking your checklist is correct. But have explicit criteria.
Acceptable Breaks:
Portfolio Rebalancing: Exceeding sector concentration to close a position is acceptable. You’re reducing risk, not adding it.
Opportunistic Assignment: Stock flash crashes 10% on no news. Your $100 put is now deep ITM. Taking assignment at effective $95 cost basis (strike minus premium) is strategic, even if it violates maximum position count.
Market Dislocation: March 2020-style crash. IV rank explodes to 95 across quality stocks. Selling more than your usual 30% portfolio exposure makes sense when compensation for risk increases 3-4x normal levels.
Unacceptable Breaks:
FOMO Trading: “Everyone’s making money on meme stocks, I should sell puts even though they fail my checklist.” This is gambling, not systematic trading.
Revenge Trading: Lost money on last trade, now doubling position size to “make it back.” This violates position sizing rules and leads to ruin.
Boredom Trading: No good setups meeting checklist criteria, so lowering standards to “stay active.” Activity without opportunity destroys capital.
The difference: Strategic breaks improve risk-adjusted returns. Emotional breaks destroy systematic approaches.
Building Your Personal Options Checklist
Your checklist should reflect your risk tolerance, time availability, and capital level.
Aggressive Checklist Modifications:
- Increase position sizing to 10% maximum (not 5%)
- Accept 40% total portfolio exposure (not 30%)
- Target 0.40+ delta strikes (higher premium, higher probability)
- Accept IV rank above 40 (not 50)
Conservative Checklist Modifications:
- Decrease position sizing to 2-3% maximum
- Maintain 20% total portfolio exposure cap
- Target 0.15-0.20 delta strikes (lower assignment risk)
- Require IV rank above 60 (exceptional premium only)
Time-Constrained Checklist:
- Extend to 60 DTE (less frequent management)
- Set automatic profit targets (close at 60% instead of 50%)
- Limit to 5 total positions maximum (easy monitoring)
- Use weekly review instead of daily checks
Active Trader Checklist:
- Shorten to 21-30 DTE (faster capital rotation)
- Close at 40% profit (more frequent redeployment)
- Manage up to 15-20 positions (requires automation)
- Daily portfolio reviews
Your checklist evolves with experience. Start conservative. Adjust based on 100+ trades of data.
The Psychology of Checklist Discipline
Why do experienced traders skip their checklists?
Overconfidence: “I’ve done this 100 times, I don’t need to verify.” Then you accidentally sell puts with insufficient buying power because you forgot about pending withdrawal.
Impatience: “This opportunity will disappear if I don’t act NOW.” Markets always provide opportunities. Missing one trade prevents zero losses. Skipping checklist verification can cause catastrophic loss.
Recency Bias: “Last 10 trades worked without full checklist.” You’re measuring luck, not process. The checklist prevents the 11th trade from being the portfolio-ender.
Social Pressure: “Everyone’s selling puts on [trendy ticker].” Your checklist exists specifically to protect against herd mentality creating concentrated risk.
Discipline beats intelligence in options trading. The smartest trader who trades emotionally loses to the average trader who follows systematic checklists.
Checklist Compliance Tracking
How do you ensure you actually follow your checklist?
Pre-Trade Journal: Document checklist completion before every trade. Screenshot the verification. Include date, ticker, reasoning.
Monthly Audit: Review last 20 trades. Calculate checklist compliance rate. If under 95%, you need better automation or simpler rules.
Performance Attribution: Separate winning trades into “checklist compliant” versus “checklist violation.” Calculate returns for each category. You’ll discover your best returns come from full checklist compliance.
Accountability Partner: Share trade plans with trading partner or community before execution. External accountability increases checklist compliance.
Technology Enforcement: Use QuantWheel’s automated position tracking to enforce position sizing, portfolio exposure, and sector concentration limits. Software doesn’t feel FOMO or impatience.
Advanced Checklist: Portfolio-Level Considerations
Once you’re managing 10+ positions consistently, add portfolio-level checklist items.
Portfolio Greeks Check:
- Total portfolio delta (target: -5 to +5 for market-neutral)
- Total portfolio theta (measures daily decay collection)
- Portfolio vega exposure (sensitivity to IV changes)
Correlation Analysis:
- Calculate correlation between holdings
- Identify hidden sector concentrations
- Stress test portfolio during simulated corrections
Capital Efficiency:
- Average annualized return across all positions
- Capital utilization rate (deployed vs. idle cash)
- Return per unit of risk (Sharpe ratio for options portfolio)
Management Bandwidth:
- Can you actively monitor this many positions?
- Do you have time for thoughtful roll decisions?
- Is complexity creating errors?
These advanced metrics separate amateur wheel traders from professionals. QuantWheel calculates portfolio Greeks and correlation automatically.
Start your free trial of QuantWheel →
Risk Disclosure
Options trading involves substantial risk and is not suitable for all investors. Past performance does not guarantee future results. This content is for educational purposes only and should not be considered investment advice. Always do your own research and consider consulting with a financial advisor before making investment decisions.
The examples used in this article are for educational purposes only and are not recommendations to buy or sell any security. All investment decisions should be based on your own analysis and risk tolerance.