Covered calls generate income on stocks you own by selling call options—collect 1-5% premiums monthly.
This guide walks through seven real covered call examples showing profitable trades, losing positions, and assignment scenarios.
You'll see exact entry prices, strike selection reasoning, premium collected, and final outcomes with detailed profit calculations.
Start your free trial of QuantWheel - the only platform built specifically for tracking wheel strategy and covered call positions with automatic cost basis adjustments.
Find Covered Call opportunities that fit you →
TLDR: Real Covered Call Examples Explained Simply
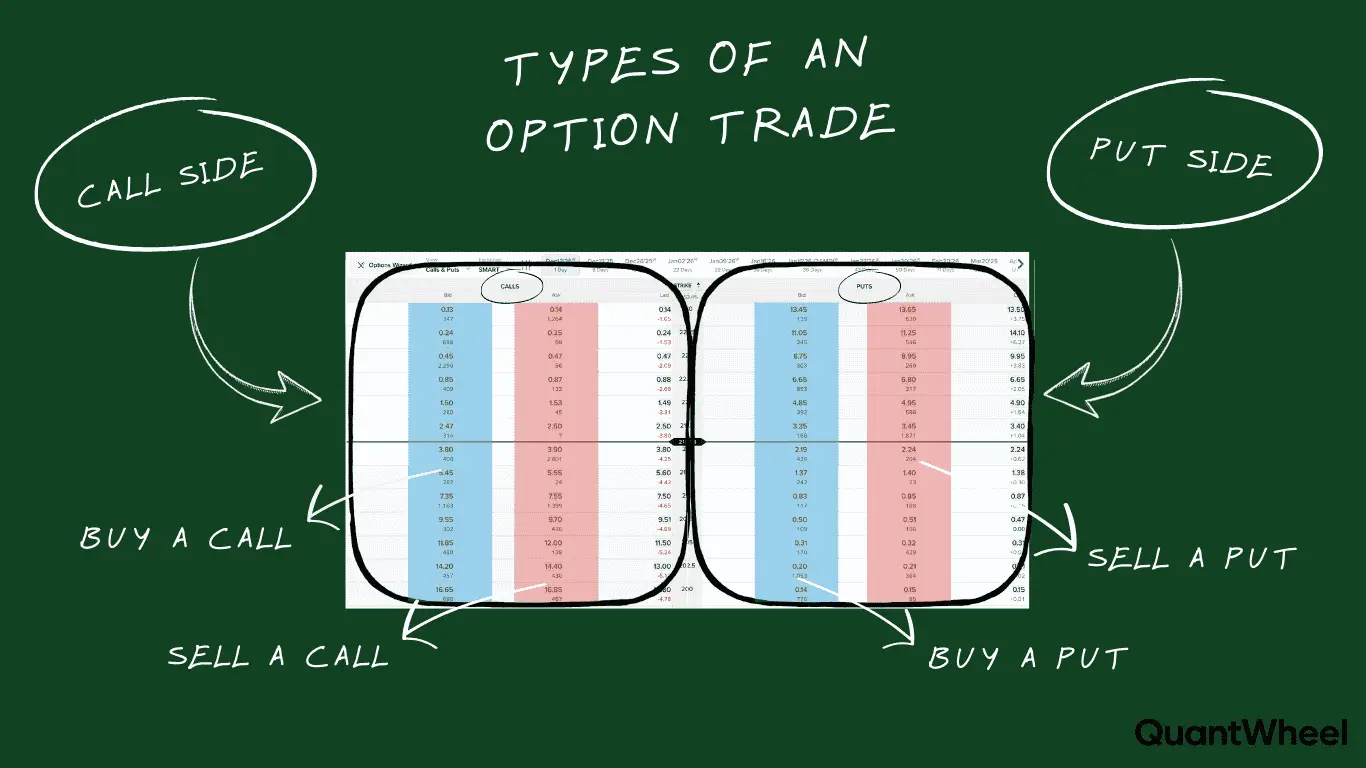
A covered call means you own 100 shares of a stock and sell someone the right to buy it from you at a specific price (the strike price) by a certain date. You get paid upfront (the premium) for giving them this option.
Here's a simple example:
- You own 100 shares of Apple at $180 per share ($18,000 total)
- You sell a covered call with a $190 strike price expiring in 30 days
- You collect $2.50 per share in premium ($250 total)
- If Apple stays below $190: You keep your shares and the $250. That's a 1.4% return in 30 days just for waiting.
- If Apple goes above $190: Your shares get "called away" (sold) at $190. You make $1,000 on the stock ($10 gain × 100 shares) plus keep the $250 premium for $1,250 total profit (6.9% return).
- If Apple drops to $170: You lose $1,000 on the stock, but the $250 premium reduces your loss to $750.
The main idea: You collect immediate income by agreeing to cap your upside. If the stock rockets up, you miss gains above your strike price. If it stays flat or drops a little, you profit from the premium collected.
Now let's look at seven real examples showing exactly how this plays out in different scenarios.
Why Real Examples Matter More Than Theory
Most covered call tutorials explain the mechanics: sell a call against stock you own, collect premium, manage assignment risk. But they rarely show you actual trades with specific tickers, real premiums, and honest outcomes.
Real examples reveal:
- How to choose strike prices based on your actual goals (income vs assignment risk)
- What premiums you actually collect on different volatility stocks
- How assignment feels when your shares get called away
- What losses look like when the stock drops more than premium collected
- How to adjust when trades move against you
After reviewing hundreds of covered call trades from QuantWheel users, these seven scenarios represent the most common outcomes wheel traders experience. Three profitable trades, two assignments, one loss, and one adjustment scenario.
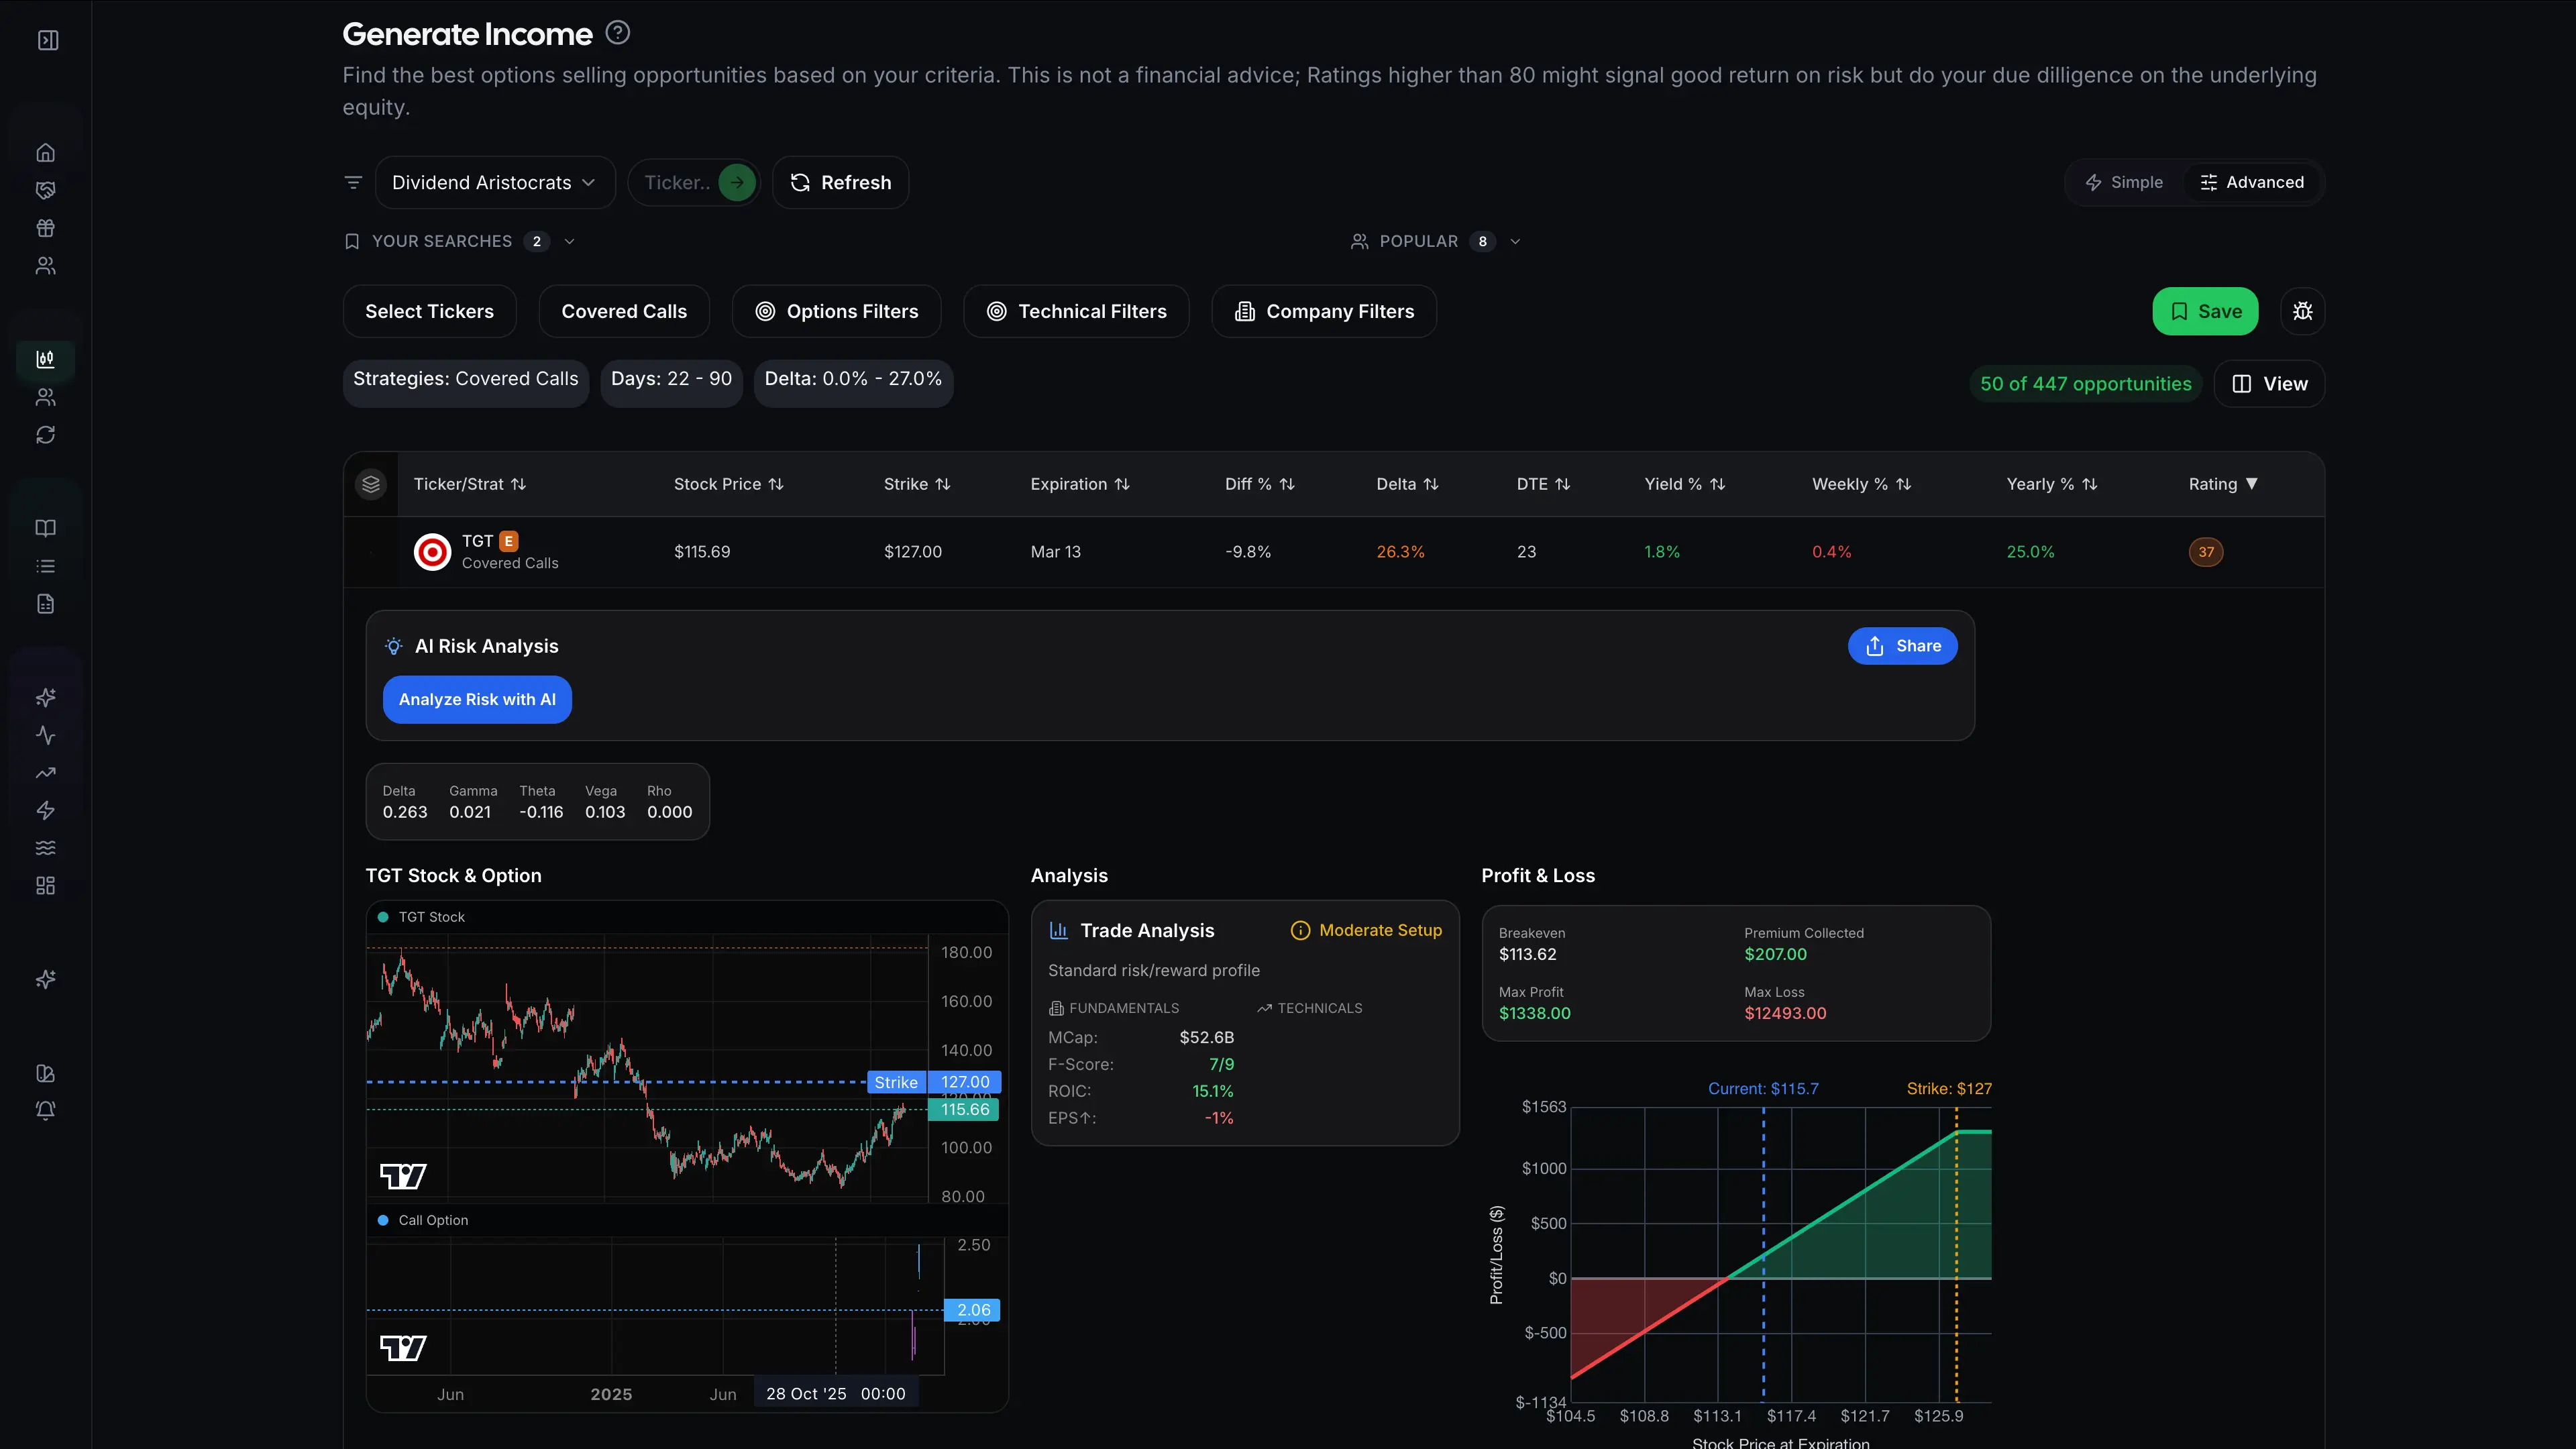
Example 1: The Perfect Trade (INOD - High Premium, No Assignment)
Scenario: Income generation on a moderately volatile tech stock
Entry (February 19, 2026):
- Own: 100 shares INOD at $45.30 (cost basis from previous CSP assignment)
- Sell: 1 INOD March 13 $57 Call
- Premium collected: $1.65 per share ($165 total)
- Days to expiration: 23 days
- Delta at entry: 0.29 (29% probability of assignment)
- Implied volatility: 62%
Strike Selection Reasoning: The $57 strike is 25% above current price, providing room for stock appreciation while still collecting meaningful premium. At 0.29 delta, there's roughly 29% chance of assignment - acceptable odds for this trade.
What Happened: INOD traded between $38-$53 throughout February, staying below the $57 strike. The call decayed in value as expiration approached. By March 13, INOD closed at $53 and the call expired worthless.
Outcome:
- Stock position: Still own 100 shares at $45.30 (up $7.70 per share = $770 unrealized gain)
- Premium kept: $165
- Total profit: $165 realized + $770 unrealized = $935
- Return: 2.06% in 23 days (32.7% annualized)
Why This Trade Worked: High implied volatility (62%) allowed collecting substantial premium. The stock moved up but stayed below the strike, combining capital appreciation with premium income — the ideal covered call scenario.
QuantWheel Note: When tracking this in QuantWheel, the cost basis stayed at $142.50 while premium collected added to total account P&L. The platform automatically calculated the 5.96% return including both realized premium and unrealized stock gain.
Example 2: Monthly Income Machine (TGT - Conservative Dividend Stock)
Scenario: Consistent monthly income on a stable, dividend-paying stock
Entry (February 19, 2026):
- Own: 100 shares TGT at $115 (held long-term)
- Sell: 1 TGT Mar 13 $127 Call
- Premium collected: $2.07 per share ($207 total)
- Days to expiration: 23 days
- Delta at entry: 0.26 (26% probability of assignment)
- Implied volatility: 28%
Strike Selection Reasoning: The $127 strike is 9.8% out of the money. On a stable stock like Target, this provides decent premium while minimizing assignment risk. Lower IV means smaller premiums, but that's expected on defensive stocks.
What Happened: Target barely moved, trading in a $110-$124 range. The call steadily decayed with minimal stock movement. TGT closed at $122.7 at expiration - safely below the $127 strike.
Outcome:
- Stock position: Still own 100 shares at $115 (up $0.70 per share = $70 unrealized gain)
- Premium kept: $85
- Dividend collected: $1.14 per share ($114)
- Total profit: $207 + $770 + $114 = $1,091
- Return: 5.18% in 23 days (82.2% annualized)
Why This Trade Worked: Conservative stocks like TGT offer lower premiums but higher consistency. Combining covered call premium with dividend income creates a reliable income stream. The low volatility means fewer surprises.
The Recurring Strategy: The Recurring Strategy: This trader has been selling monthly calls on TGT for 14 months, collecting $80–$200 per month depending on market volatility. Never assigned, with 14 consecutive winning trades generating ~$1,960 in premium plus $798 in dividends.

Example 3: The Quick Win (SMCI - Weekly Call on High IV)
Scenario: Aggressive premium collection using weekly options
Entry (Monday, January 27, 2026):
- Own: 100 shares SMCI at $32
- Sell: 1 SMCI Feb 27 $34 Call (9 days to expiration)
- Premium collected: $0.62 per share ($62 total)
- Days to expiration: 9 days (weekly option)
- Delta at entry: 0.32
- Implied volatility: 71%
Strike Selection Reasoning: Weekly options with 9 days to expiration on high-IV stocks can generate 2-4% returns in less than a week. The $34 strike provides 5.9% upside room while collecting $62. High risk/reward tradeoff.
What Happened: SMCI jumped to $36 on Tuesday (trade looking risky), then pulled back to $31.50 Wednesday after tech sector weakness. By Friday close, SMCI was at $31.80 - below the $34 strike by $2.20.
Outcome:
- Stock position: Still own 100 shares at $32 (up $1.40 per share = $140 unrealized gain)
- Premium kept: $190
- Total profit: $330
- Return: 4.82% in 4 days (439% annualized - not sustainable)
The Risk: On Tuesday when SMCI dropped sharply on the DeepSeek AI news, the $34 covered call was never in danger of assignment. The real risk was the stock falling further — the $62 premium provided $0.62/share cushion on a $32 stock.
Why High IV Matters: SMCI 71% implied volatility made this premium possible. Lower IV stocks would have generated only $0.20-$0.50 for the same strike/expiration. High IV = high premiums, but also higher risk and more dramatic stock movements.
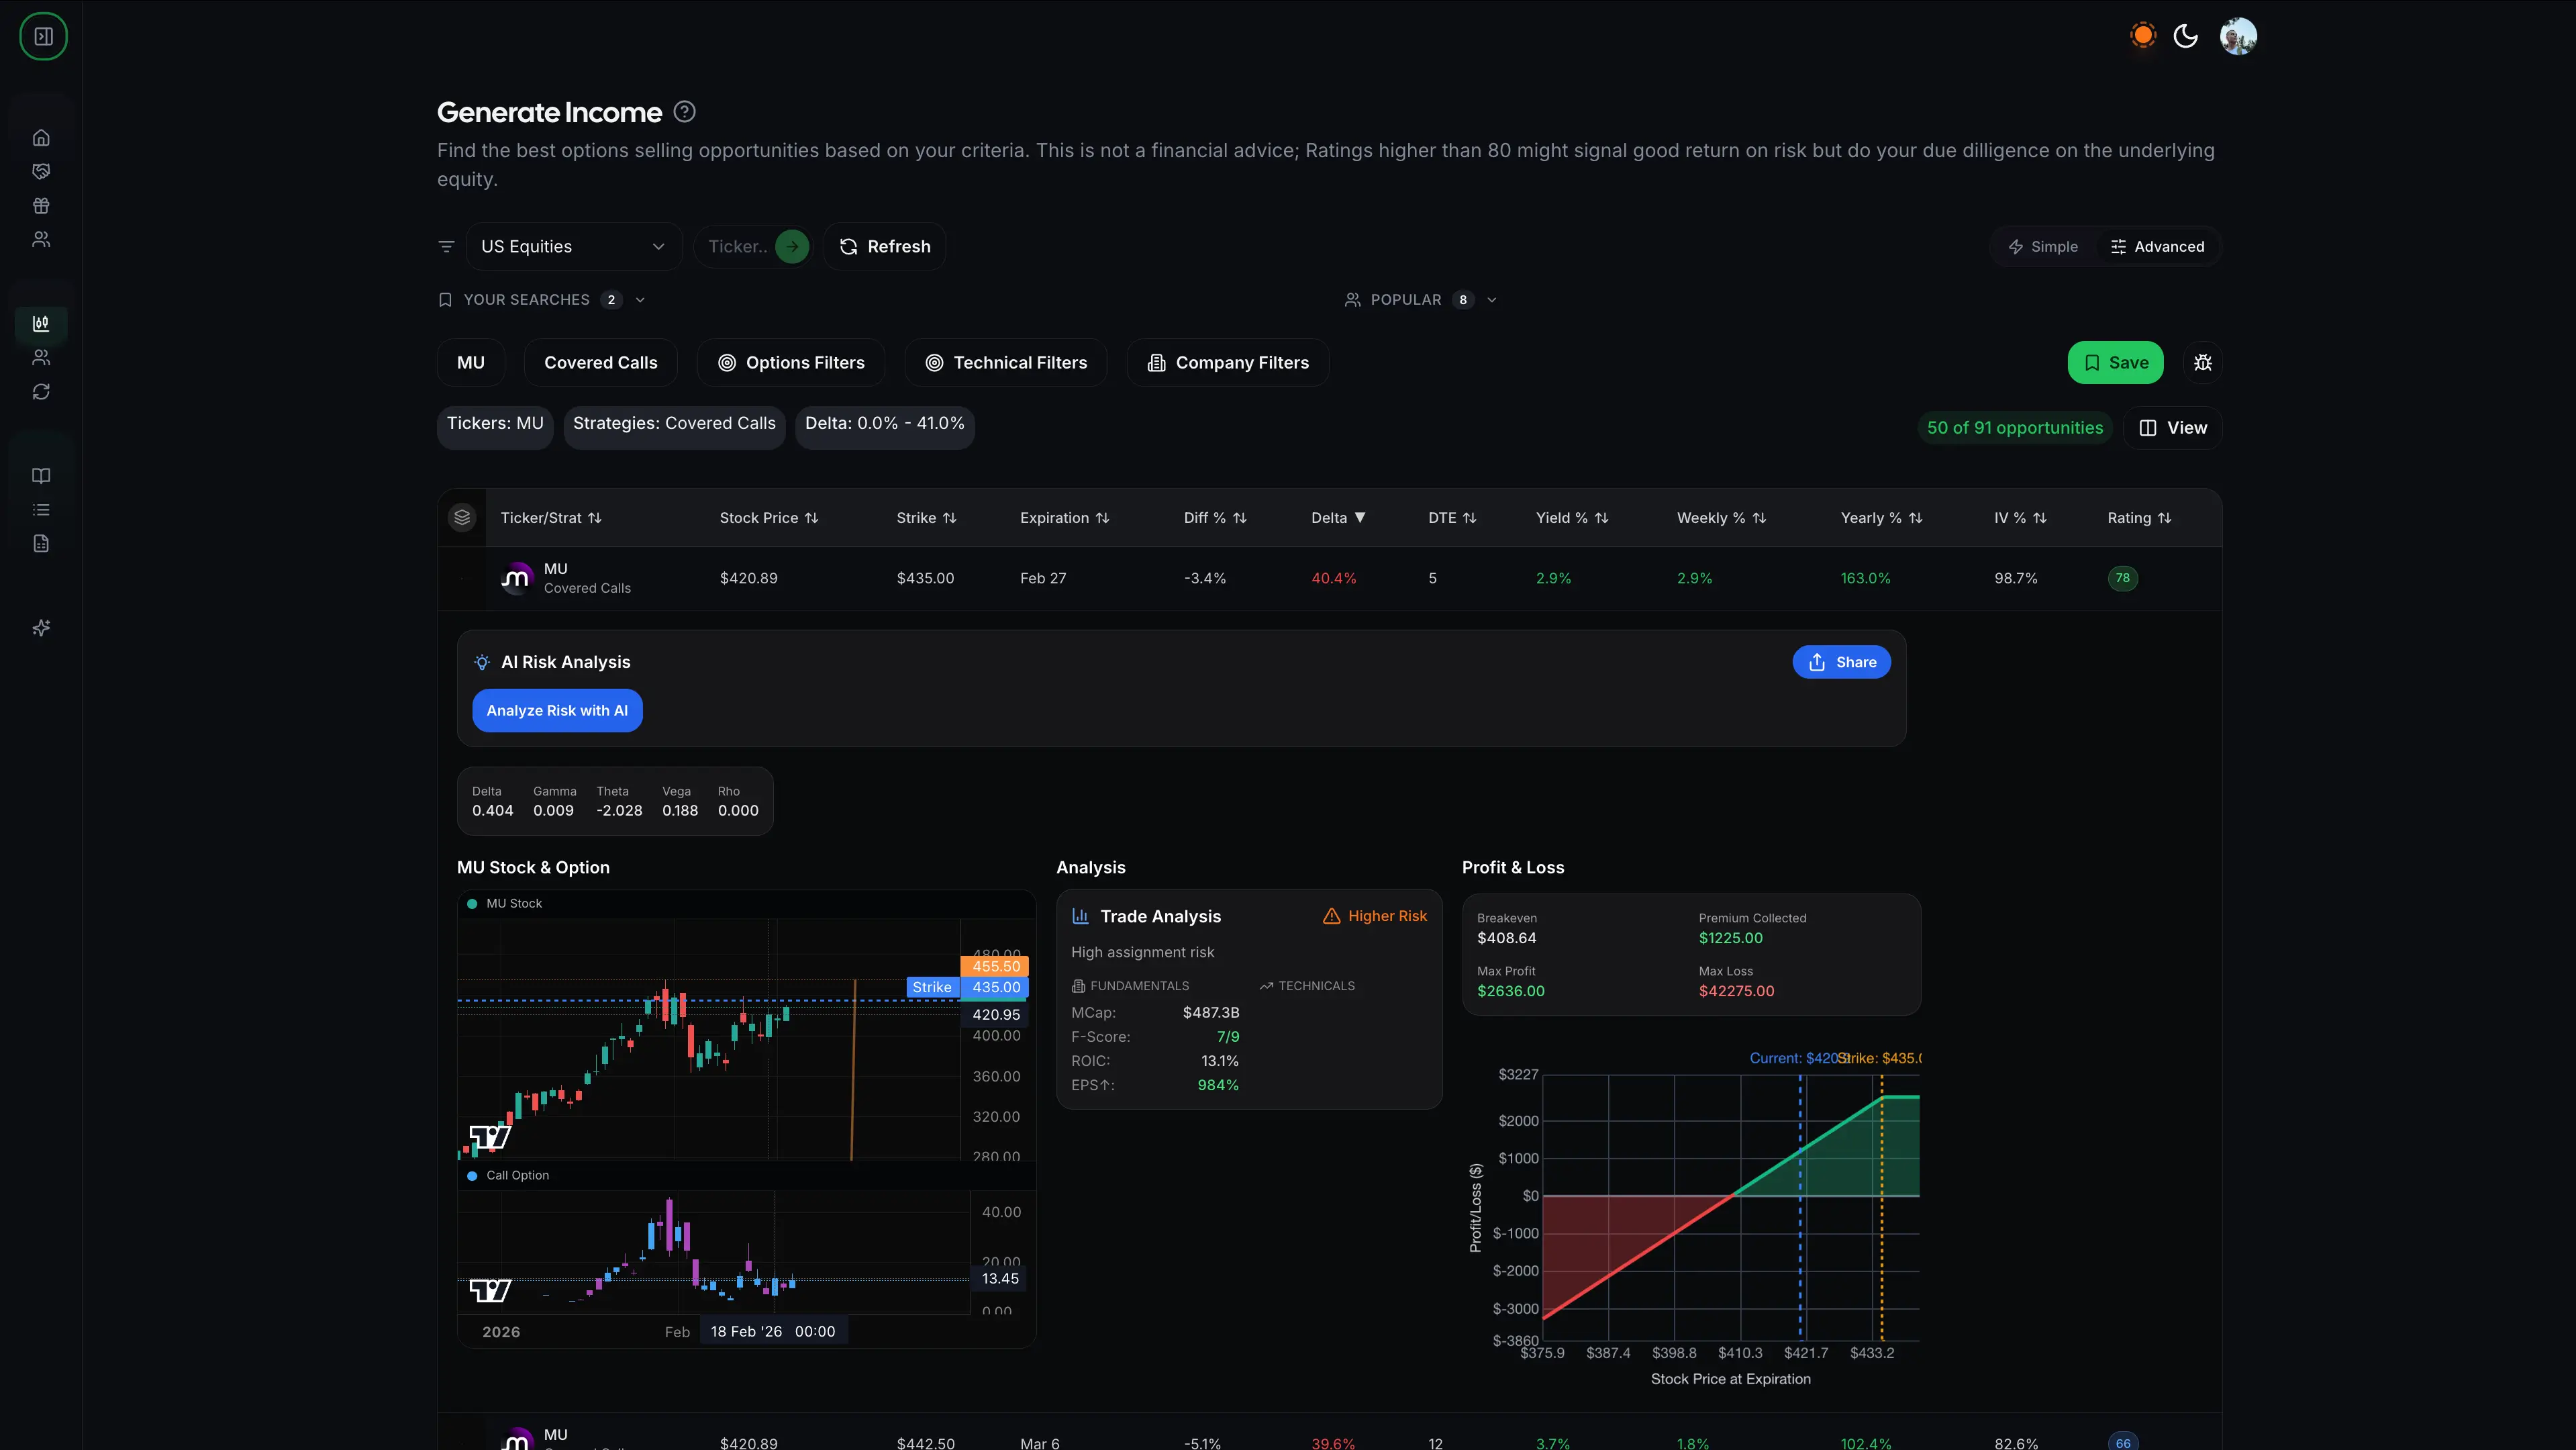
Example 4: Assignment Scenario (MU - Called Away Above Strike)
Scenario: Profitable assignment when stock exceeds strike price
Entry (February 20, 2026):
- Own: 100 shares MU at $414.00 (from previous CSP assignment at $415.50 strike, collected $150 premium)
- Real cost basis: $414.00 per share (after CSP premium)
- Sell: 1 MU Feb 27 $435 Call
- Premium collected: $12.27 per share ($1227 total)
- Days to expiration: 5 days
- Delta at entry: 0.40
- Implied volatility: 98% !!
Strike Selection Reasoning: The $435 strike allows 3.4% stock appreciation from the current $420.89 price. With 0.40 delta, assignment is possible but not certain. If assigned, total profit would be significant: $21.00 stock gain (from $414 cost basis) + $12.27 call premium = $33.27 total per share.
What Happened: MU rallied strongly, driven by positive news in the memory chip sector. By February 27, MU crossed the $435 strike price. The call went in-the-money and held its value. At the February 27 expiration, MU closed at $439.00.
Assignment: The call buyer exercised their option. Your 100 MU shares were automatically sold at $435 on February 27.
Outcome
- Shares sold at: $435.00
- Real cost basis: $414.00
- Stock gain: $21.00 per share ($2,100 total)
- Call premium kept: $12.27 per share ($1,227 total)
- Total profit: $3,327
- Return: ~8.0% (from initial CSP sale through assignment).
The Emotional Reality
While this was a profitable trade, watching MU climb to $439.00 hurts. You “left $400 on the table” (($439.00 − $435.00) × 100 shares). This is the psychological challenge of covered calls—you cap your upside.
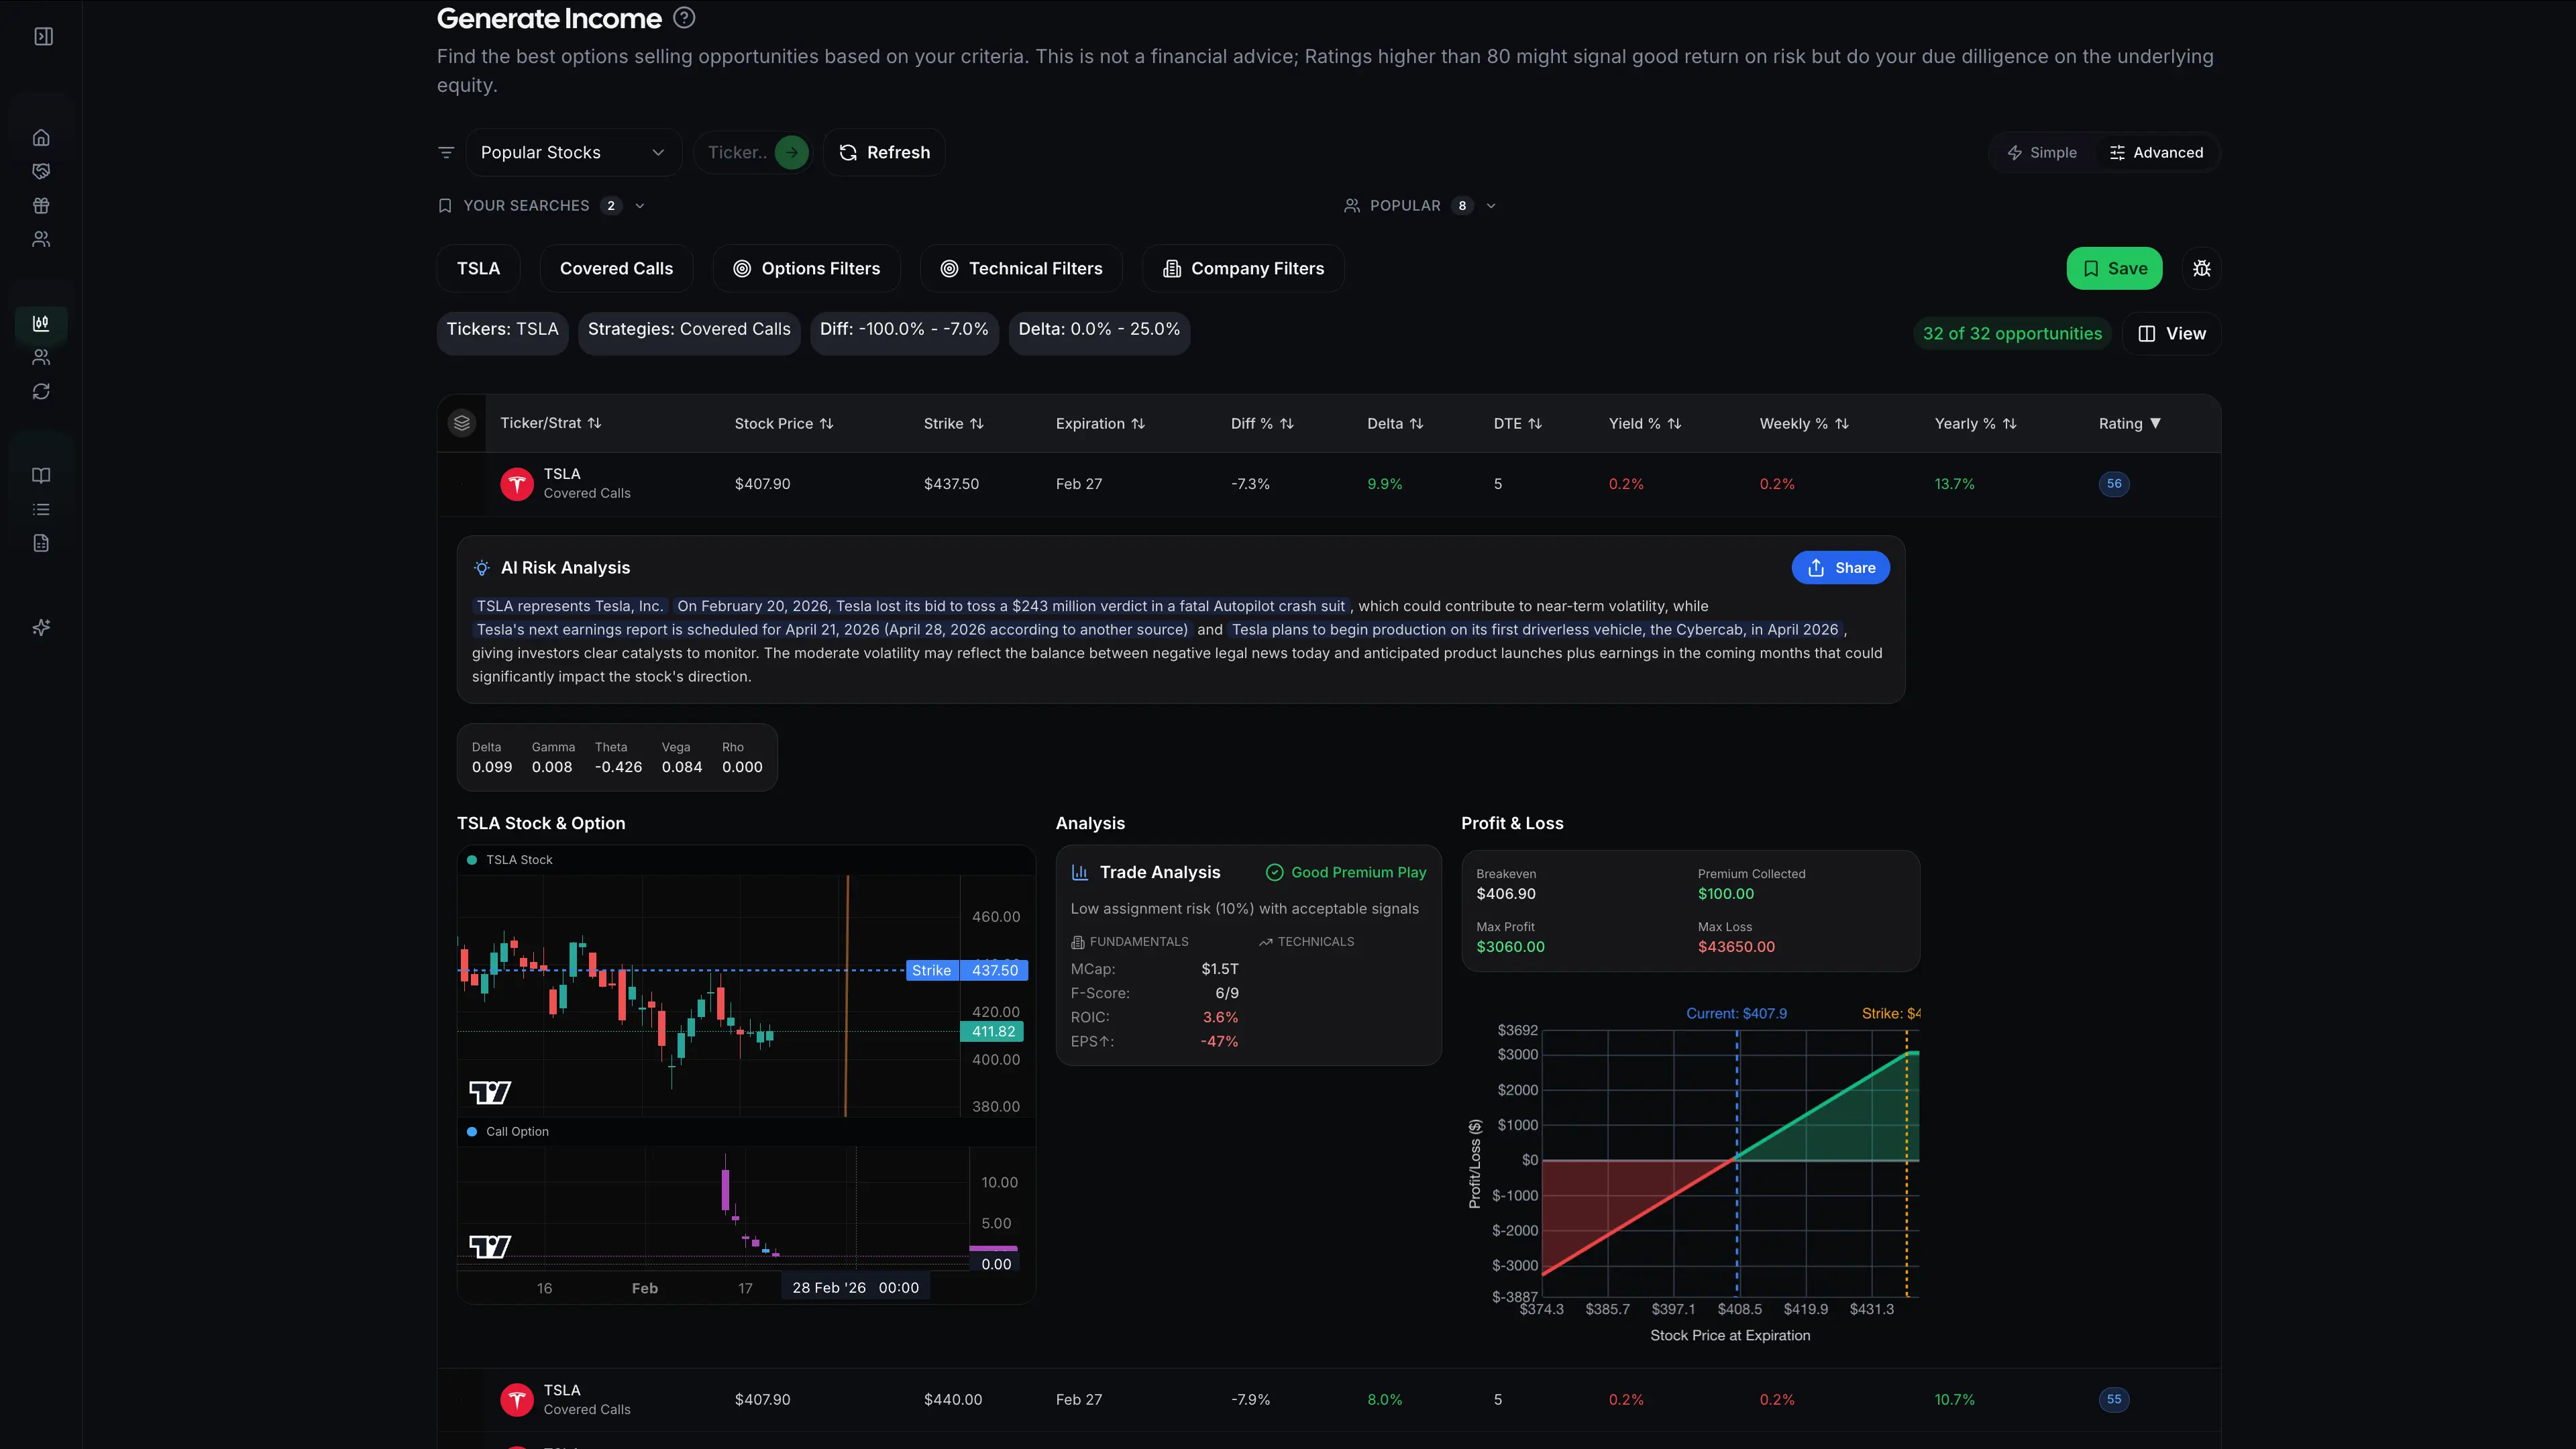
Example 5: The Unwanted Assignment (TSLA - Called Away, Wanted to Keep)
Scenario: Assignment on a stock you wanted to hold long-term
Entry (December 18, 2025):
- Own: 100 shares TSLA at $385.00 (long-term hold from 2024)
- Sell: 1 TSLA Feb 27 $437.5 Call
- Premium collected: $1 per share ($100 total)
- Days to expiration: 5 days
- Delta at entry: 0.10 (seemed safe)
- Implied volatility: 55%
Strike Selection Reasoning: The $437.5 strike was 7.3% above current price with only 0.1 delta (10% away). This seemed like "free money" - collect $100 premium with low assignment risk in 5 days. The intent was to keep TSLA long-term while generating income.
What Happened: TSLA announced Cybercab. The stock gapped up to $438, then continued climbing. By the end of February, TSLA was at $441 and the call was deep in-the-money. At expiration (January 17), TSLA closed at $440.
Assignment: Your shares were called away at $437.50.
Outcome:
- Shares sold at: $437.50 (the strike price, not market price)
- Original cost: $385.00 (from entry)
- Stock gain: $52.50 per share ($5,250 total)
- Call premium kept: $1 per share ($100 total)
- Total profit: $5,350
- Return: 13.9% on cost basis from 2024, from this trade - 0.2% in 5 days.
But here's the problem: TSLA continued climbing to $450 over the next two weeks. If you'd kept the shares, your unrealized gain would be (450 − 385) × 100 = $6,500, instead of $5,350 realized. You "lost" $1,150 in opportunity cost (6,500−5,3506,500−5,350)
The Lesson: Never sell covered calls on stocks you truly want to hold long-term unless you're comfortable being assigned. This trade was profitable, but the emotional cost of watching TSLA run without you was significant. If you want to keep a stock, either skip covered calls or sell strikes so far out-of-the-money that assignment is extremely unlikely (and accept minimal premium).
Example 6: The Loss Scenario (AAPL - Stock Drops More Than Premium)
Scenario: When the stock declines more than collected premium
Entry (February 3, 2026):
- Own: 100 shares AAPL at $232.50 (purchased specifically for wheel strategy)
- Sell: 1 AAPL Mar 7 $240 Call
- Premium collected: $4.80 per share ($480 total)
- Days to expiration: 32 days
- Delta at entry: 0.32
- Implied volatility: 28%
Strike Selection Reasoning: The $240 strike provides 3.2% upside room while collecting 2.1% premium. AAPL had been in an uptrend, making this seem like a safe trade.
What Happened: AAPL reported earnings on February 6 that missed revenue expectations. The stock dropped 8% overnight to $213.80. The covered call, now deeply out-of-the-money, provided minimal comfort. AAPL continued weak, closing at $218.40 on March 7 expiration.
Outcome:
- Stock position: Still own 100 shares at $218.40 (down $14.10 per share = $1,410 loss)
- Premium kept: $480
- Net loss: -$930
- Return: -4.0% in 32 days
What The Premium Protected: Without the covered call, the loss would have been $1,410. The $480 premium reduced the loss to $930 - a 34% reduction in losses. This shows covered calls provide downside cushion, but not downside protection.
The Decision Point: At this point, you have several choices:
- Hold the stock: Wait for AAPL to recover, no new covered call
- Sell another covered call: Lower the effective cost basis further (rolling into the wheel strategy)
- Sell the stock: Accept the $930 loss and move on
- Roll down: Sell a new call at a lower strike, collecting more premium
What Actually Happened: This trader sold another covered call: AAPL Apr 4 $225 Call for $3.10 ($310 premium). This brings total premium collected to $790, reducing the effective cost basis from $232.50 to $225.60. If AAPL recovers to $225+ by April, the position can break even or profit.
QuantWheel's Roll Tracking: When you make this kind of adjustment, tracking becomes complicated. What's your real cost basis? When did you enter? How do you calculate returns? QuantWheel automatically tracks the full sequence: initial stock purchase → first covered call → expiration → second covered call, showing your true adjusted cost basis and helping you decide whether to continue or exit.
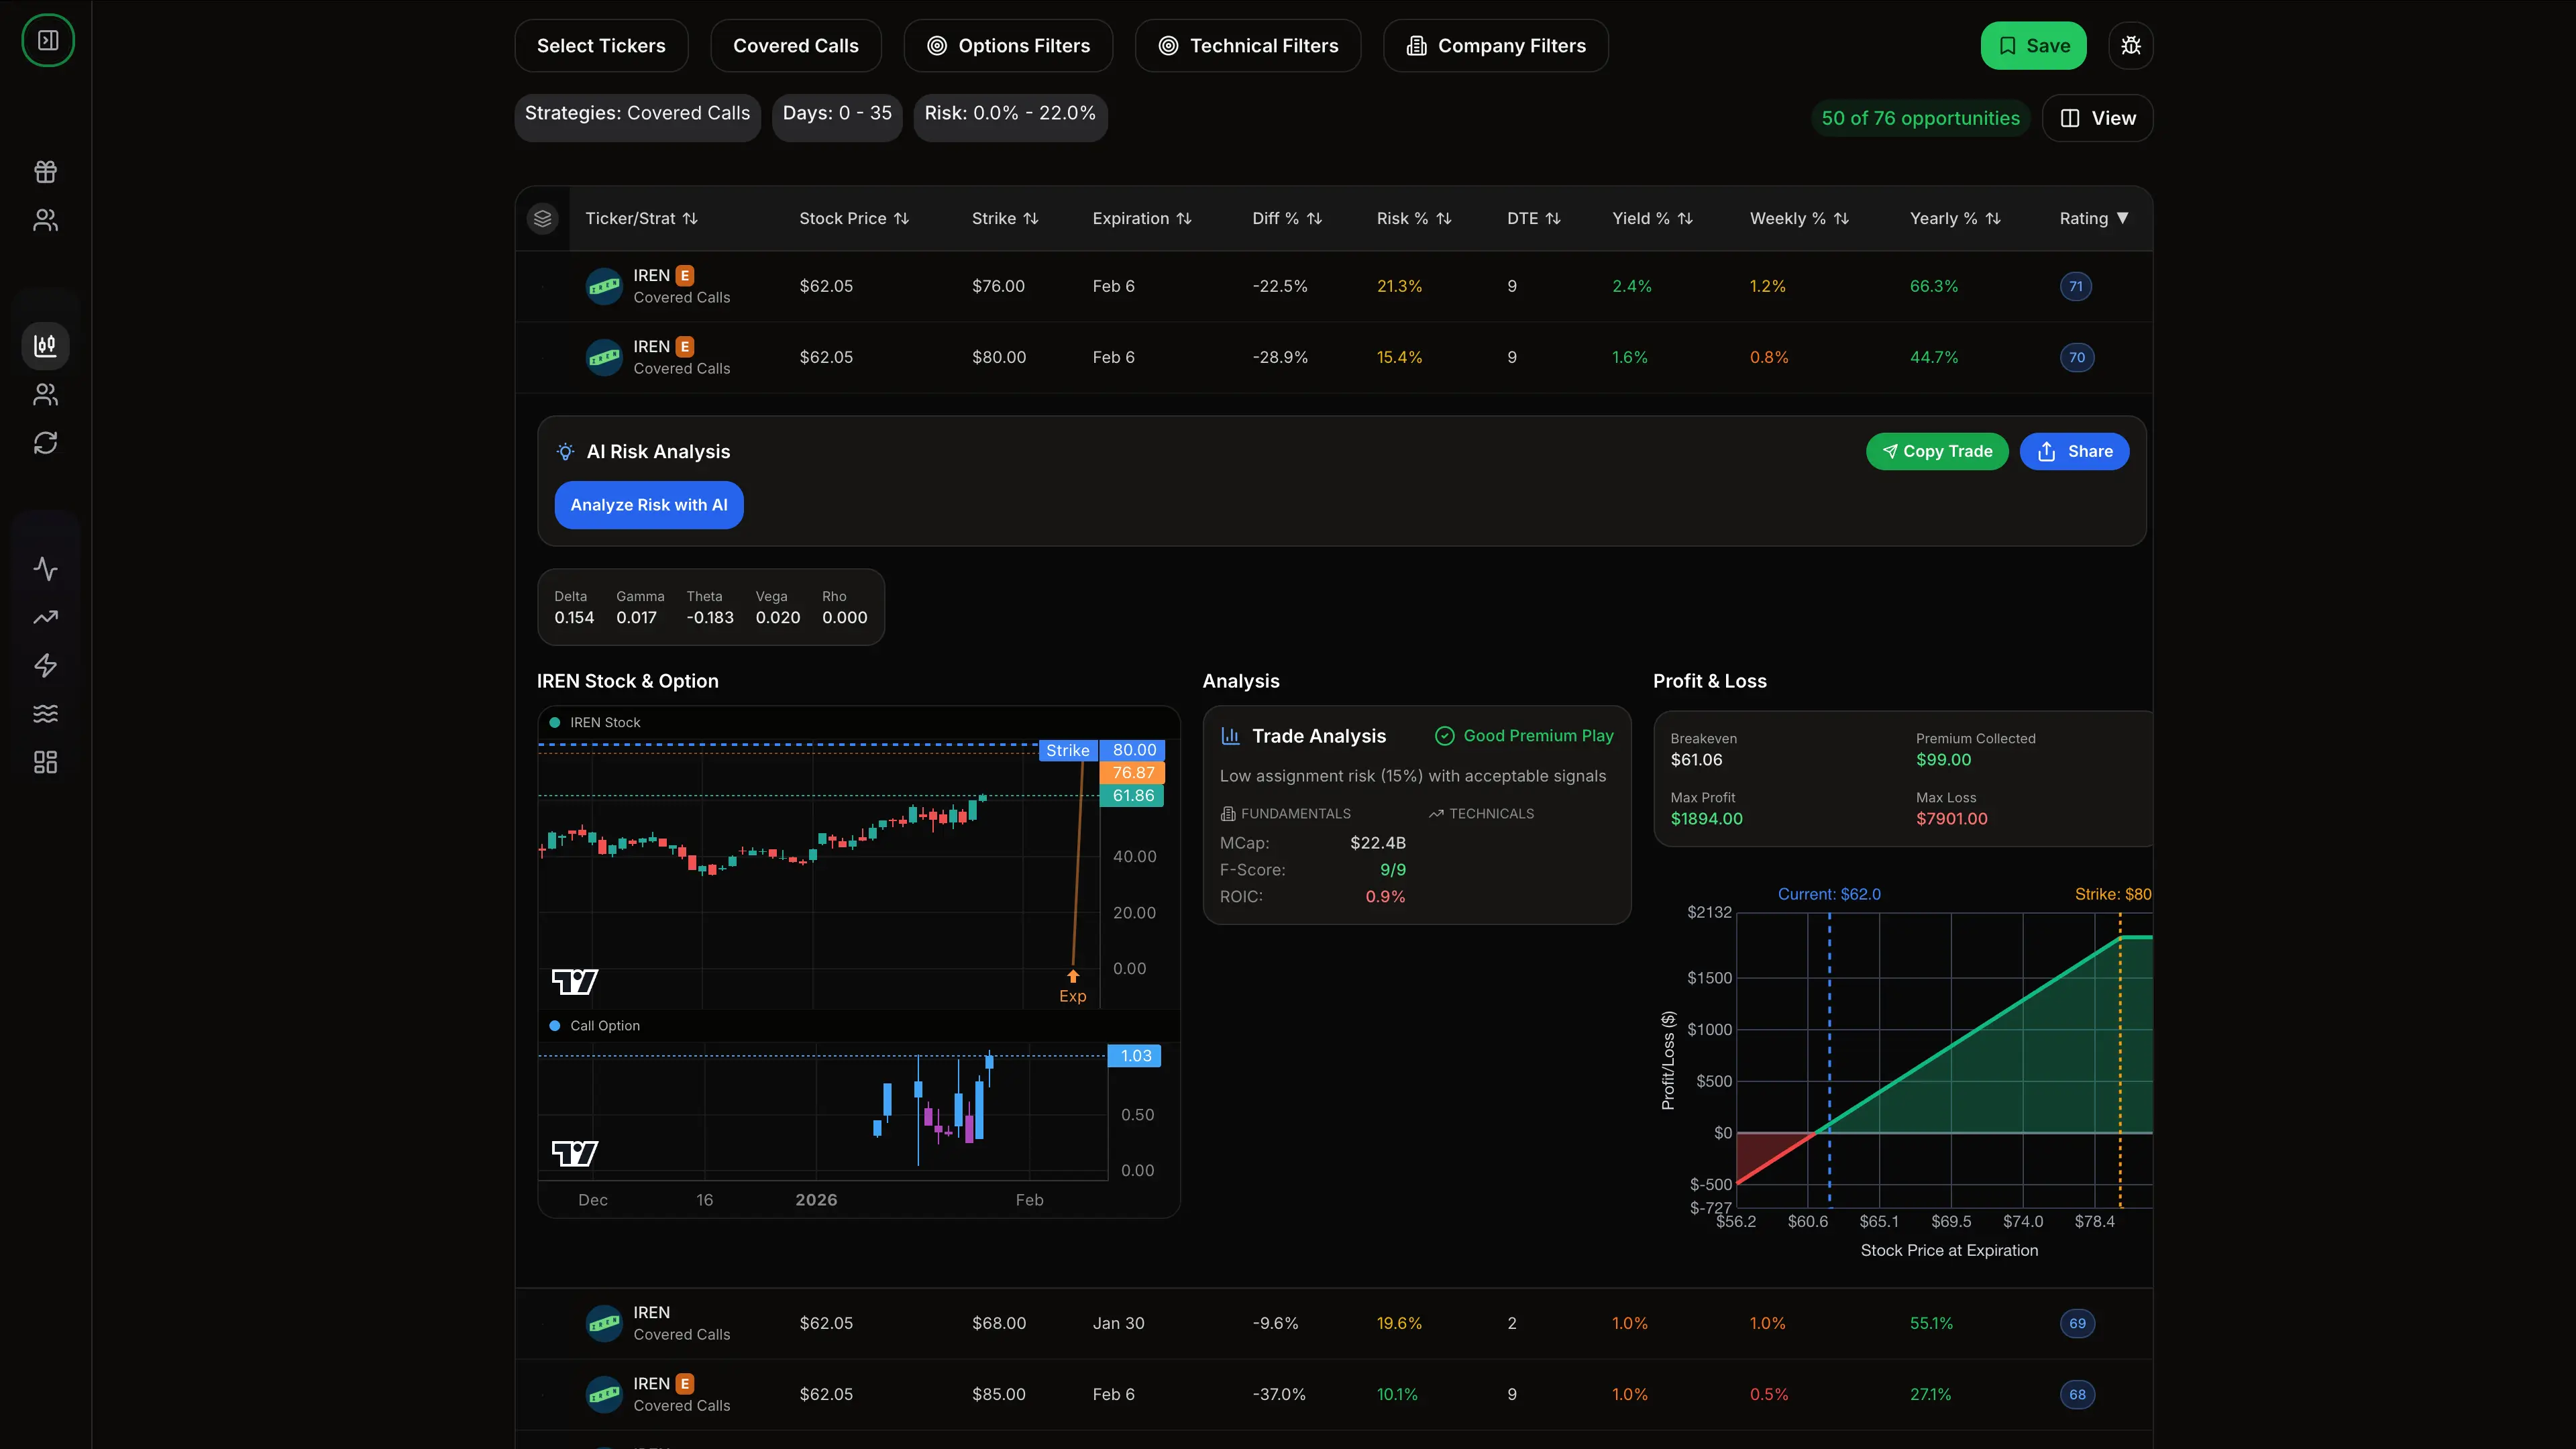
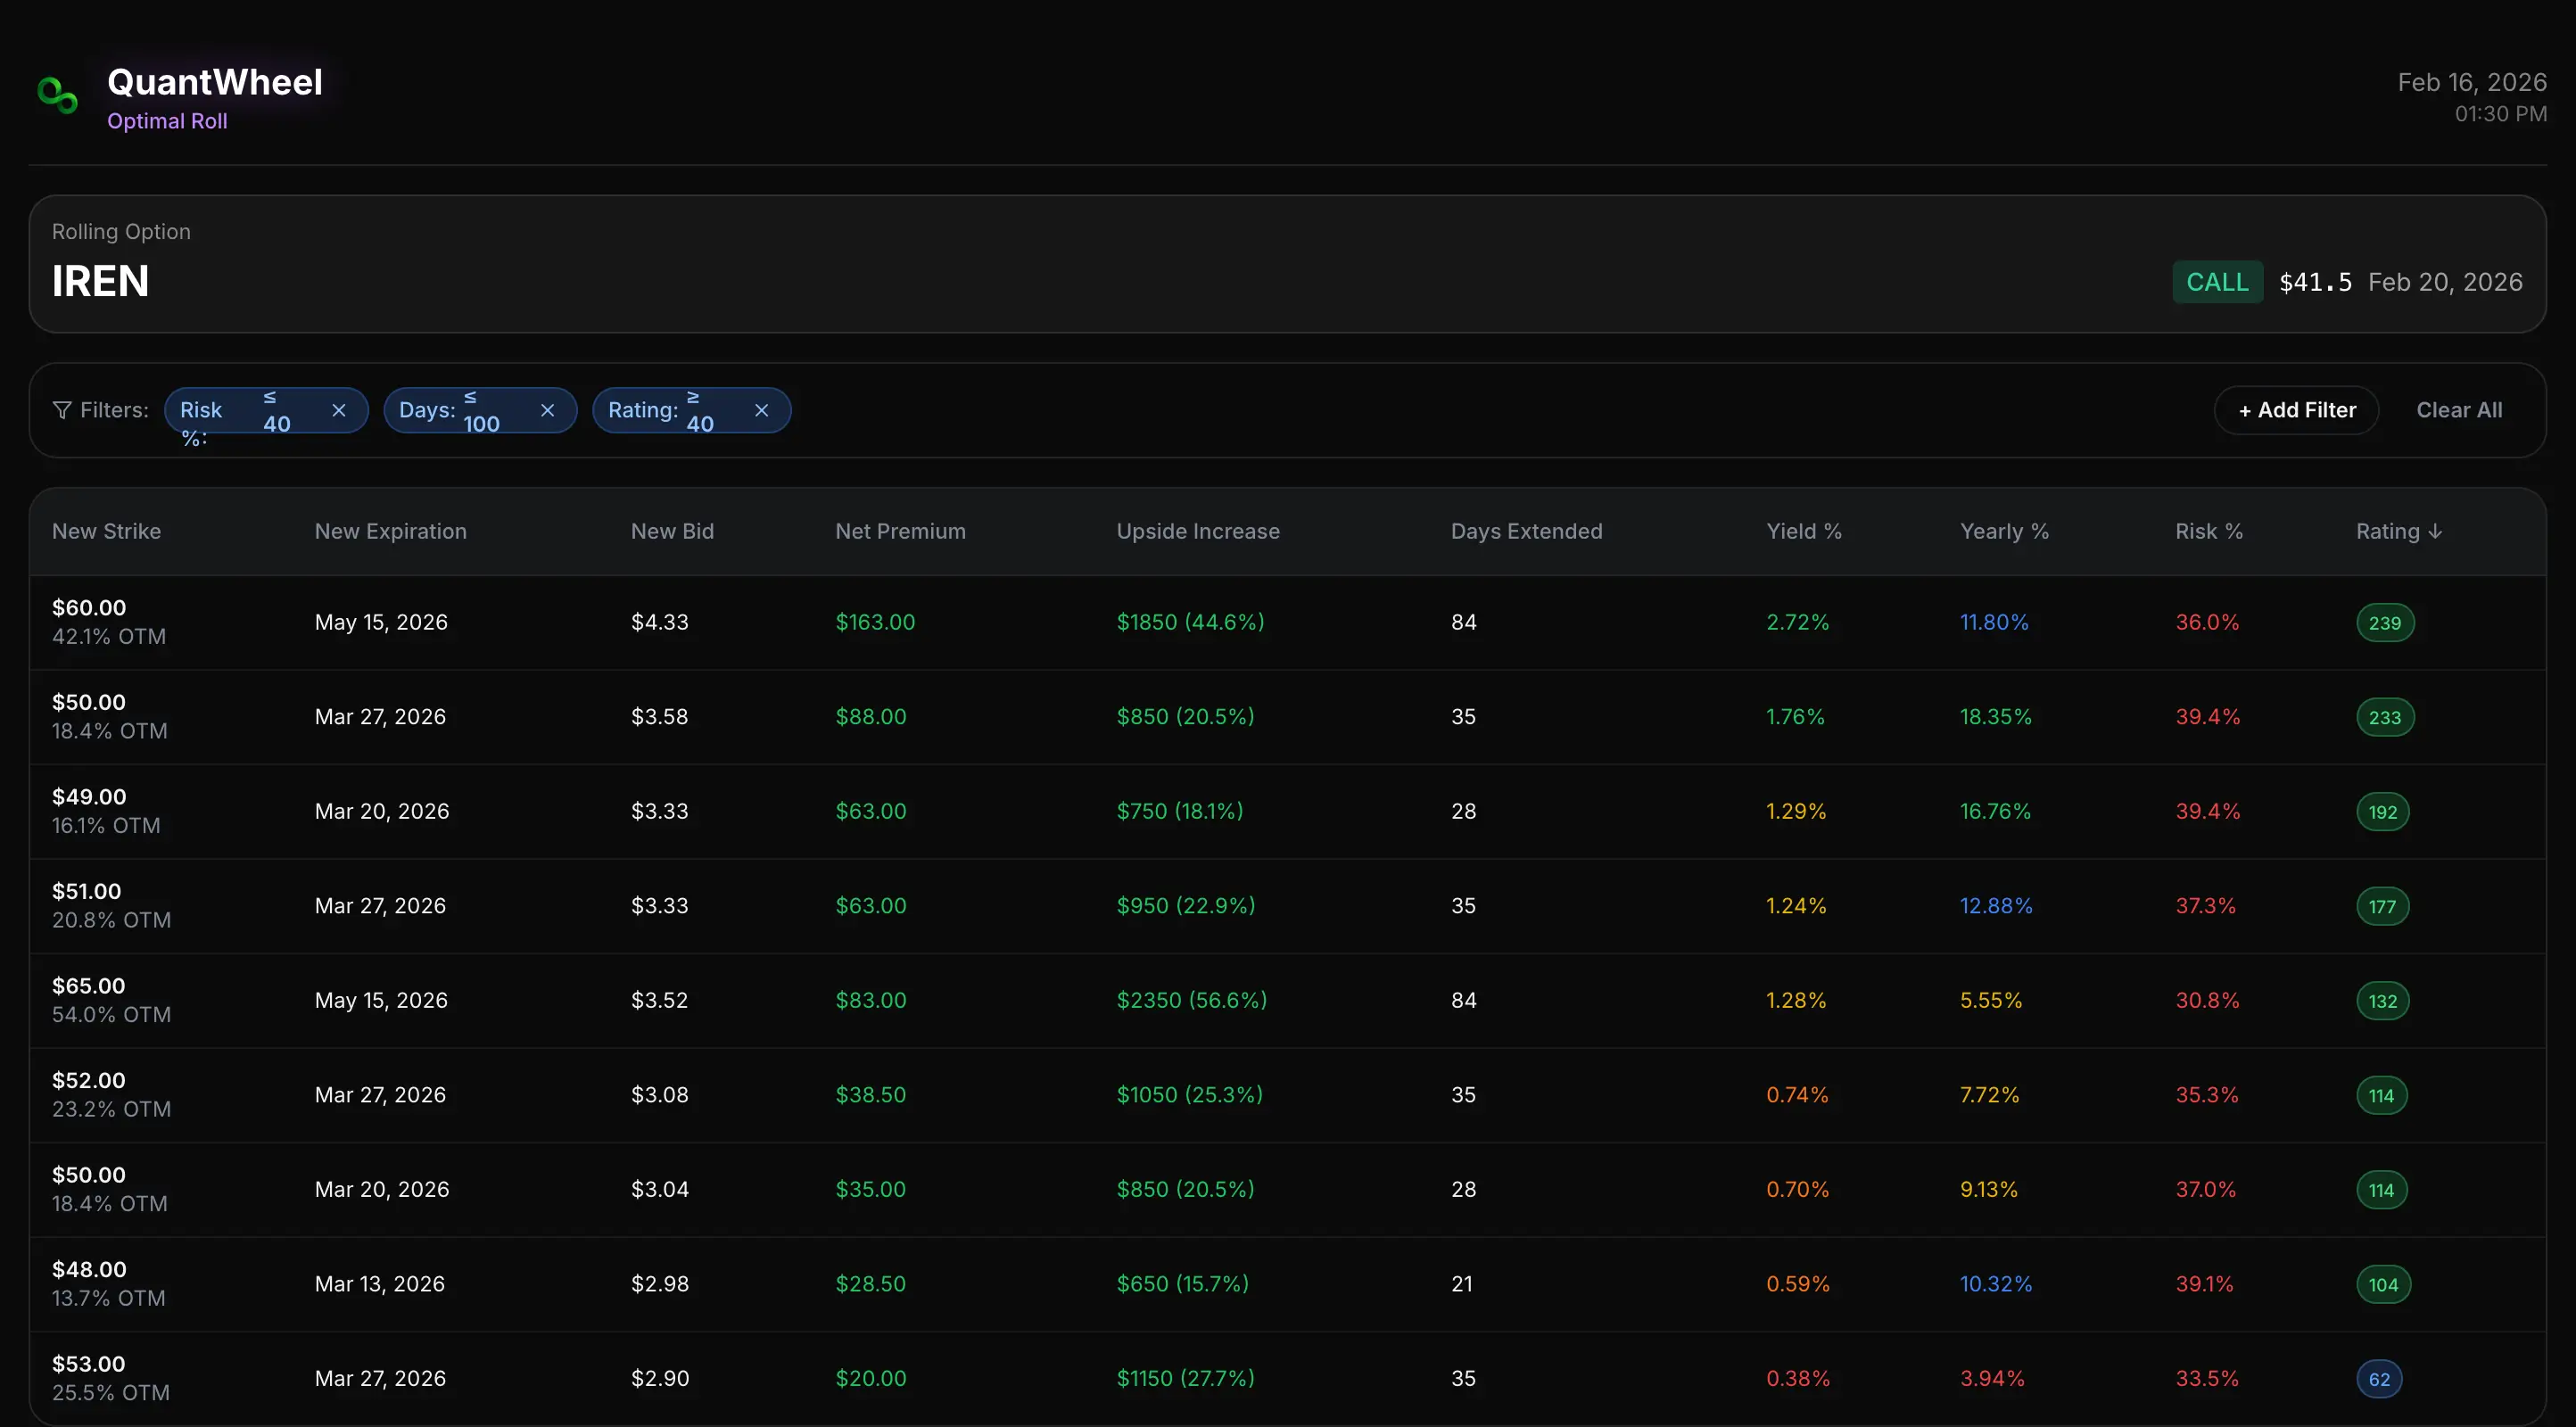
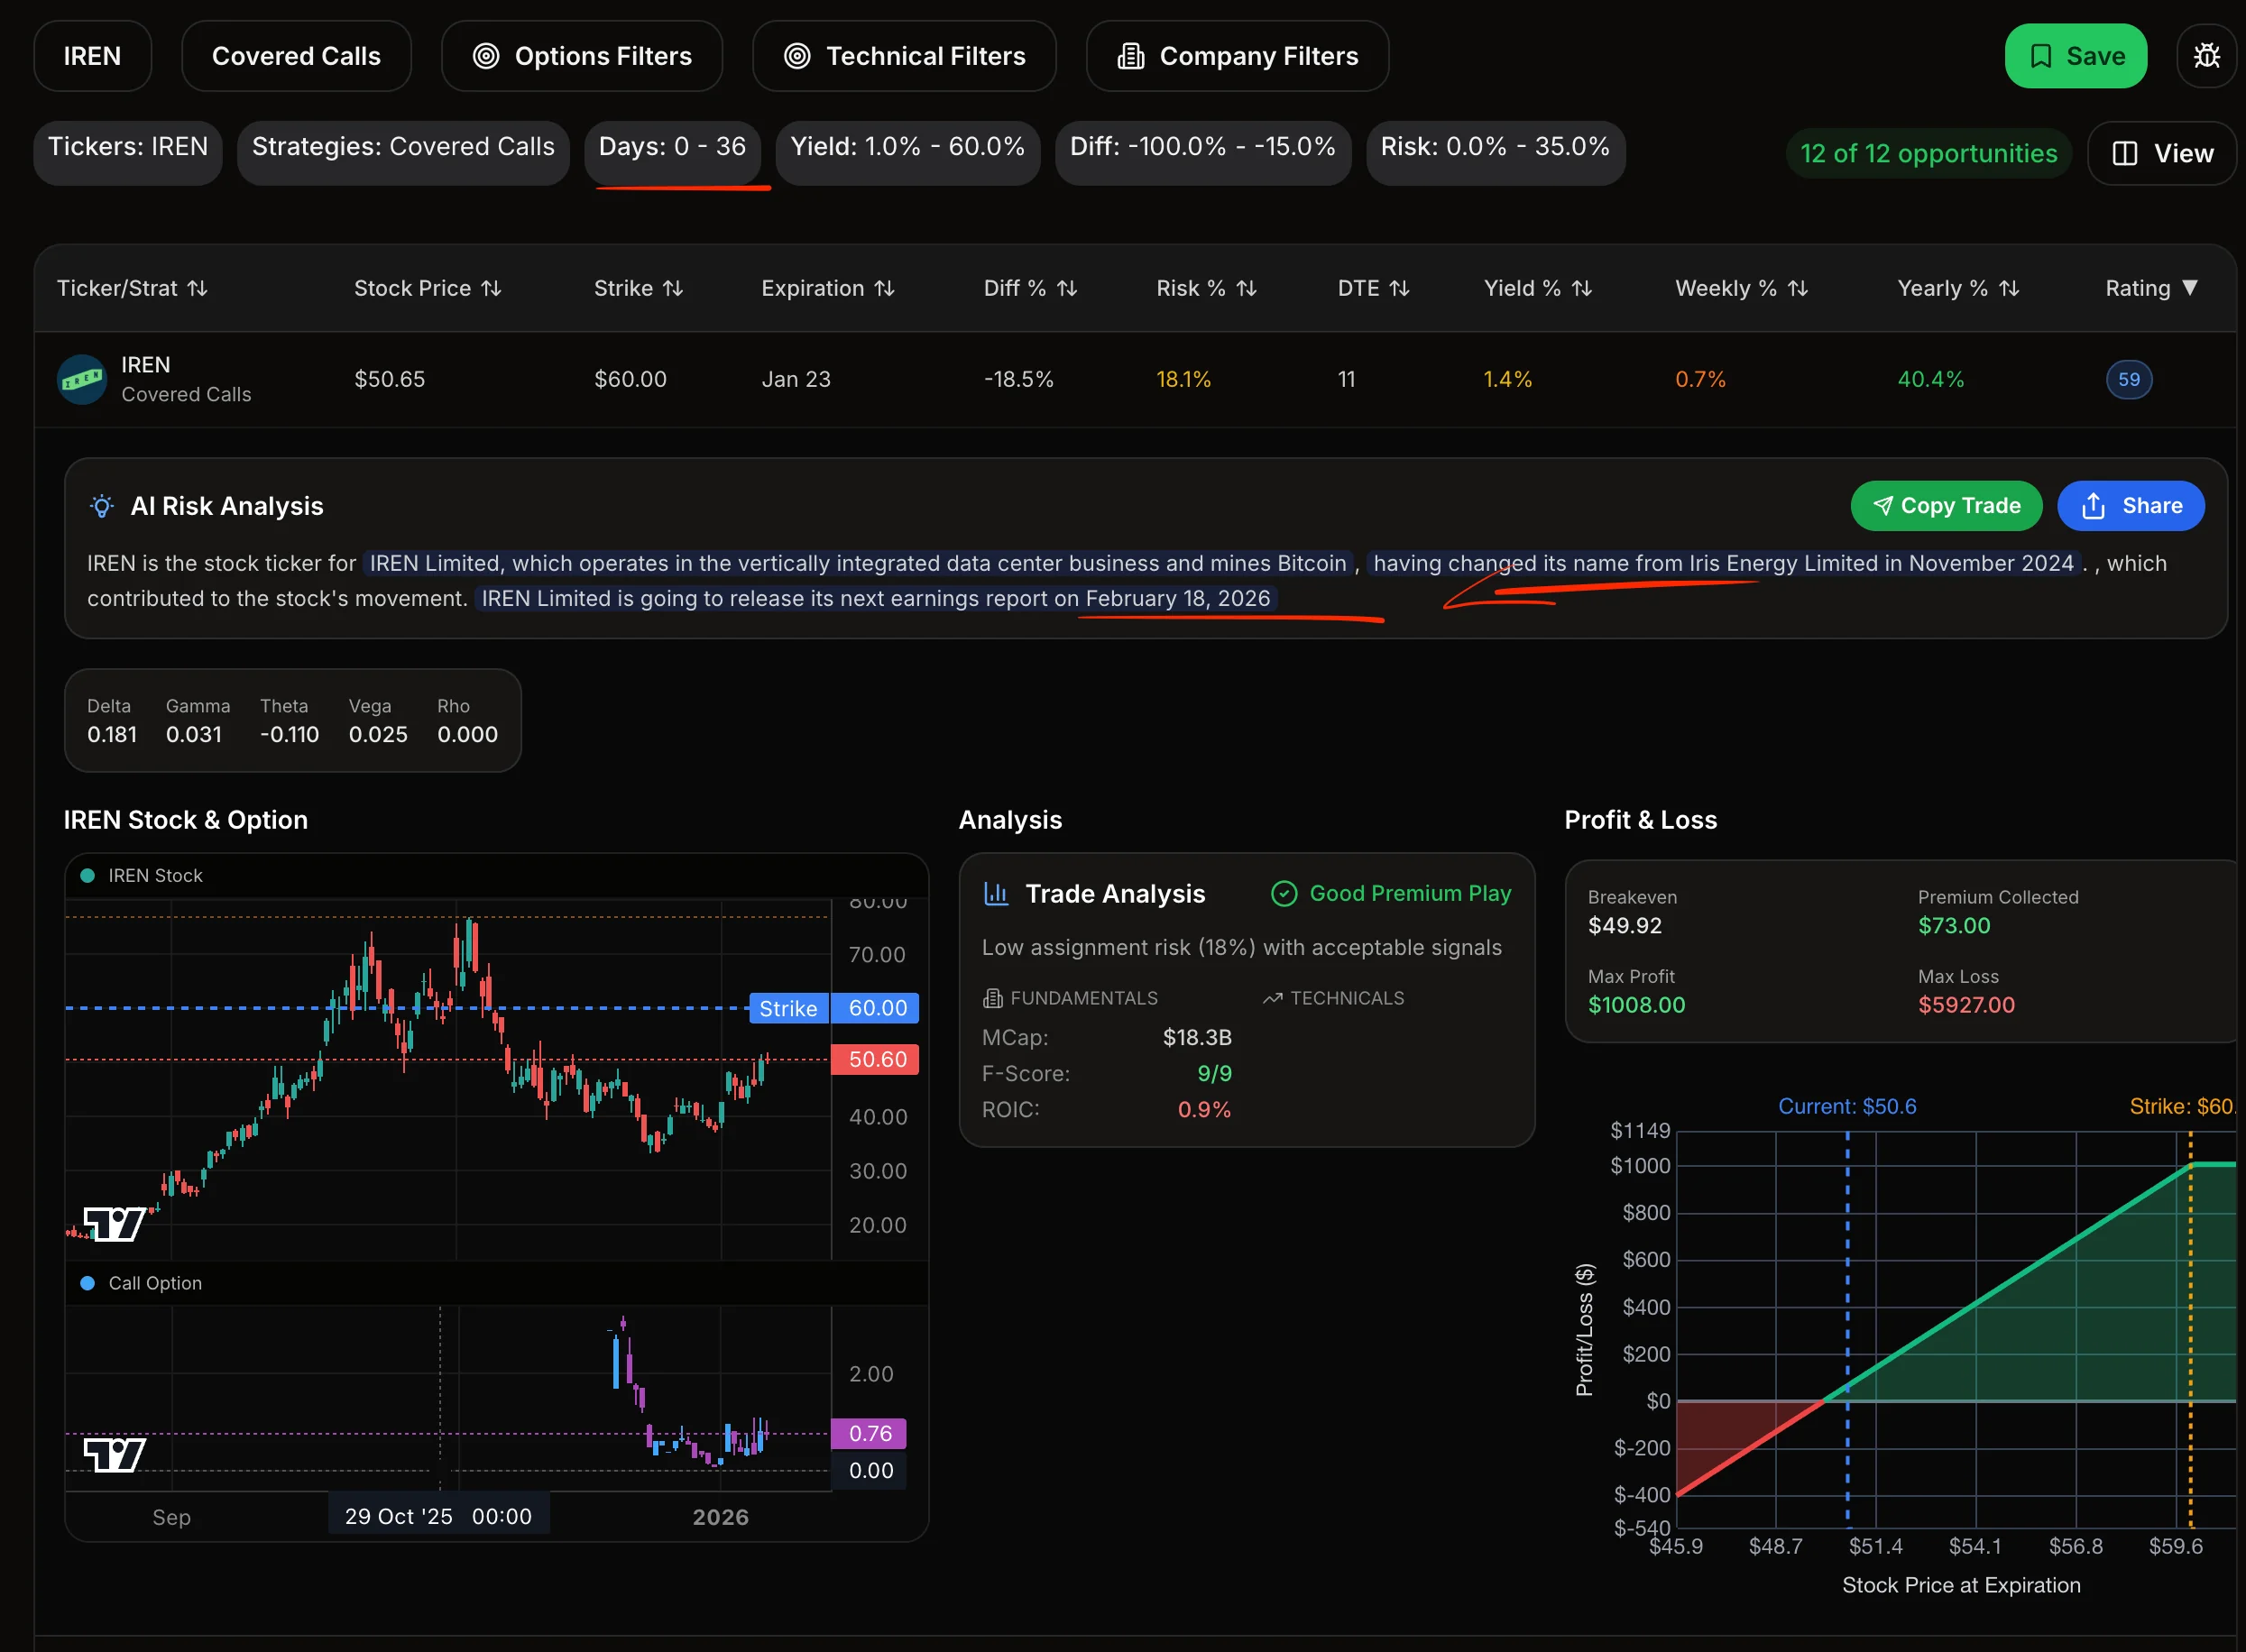
Here's how rolling the trade looks, in this case - $IREN:
Example 7: The Adjustment (SPY - Rolling to Avoid Assignment)
Scenario: Rolling a covered call to collect more premium and avoid assignment
Entry (January 22, 2026):
- Own: 100 shares SPY at $604.20
- Sell: 1 SPY Feb 21 $615 Call
- Premium collected: $5.40 per share ($540 total)
- Days to expiration: 30 days
- Delta at entry: 0.30
- Implied volatility: 14%
Strike Selection Reasoning: The $615 strike provides 1.8% upside room on SPY, a reasonable buffer for the generally lower-volatility index ETF. The premium of $5.40 represents 0.89% income in 30 days.
What Happened: SPY rallied steadily through February. By February 14 (one week before expiration), SPY was trading at $617.80 - above the $615 strike. The call was in-the-money with $2.80 intrinsic value and only $0.30 time value remaining.
The Problem: Assignment is likely at expiration. If assigned, shares sell at $615, but SPY is currently $617.80. You'd miss out on the additional $2.80 per share gain.
The Roll Decision (February 14): Instead of accepting assignment, you decide to "roll" the covered call:
- Buy to close: Feb 21 $615 Call for $3.10 (cost $310)
- Sell to open: Mar 21 $625 Call for $4.90 (collect $490)
- Net credit: $1.80 per share ($180)
- New strike: $625 (2.3% above current price)
- Additional time: 35 days
The Math:
- Original premium: $540
- Roll credit: $180
- Total premium collected: $720
- New effective return: 1.19% even if assigned at $625
What Happened Next: SPY continued higher, reaching $621.50 by March 21 expiration. The $625 call expired worthless. You kept your shares and all the premium.
Final Outcome:
- Stock position: Still own 100 shares at $621.50 (up $17.30 per share = $1,730 unrealized)
- Total premium collected: $720 realized
- Combined profit: $2,450
- Return: 4.05% in 58 days (25.5% annualized)
Why Rolling Works: Rolling allows you to:
- Avoid assignment when you want to keep shares
- Collect additional premium
- Give the stock more time to move
- Maintain your position during strong uptrends
When Rolling Doesn't Work: If SPY had dropped after the roll, you'd be holding shares at $604.20 with $720 in premium protection, but potentially underwater on the stock. Rolling extends your commitment and can trap you in losing positions if the trend reverses.
QuantWheel's Roll Assistant: Rolling involves complex calculations: buy-to-close cost, sell-to-open credit, new strike selection, time value analysis. QuantWheel's Roll Assistant shows all possible roll options ranked by expected return, making it clear whether rolling is better than accepting assignment.
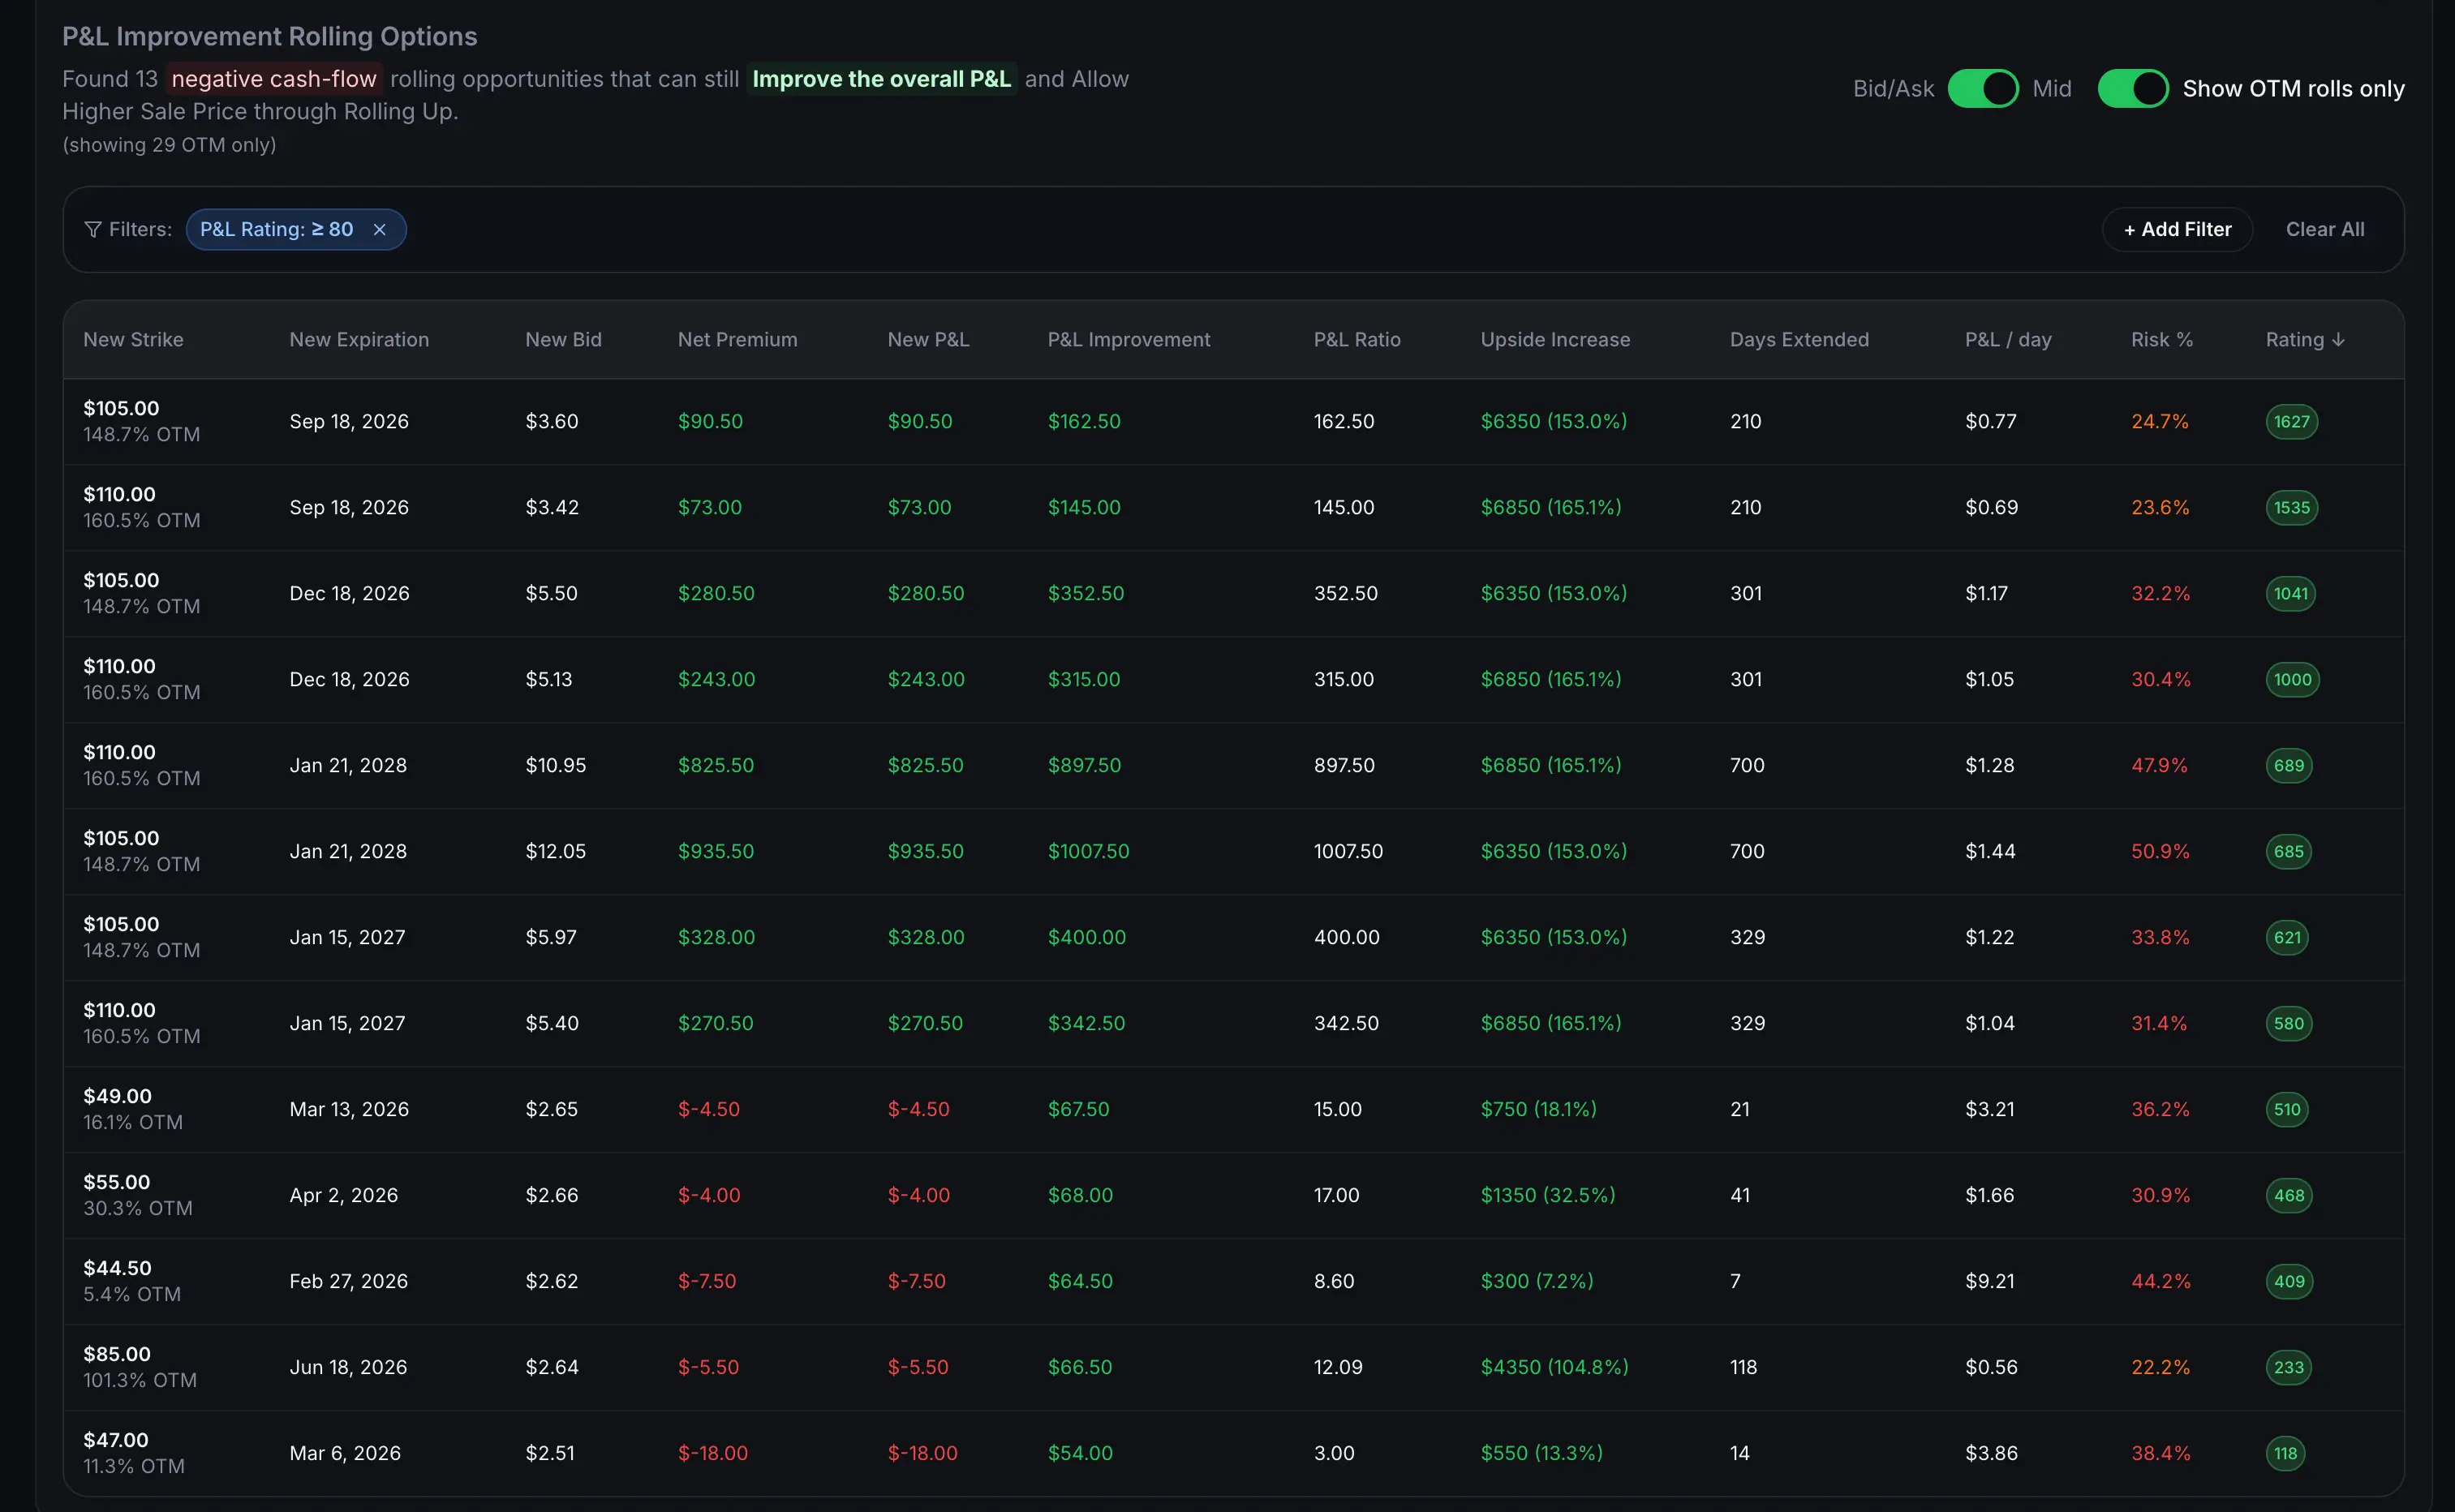
Below is another example from $IREN with the same strike price that shows negative cash-flow rolling opportunities that can still improve the overall P&L and allow higher sale price through rolling up and out.
Covered Call Strike Selection: What the Examples Teach
Looking across all seven examples, clear patterns emerge about strike selection:
For Stable Stocks (KO example):
- 2-4% out-of-the-money
- 0.20-0.30 delta
- Monthly expiration
- Focus: Consistent income, low assignment risk
For Moderate Volatility (AMD, AAPL examples):
- 4-6% out-of-the-money
- 0.25-0.35 delta
- 30-45 day expiration
- Focus: Balance income with assignment risk
For High Volatility (NVDA, PLTR, TSLA examples):
- 5-10% out-of-the-money
- 0.25-0.40 delta
- Weekly to monthly expiration
- Focus: Higher premiums justify higher assignment risk
The Trade-off:
- Closer to current price = more premium, higher assignment risk
- Further from current price = less premium, lower assignment risk
- Higher volatility = more premium at any strike
- Longer time = more premium but more risk
Premium Collection Expectations: Real Numbers
Based on these seven examples and hundreds of QuantWheel user trades:
Monthly Covered Calls (30-45 days):
- Low volatility stocks (15-25% IV): 0.8-1.5% premium
- Medium volatility stocks (25-40% IV): 1.5-2.5% premium
- High volatility stocks (40%+ IV): 2.5-5.0% premium
Weekly Covered Calls (4-7 days):
- Low volatility: 0.3-0.6% premium
- Medium volatility: 0.6-1.2% premium
- High volatility: 1.0-3.0% premium
Example targets:
- $100 stock, 30% IV, 30-day call: ~$2.00 premium ($200 per contract)
- $50 stock, 40% IV, 30-day call: ~$1.50 premium ($150 per contract)
- $200 stock, 50% IV, 7-day call: ~$3.50 premium ($350 per contract)
The volatility factor matters more than the stock price. A $50 stock with 60% IV generates more premium than a $200 stock with 20% IV.
Assignment Rates: What To Expect
From the examples above:
- 2 of 7 resulted in assignment (28.6%)
- Both assignments were profitable
- Assignment typically happens when stock rises significantly
Reality check on assignment rates:
- 0.20 delta options: ~20% assignment rate
- 0.30 delta options: ~30% assignment rate
- 0.40 delta options: ~40% assignment rate
Delta approximates assignment probability, though it's not perfect. Market moves, volatility changes, and time decay all affect the actual outcomes.
When assignment happens:
- Early assignment is rare unless the call goes deep in-the-money before expiration
- Dividend stocks may see early assignment right before ex-dividend date
- Most assignment occurs at expiration when calls finish in-the-money
The Tax Consideration (Often Ignored)
None of the examples above discussed taxes, but they matter significantly:
Short-term vs Long-term: If you've held shares less than a year, assignment creates a short-term capital gain taxed as ordinary income (potentially 37% federal). If you've held shares over a year, assignment creates a long-term capital gain (15-20% federal).
The TSLA example tax impact:
- Shares held from 2024 = long-term holding
- Sold via assignment January 2026 = long-term capital gain
- $5,050 profit × 20% = $1,010 federal tax
- Net after-tax profit: $4,040
The problem: If you're selling covered calls on stocks you've held less than a year, assignment can create an unexpected tax bill at higher rates. Consider this when selecting strikes - being assigned on shares with large unrealized long-term gains converts them to realized gains, triggering taxes.
When Covered Calls Work Best
The seven examples show covered calls excel in specific scenarios:
1. Stocks You're Willing to Sell (NVDA and TSLA examples - both profitable assignments)
If you'd be happy selling at the strike price, covered calls are ideal. You collect premium and don't mind assignment. Think of the strike price as your profit target.
2. Sideways or Slowly Rising Markets (AMD and KO examples - stock drifted up slowly)
Covered calls thrive when stocks rise gradually. You capture both premium and stock appreciation without triggering assignment. This is the "perfect trade" scenario.
3. High Volatility Periods (PLTR example - 62% IV generated 2.8% premium in 4 days)
When IV is elevated, premiums expand significantly. You get paid more for the same risk. After earnings, news events, or during market uncertainty, covered call premiums spike.
4. Income-Focused Portfolios (KO example - combining dividends with premiums)
For investors prioritizing income over growth, covered calls on dividend stocks create dual income streams: dividend yield + option premium. This works especially well in retirement accounts.
When Covered Calls Work Poorly
The examples also reveal when covered calls cause problems:
1. Strong Uptrends You Want to Keep (TSLA example - assigned during a rally)
If a stock is breaking out and you want to hold it, covered calls will get you assigned at exactly the wrong time. You'll cap gains during the best moves.
2. Sharp Downtrends (AAPL example - stock fell 8% overnight)
Covered calls provide minimal protection against large drops. The $4.80 premium protected only 34% of the $14.10 loss. If the stock plummets, your covered call won't save you.
3. Before Major Catalysts (NVDA example - rallied on AI news)
Selling calls right before earnings, product launches, or major news events often backfires. If positive news hits, you get assigned. If negative news hits, the premium doesn't protect enough. Better to wait until after the catalyst.
4. Stocks You Love Long-Term (TSLA example - emotional pain of selling winners)
The psychological toll of selling your favorite stocks via assignment hurts more than the profit helps. If you truly believe in a company's long-term future, skip covered calls or use strikes so far out that assignment is nearly impossible.
Track Your Covered Call Performance Accurately
The biggest challenge with covered calls isn't selecting strikes or managing assignments - it's tracking your actual performance across multiple positions and roll transactions.
After the first covered call, your broker shows your stock position and the option premium separately. But what's your real cost basis after assignment? When you roll a call, collecting additional premium but buying back the old call, what's your net credit? After three rolls, what's your actual return?
This is where most traders struggle and where spreadsheets break down.
The AAPL loss example shows this perfectly: after selling two covered calls, the real cost basis was $225.60 (original $232.50 - $4.80 premium - $3.10 premium), not the $232.50 the broker shows. If you don't track this accurately, you don't know when you've truly broken even.
The NVDA assignment example highlights an even trickier calculation: the original cost basis was $135 (strike) - $3 (CSP premium) = $132, not the $138 purchase price. When assigned at $145, the real gain was $13 per share, not $7. Plus the $5.50 call premium. Most traders lose track of these adjustments.
QuantWheel automatically tracks:
- Cost basis adjustments from assignments
- Cumulative premium through multiple rolls
- True returns across complete wheel cycles (CSP → assignment → covered call → assignment)
- Time-weighted returns showing annualized performance
- Comparison against buy-and-hold on the same stock
You focus on trading, QuantWheel handles the tedious accounting that makes covered calls difficult to manage at scale.
Start your free trial of QuantWheel and stop losing track of your real performance across multiple covered call positions.
Risk Disclosure
Options trading involves substantial risk and is not suitable for all investors. Past performance does not guarantee future results. This content is for educational purposes only and should not be considered investment advice. Always do your own research and consider consulting with a financial advisor before making investment decisions.
The examples used in this article are for educational purposes only and are not recommendations to buy or sell any security. Individual results will vary based on market conditions, execution, timing, and other factors.
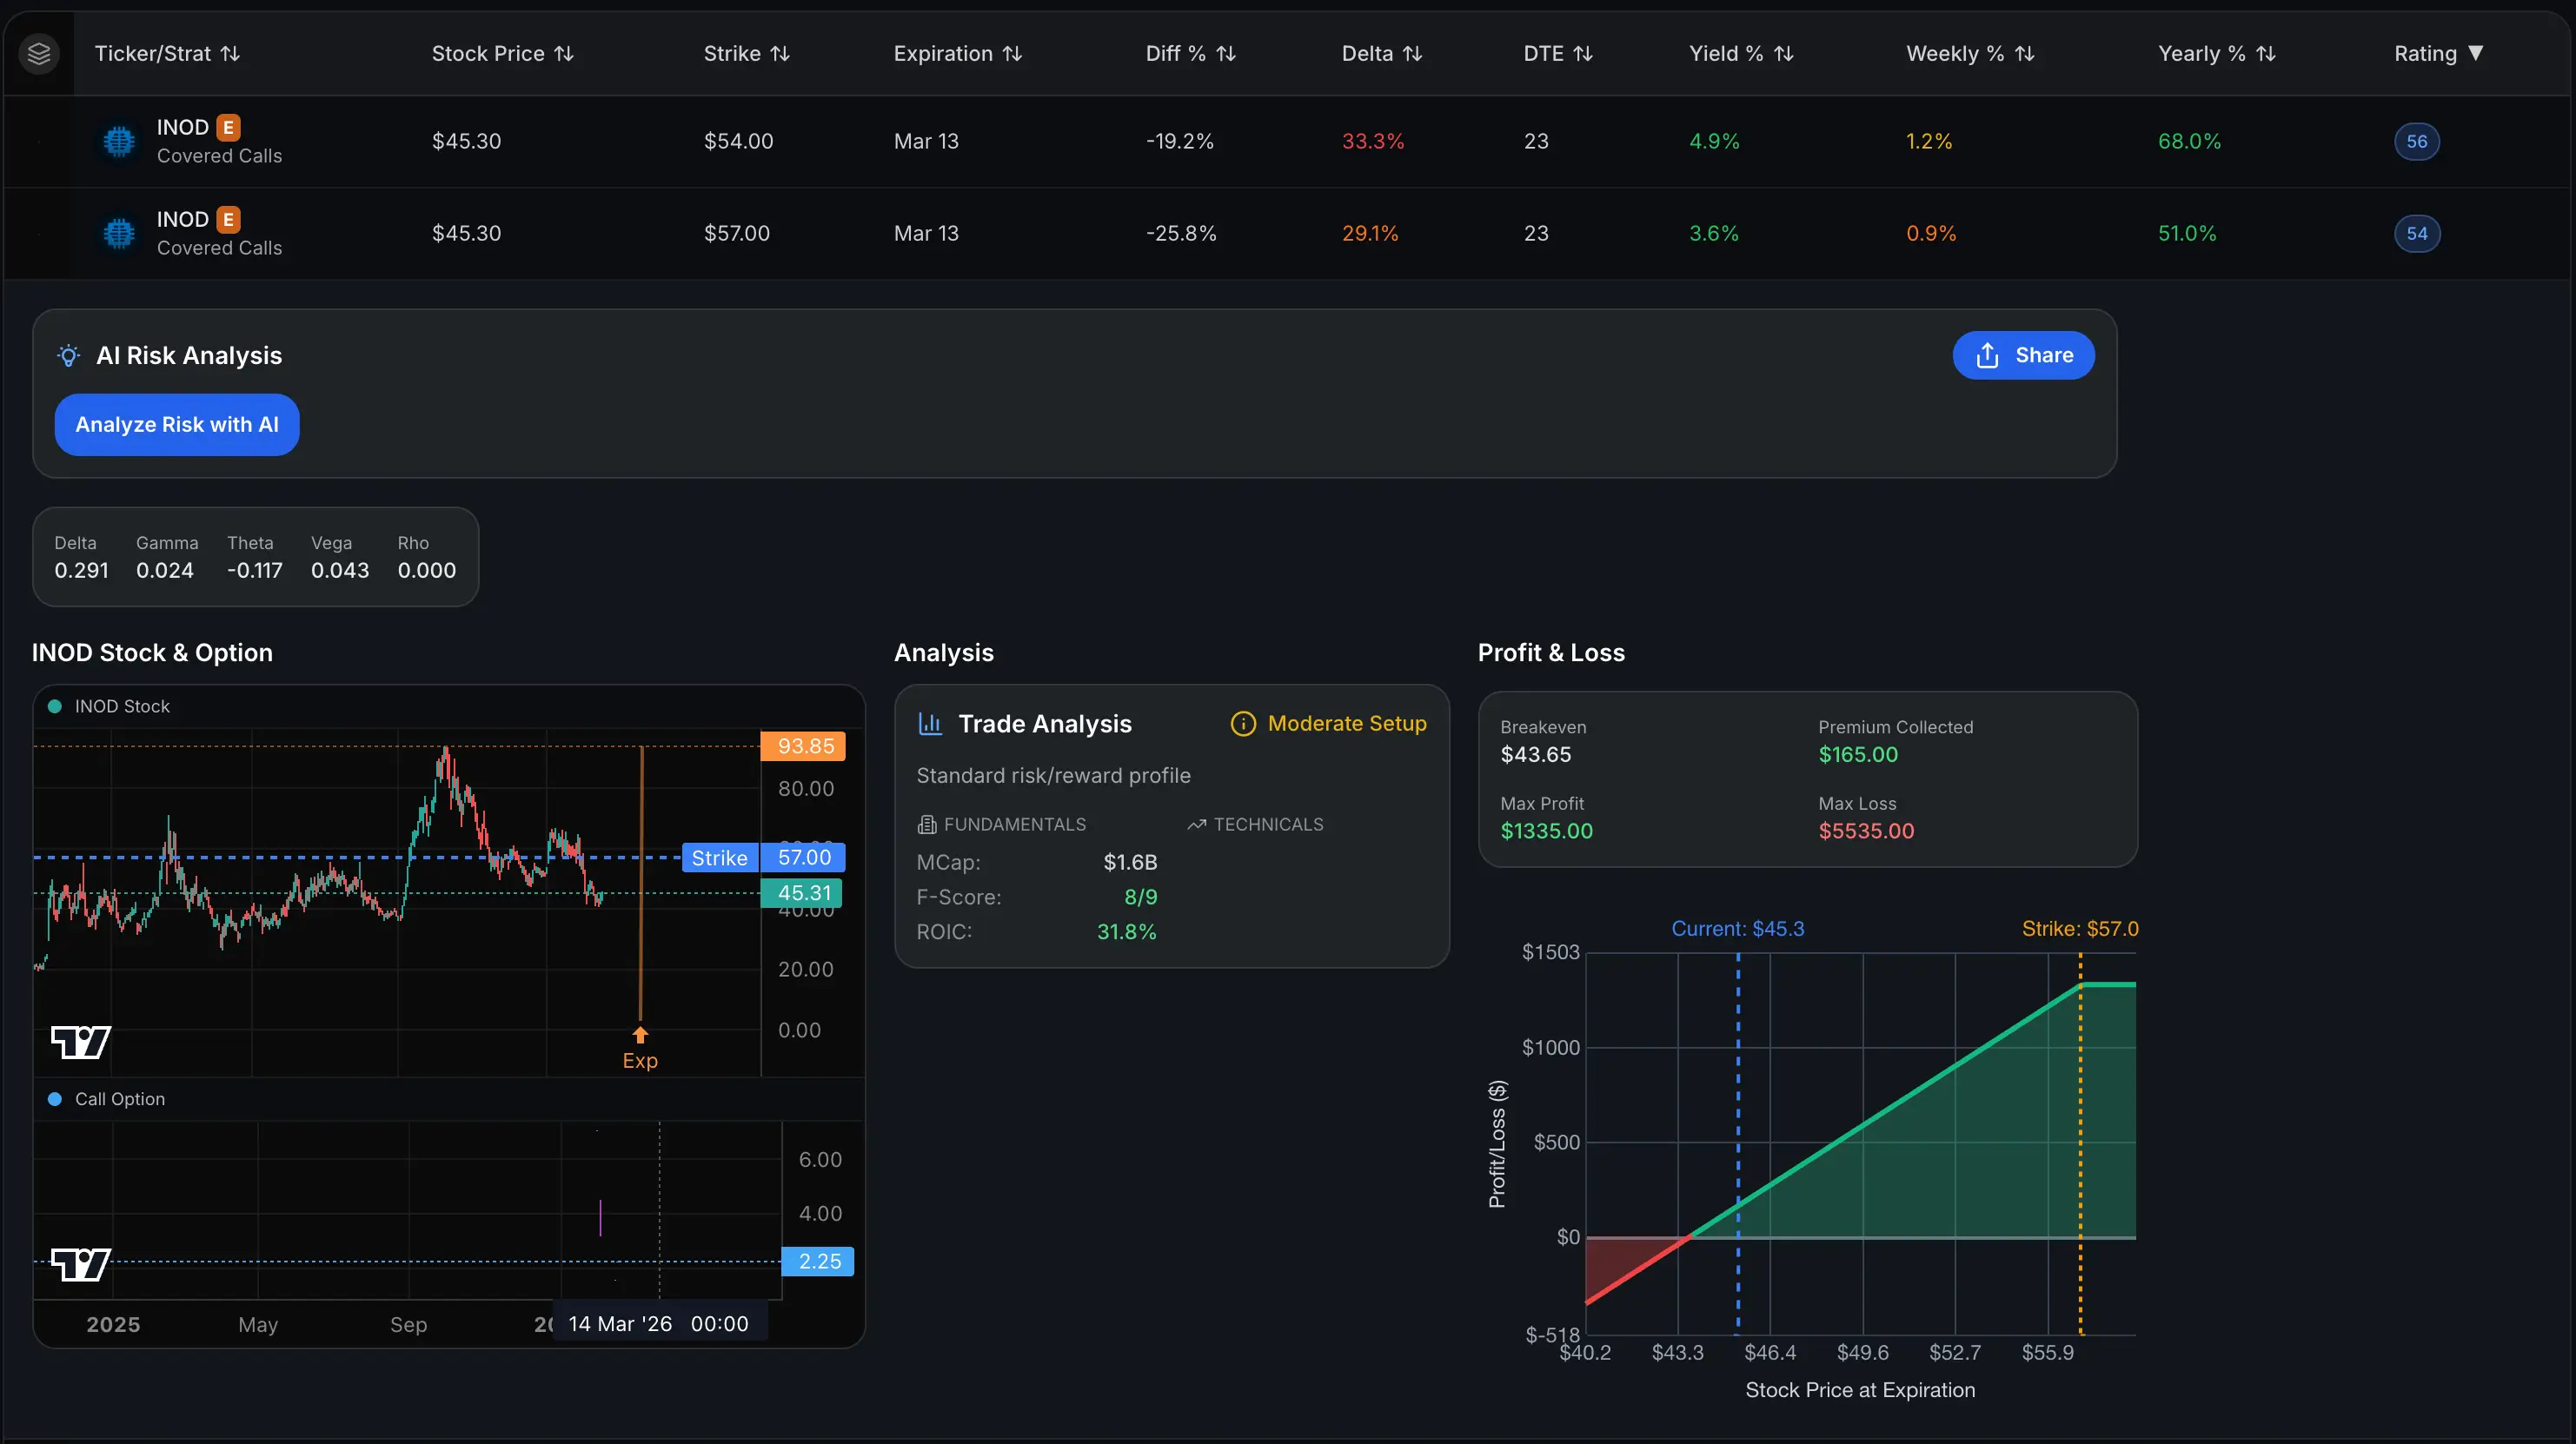
QuantWheel Example: Use the screener to see ranked trades, filter according to previous steps then pick what matches YOUR plan. In example below you can see a defensive play with a goal of keeping the stock.