You’ve heard about cash secured puts as an income strategy but what can you actually expect from cash secured put returns?
Let’s cut through the hype and look at realistic numbers and examples.
Author: David Romic.
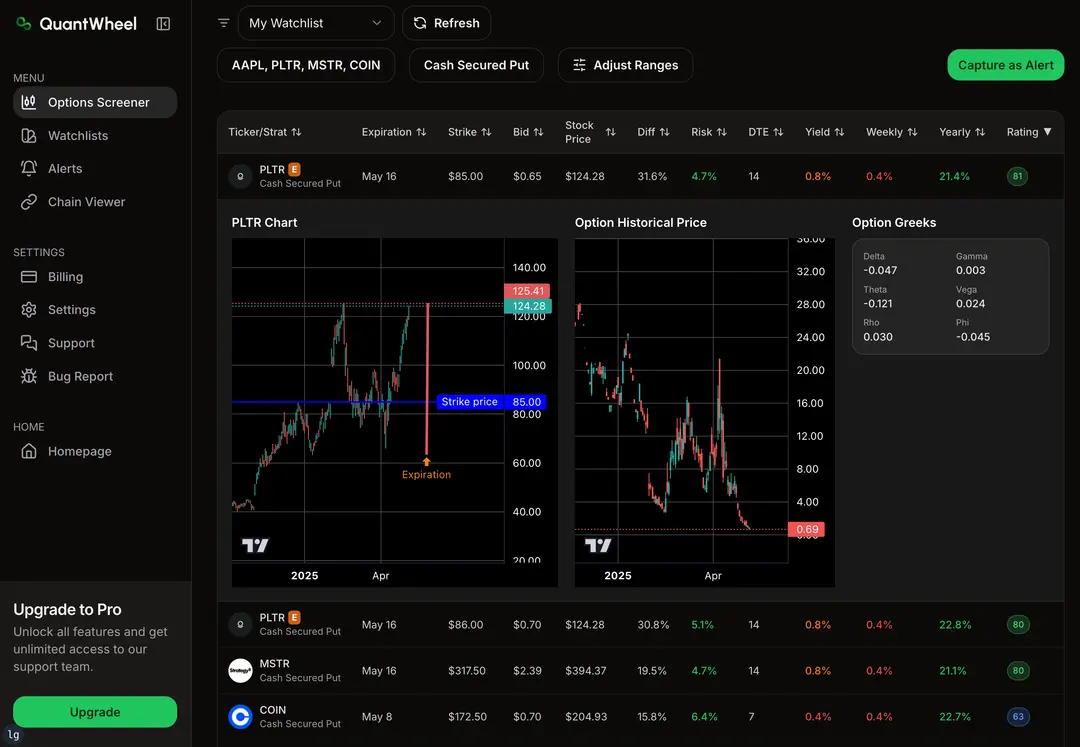
QuantWheel is the platform that powers the tracking examples which you will see in the screenshots from this article, including my personal track record example at the time of writing this article.
Scroll down to see my personal returns.
TLDR: Cash Secured Put Returns
Expected Returns: Most traders target 1-3% monthly returns (12-36% annually) from selling cash secured puts. Your actual returns depend heavily on stock selection, implied volatility, and how you manage assignments.
How It Works: When you sell a cash secured put, you collect premium upfront, 1-5% of the capital at risk per position. If the option expires worthless, you keep the premium and repeat. If you get assigned, you own shares at a reduced cost basis (strike price minus premium collected).
Key Reality Check: The premium you collect isn’t profit until the position successfully closes. Getting assigned on a stock that continues falling can wipe out months collected profits.
What Beginners Misunderstand: Your broker shows the premium as cash immediately, making it feel like profit. But you’re still on the hook to buy shares if assigned. Many traders calculate returns as “premium ÷ capital at risk” but ignore assignment risk.
Understanding Cash Secured Put Returns: The Basics
Before we dive into realistic return expectations, let’s clarify what we’re measuring.
What Are We Calculating?
- Return per position: Premium collected ÷ Capital at risk
- Annualized return: Position return × Number of positions per year
- Realized return: Actual P&L after accounting for assignments, rolls, and exits
The Premium Collection Formula
Return = (Premium Collected ÷ Capital at Risk) × 100
For example:
- You sell a $100 strike put
- You collect $3.00 premium ($300 total)
- Capital at risk: $10,000 (strike × 100 shares)
- Return: $300 ÷ $10,000 = 3%
If this position runs for 30 days, that’s roughly 3% per month, or 36% annualized.
Why Annualized Returns Are Misleading
“That 36% annualized calculation” assumes:
- You can repeat this monthly (market conditions stay favorable)
- You never get assigned (or assignments work out favorably)
- The stock doesn’t drop significantly (premium doesn’t cover losses)
- You have capital available immediately (no assignment tie-ups)
In reality, none of these hold true consistently.
Realistic Cash Secured Put Return Expectations
Let’s look at what actual traders experience, not what promotional content promises.
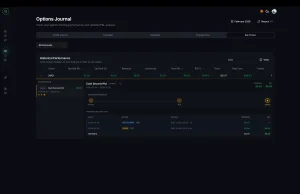
My recent performance
Real CSP Return Data: Feb 23 – Apr 13, 2026, $IREN with IV = 145%
| Metric | Value |
|---|---|
| Underlying | $IREN |
| Total premium collected | $544 |
| Avg ROI per trade | 0.55% |
| Delta at entry | 20–25Δ |
| DTE mix | 1, 4, 12, 40 DTE (avg 14.2 days) |
| Position size | 200 shares (short DTE) / 400 shares (40 DTE) |
| Capital deployed | ~$33,000 notional |
| Monthly return (extrapolated) | ~1.01% / ~$333 |
| Annualized ROI | ~12.1% |
| Outcome | All puts expired worthless |
The tradeoff is tighter premiums, but you rarely get assigned.
Note: These figures cover a single 49-day sample on one ticker and do not represent guaranteed returns. Results will vary by underlying, IV environment, and position sizing.
$IREN was trading with an IV rank above 50 during this period, which is why 0.55% per trade was achievable at a conservative 20–25Δ
Conservative Target: 12-18% Annually
Characteristics:
- Selling puts 0.10-0.20 delta (far out of the money)
- 30-45 DTE expirations
- High-quality, stable underlying stocks
- 1-1.5% monthly premium targets
- Lower assignment frequency
Example stocks: AAPL, MSFT, JNJ, PG
Typical premium: 1-2% per month
Assignment risk: Low to moderate
This is the “boring” approach—and that’s the point. You’re collecting modest premium on stocks you’d be comfortable owning long-term.
See also: How to select wheel strategy stocks →
Moderate Target: 20-30% Annually
Characteristics:
- Selling puts 0.20-0.30 delta
- 21-35 DTE expirations
- Mix of stable and moderate-growth stocks
- 2-2.5% monthly premium targets
- Moderate assignment frequency
Example stocks: AMD, PLTR, SOFI, moderate volatility growth names
Typical premium: 2-3% per month
Assignment risk: Moderate
This is where most thetagang traders operate. You’re targeting the popular wheel strategy stocks with decent liquidity and premium.
See also: The complete wheel strategy guide →
Aggressive Target: 30-40%+ Annually
Characteristics:
- Selling puts 0.30-0.40 delta (closer to at-the-money)
- 14-30 DTE expirations
- High-volatility growth stocks
- 3-5%+ monthly premium targets
- High assignment frequency
Example stocks: High-IV names, smaller caps, volatile tech stocks Typical premium: 3-6% per month Assignment risk: High
This approach can generate impressive premium collection—until market corrections. One bad assignment can wipe out months of gains.
Reality Check: What Most Traders Actually Earn
Based on discussions in r/thetagang and real trader reports:
- Year 1: 5-15% (learning curve, mistakes)
- Year 2: 15-25% (improved stock selection)
- Year 3+: 20-30% (experienced management)
Note: these are actual realized returns after accounting for losses, not theoretical annualized rates from cherry-picked positions.
“What’s a realistic return on selling cash secured puts?“ — community consensus of 12–16% long-term
“What is a realistic annual return on the wheel strategy?“ (2022) — experienced traders report 20–25% with 30–45 DTE, beginners averaging ~2%/month
“Average Returns” (Aug 2025) — community discussion on 2–8% monthly targets, context on when CSPs beat SPY
“Fully automated wheel strategy — 1 year results“ (Aug 2024) — documented 12-month cash return of 17.42% (one trader) and 28.56% (second trader) from 35–47 real trades
Other sources:
2. CBOE PUT Index 10-year performance — Cboe.com
3. Israelov & Klein, “Risk and Return of Equity Index Collar Strategies” — AQR.com
4. tastylive Market Measures, “Selling Puts: A Thorough Analysis” — tastylive.com
5. r/thetagang community backtest thread (SPY 15-Year Backtest) — Reddit
Factors That Determine Your Cash Secured Put Returns
Your returns won’t match others’ because these variables create dramatically different outcomes.
1. Implied Volatility (The Biggest Factor)
Higher IV = Higher premium = Higher potential returns (and higher risk).
Example comparison (30 DTE, 0.25 delta):
- Low IV stock (15-20 IV): 1-1.5% premium
- Medium IV stock (30-40 IV): 2-3% premium
- High IV stock (60-80 IV): 4-6% premium
But here’s the catch: High IV exists for a reason. The market is pricing in risk of significant price movement. That juicy 6% premium might come with a 40% chance of assignment and a stock that’s falling.
2. Delta Selection (Risk vs Reward)
The delta you target dramatically affects both premium collected and assignment probability.
Delta comparison (same stock, same DTE):
- 0.10 delta: ~10% probability of assignment, ~1% premium
- 0.20 delta: ~20% probability of assignment, ~1.8% premium
- 0.30 delta: ~30% probability of assignment, ~2.5% premium
- 0.40 delta: ~40% probability of assignment, ~3.5% premium
Notice the premium doesn’t scale linearly with assignment risk. Going from 0.20 to 0.30 delta adds 10% more assignment risk but only 0.7% more premium.
3. Days to Expiration (DTE)
Longer DTE provides more premium in absolute terms but lower annualized returns. Shorter DTE provides faster capital rotation but more frequent management.
DTE comparison (0.25 delta CSP):
- 7 DTE: 0.5% return per week → ~26% annualized (if repeated perfectly)
- 21 DTE: 1.5% return per 3 weeks → ~26% annualized
- 45 DTE: 2.5% return per 45 days → ~20% annualized
Most wheel traders target 30-45 DTE for optimal balance between premium collection and capital efficiency.
See: How DTE affects options premium decay →
4. Stock Selection (The Underrated Factor)
Premium is meaningless if the stock drops 30%. Stock selection determines whether your cash secured put strategy makes money long-term.
Good wheel stocks typically have:
- Stable to moderate growth business models
- History of recovering from dips
- Sufficient liquidity (tight bid-ask spreads)
- Fundamentals you understand
- Companies you’d be comfortable owning
5. Assignment Management
What you do AFTER assignment matters as much as the initial premium collected.
See: What happens when a cash-secured put gets assigned →
Scenario 1: Good Assignment
- Sold $50 put, collected $2 premium
- Assigned at $50 (cost basis now $48)
- Stock recovers to $52
- Sell covered call at $50 strike, collect $2.50
- Shares called away at $50
- Total profit: $4.50 on $5,000 risk = 9% return
Scenario 2: Bad Assignment
- Sold $50 put, collected $2 premium
- Assigned at $50 (cost basis $48)
- Stock drops to $40
- Unrealized loss: $800 (would need 4 more successful trades at $200 premium to break even)
This is where manual tracking becomes a nightmare and platforms like QuantWheel’s automatic cost basis adjustment become essential. Most traders miscalculate their real cost basis after assignment because brokers don’t adjust for the premium collected.
How to Calculate Your Real Cash Secured Put Returns
Let’s walk through accurate return calculation, because most traders get this wrong.
Step 1: Track Premium Collected
Simple enough. You sold a put and collected $X premium.
Example: Sold AMD $100 put, collected $3.00 = $300 premium
Step 2: Calculate Capital at Risk
This is the cash you must have available if assigned.
Capital at risk = Strike price × 100 shares
Example: $100 × 100 = $10,000 capital at risk
Step 3: Calculate Position Return
Position return = (Premium ÷ Capital at risk) × 100
Example: ($300 ÷ $10,000) × 100 = 3% return
Step 4: Adjust for Time Period
To compare positions with different durations:
Example: 30 DTE position at 3% return = ~36% annualized (if repeated monthly)
Step 5: Account for Assignment (Critical Step)
If you get assigned, your cost basis changes:
Adjusted cost basis = (Strike price – Premium per share) × 100
Example: ($100 – $3) × 100 = $9,700 cost basis for 100 shares
Your broker will show $10,000 cost basis. You need to track the $9,700 real cost basis yourself—unless you use something like QuantWheel that automatically adjusts for premium collected.
Step 6: Calculate Final Realized Return
If option expires worthless: Return = Premium collected ÷ Capital at risk = 3%
If assigned and sold at a profit:
- Bought at $9,700 effective cost basis
- Sold at $10,500 (after covered call assignment)
- Profit = $800
- Return = $800 ÷ $10,000 = 8%
If assigned and stock drops:
- Bought at $9,700 effective cost basis
- Current value = $8,000
- Unrealized loss = $1,700
- Return = -17%
That -17% wipes out the initial 3% premium plus five more successful 3% trades.
Common Mistakes That Destroy Cash Secured Put Returns
Mistake #1: Treating Premium as Profit Immediately
You collected $500 premium. That’s not profit—it’s temporary credit while you have an open obligation.
The fix: Only count premium as profit after the position closes successfully (expires worthless or you bought it back profitably).
Mistake #2: Ignoring Assignment Risk in Return Calculations
Saying “I made 40% annualized!” based on successful positions while ignoring the three assignments that lost money is self-deception.
The fix: Track ALL positions, including losers. Calculate portfolio-level returns, not cherry-picked winners.
Mistake #3: Not Tracking Cost Basis After Assignment
Your broker shows you bought shares at $100. Your real cost basis is $97 (after $3 premium collected). This matters for tax reporting and accurate P&L.
The fix: Manually track adjusted cost basis in spreadsheets, or use a platform like QuantWheel that automatically calculates this when you get assigned.
Mistake #4: Chasing High Premium Without Understanding Why
A stock offering 8% monthly premium sounds amazing—until you realize it’s in free-fall and the premium doesn’t cover the downside risk.
The fix: Evaluate WHY premium is high. High IV due to temporary uncertainty (earnings) is different from high IV due to deteriorating fundamentals.
Mistake #5: Not Scaling Capital Appropriately
Using 80% of your capital on cash secured puts leaves no room to add to losing positions or take advantage of opportunities.
The fix: Most conservative traders use no more than 30-50% of capital on CSPs at any time, keeping powder dry for better opportunities or assignment scenarios.
Tracking Cash Secured Put Returns: Manual vs Automated
After running 10+ CSP positions, you’ll face a choice: maintain increasingly complex spreadsheets or use professional tracking.
The Spreadsheet Approach
What you need to track manually:
- Entry date, strike, expiration, premium collected
- Adjusted cost basis if assigned (strike – premium)
- Covered call premium if wheeling
- Roll history (if rolling positions)
- Final P&L and exit date
- Position-level returns
- Portfolio-level returns
- Tax lot information
For 1-3 positions, spreadsheets work fine. For 10+ positions through multiple assignments and rolls? It becomes error-prone and time-consuming.
The Automated Approach
Here’s where manual tracking breaks down: calculating your actual cost basis after assignment.
Let’s say you sold a $50 put, collected $2 premium, and got assigned. Your broker shows you bought 100 shares at $50 ($5,000 total). But your real cost basis is $48 per share ($4,800 total) after the $200 premium you collected.
You need to track this adjustment manually—through assignments, covered calls, rolls, and eventual exit—to know your real returns. One mistake and your entire P&L calculation is wrong.
This is exactly why platforms like QuantWheel exist. It automatically adjusts your cost basis when you get assigned, tracks full wheel cycles (CSP → assignment → covered call → exit), and calculates accurate returns without manual spreadsheet updates.
When you’re managing 15 positions and just got assigned on three of them, automatic tracking isn’t a luxury—it’s how you stay sane and accurate.
What Premium Should You Target?
There’s no “right” answer, but here’s a framework based on risk tolerance.
Conservative Approach (0.10-0.20 Delta)
Target premium: 1-2% per month (12-24% annually) Best for: Traders who want steady income on stocks they’re comfortable owning
Assignment frequency: Low (10-20% of positions)
Balanced Approach (0.20-0.30 Delta)
Target premium: 2-3% per month (24-36% annually) Best for: Experienced wheel traders with active position management
Assignment frequency: Moderate (20-30% of positions)
Aggressive Approach (0.30-0.40 Delta)
Target premium: 3-5%+ per month (36-60%+ annually) Best for: Traders comfortable with frequent assignments and drawdowns
Assignment frequency: High (30-40%+ of positions)
Most successful wheel traders operate in the balanced zone: targeting 2-3% monthly returns with selective aggression during high-IV opportunities.
| Approach | Delta | Monthly Target | Annualized | Assignment Frequency |
|---|---|---|---|---|
| Conservative | 0.10–0.20 | 1–2% | 12–24% | 10–20% of positions |
| Balanced | 0.20–0.30 | 2–3% | 24–36% | 20–30% of positions |
| Aggressive | 0.30–0.40 | 3–5%+ | 36–60%+ | 30–40%+ of positions |
Improving Your Cash Secured Put Returns
Strategy #1: Sell During High IV, Stay Patient During Low IV
Don’t force trades when premium is thin. Wait for IV expansion (market dips, uncertainty, earnings approaches) to get better premium.
Strategy #2: Target Quality Over Premium
A 2% premium on a stock you’d happily own beats a 5% premium on a deteriorating company. Quality stocks recover from dips; bad stocks don’t.
Strategy #3: Close Early at 50% Profit
Many thetagang traders close CSPs when they’ve captured 50% of max profit with significant time remaining. This frees capital to open new positions and reduces exposure to late-cycle volatility.
Strategy #4: Roll Down and Out When Threatened
If a position goes against you, rolling down and out (lower strike, later expiration) can collect additional premium while giving the stock more time to recover.
See: How to roll a cash-secured put →
Strategy #5: Size Positions Appropriately
Don’t put 20% of your portfolio on a single CSP. Diversify across multiple uncorrelated stocks to reduce concentrated risk.
Strategy #6: Use Professional Tracking
Once you’re beyond 5-10 positions, automated tracking saves time and reduces errors. QuantWheel’s position tracking and automatic cost basis adjustment eliminates the spreadsheet headache.
Real-World Cash Secured Put Return Examples
Example 1: Conservative Dividend Stock (Hypothetical — for illustration only)
Stock: Johnson & Johnson (JNJ)
Premium environment: Low IV (25%)
Strategy: 0.15 delta, 45 DTE
Premium collected: $1.80 per contract on $165 strike
Return: 1.09% per 45 days (~9% annualized)
Assignment risk: Low
Outcome over 12 months: 11 successful CSPs, 1 assignment (stock recovered, wheeled successfully)
Annual return: 14.2%
Example 2: Moderate Growth Stock (Hypothetical — for illustration only)
Stock: AMD
Premium environment: Medium IV (45%)
Strategy: 0.25 delta, 35 DTE
Premium collected: $3.50 per contract on $110 strike
Return: 3.18% per 35 days (~33% annualized)
Assignment risk: Moderate
Outcome over 12 months: 7 successful CSPs, 3 assignments (2 wheeled successfully, 1 resulted in small loss)
Annual return: 22.7%
Example 3: High IV Aggressive Play (Hypothetical — for illustration only)
Stock: High-volatility tech name (example)
Premium environment: High IV (75%)
Strategy: 0.35 delta, 21 DTE
Premium collected: $7.00 per contract on $85 strike
Return: 8.2% per 21 days (~143% annualized)
Assignment risk: Very high
Outcome over 12 months: 4 successful CSPs, 8 assignments (3 wheeled successfully, 5 resulted in losses)
Annual return: 8.3% (high premiums couldn’t offset assignment losses)
Lesson: Annualized returns from individual trades mean nothing. What matters is portfolio-level actual returns after all wins and losses.
Tax Implications for Cash Secured Put Returns
Short-Term vs Long-Term
Premium collected from CSPs that expire or are closed is taxed as short-term capital gains (ordinary income rates), per IRS Publication 550 — Investment Income and Expenses.
If you get assigned and hold shares for 12+ months before selling, those gains may qualify as long-term capital gains at lower rates under IRS Topic No. 409 — Capital Gains and Losses.
Wash Sale Complications
Selling puts on a stock where you recently sold shares at a loss can trigger wash sale rules, disallowing the loss deduction.
The IRS defines the wash sale window as 30 days before or after the sale — see IRS Publication 550, Wash Sales section for the exact rules.
Record Keeping Is Critical
Track every trade: date opened, premium collected, date closed/assigned, and adjusted cost basis.
Per IRS Form 8949 instructions, every options transaction must be reported individually with accurate cost basis.
Professional options tracking platforms that auto-log all trades with adjusted cost basis significantly reduce errors at tax time.
Is It Worth It? Evaluating Cash Secured Put Returns
Compare to Alternatives
Buy-and-hold SPY: ~10% annually (historical average) CSP strategy (conservative): 12-18% annually CSP strategy (moderate): 20-30% annually CSP strategy (aggressive): Highly variable (0-40%+)
You’re adding 5-15% extra annual return compared to passive investing, but with significantly more time commitment and active management.
The Time Investment Factor
If you’re spending 5-10 hours per week managing CSPs to earn an extra 10% annually on a $50,000 portfolio ($5,000 extra), that’s roughly $10-20/hour for your time.
Is that worth it? Depends on your goals, interest in trading, and opportunity cost.
Final Thoughts on Cash Secured Put Returns
The difference between successful CSP traders earning 25% annually and unsuccessful ones breaking even or losing money comes down to:
- Stock selection (quality matters more than premium)
- Position sizing (don’t overextend)
- Disciplined management (close winners early, manage losers actively)
- Accurate tracking (know your real cost basis and returns)
Find safe Cash – Secured puts with QuantWheel →
Risk Disclosure
Options trading involves substantial risk and is not suitable for all investors. Past performance does not guarantee future results. This content is for educational purposes only and should not be considered investment advice. Always do your own research and consider consulting with a financial advisor before making investment decisions.
The examples used in this article are for educational purposes only and are not recommendations to buy or sell any security. All investment decisions should be based on your own analysis and risk tolerance.