You sold your first cash-secured put, collected $100 in premium, and now you're wondering: what's my actual return? Your broker shows the dollar amount, but calculating the percentage return—and more importantly, the annualized return—requires understanding the math that most traders get wrong.
Here's the problem: calculating returns on cash-secured puts isn't as straightforward as buying and selling stock. You need to account for capital requirements, time decay, potential assignment, and cost basis adjustments.
Track your CSPs inside QuantWheel →
This guide breaks down exactly how to calculate your return on cash-secured puts, from basic formulas to advanced considerations like annualized returns and assignment scenarios. Whether you're tracking one position or managing a full wheel strategy portfolio, you'll learn the math that actually matters.
TLDR: Calculate Cash Secured Put Returns (Simple Version)
Basic Formula:
- Return (%) = (Premium Collected ÷ Capital Required) × 100
- Capital Required = Strike Price × 100 shares
Simple Example: You sell 1 cash-secured put on a $50 stock with a $50 strike price and collect $2.00 premium ($200 total):
- Capital required: $50 × 100 = $5,000
- Premium collected: $200
- Simple return: ($200 ÷ $5,000) × 100 = 4%
- Days to expiration: 45 days
- Annualized return: (4% × 365) ÷ 45 = 32.4%
What Changes with Assignment: If you get assigned at the $50 strike after collecting $2 premium:
- Your real stock cost: $50 - $2 = $48 per share
- Your breakeven: $48 (not $50)
- This matters for covered call returns later
Key Takeaway: A 2-3% return per trade doesn't sound impressive until you annualize it over 30-45 days—that's when you see the real power of consistent premium collection. Most traders forget to annualize and underestimate their actual performance.
Understanding the Components of Cash Secured Put Returns
Before calculating returns, you need to understand what goes into a cash-secured put trade.
What Is a Cash-Secured Put?
A cash-secured put (CSP) is an options strategy where you sell a put option while holding enough cash in your account to buy 100 shares of the underlying stock if assigned. You collect a premium upfront, and that premium is yours to keep regardless of what happens.
The three possible outcomes:
- Expires worthless (stock above strike): Keep premium, full profit
- Closed early (stock above strike): Keep partial premium, reduced profit
- Assigned (stock below strike): Buy stock at strike, premium reduces cost basis
The Four Key Numbers You Need
Every cash-secured put return calculation requires these inputs:
- Strike Price: The price you agree to buy the stock ($50, $100, etc.)
- Premium Collected: The cash you receive for selling the put ($2.00, $3.50, etc.)
- Capital Required: Strike price × 100 shares (usually equals collateral held)
- Days to Expiration: How long until the option expires (30, 45, 60 days, etc.)
Many brokers use margin calculations that can reduce capital requirements below strike × 100, but for conservative cash-secured put calculations, we use the full strike value.
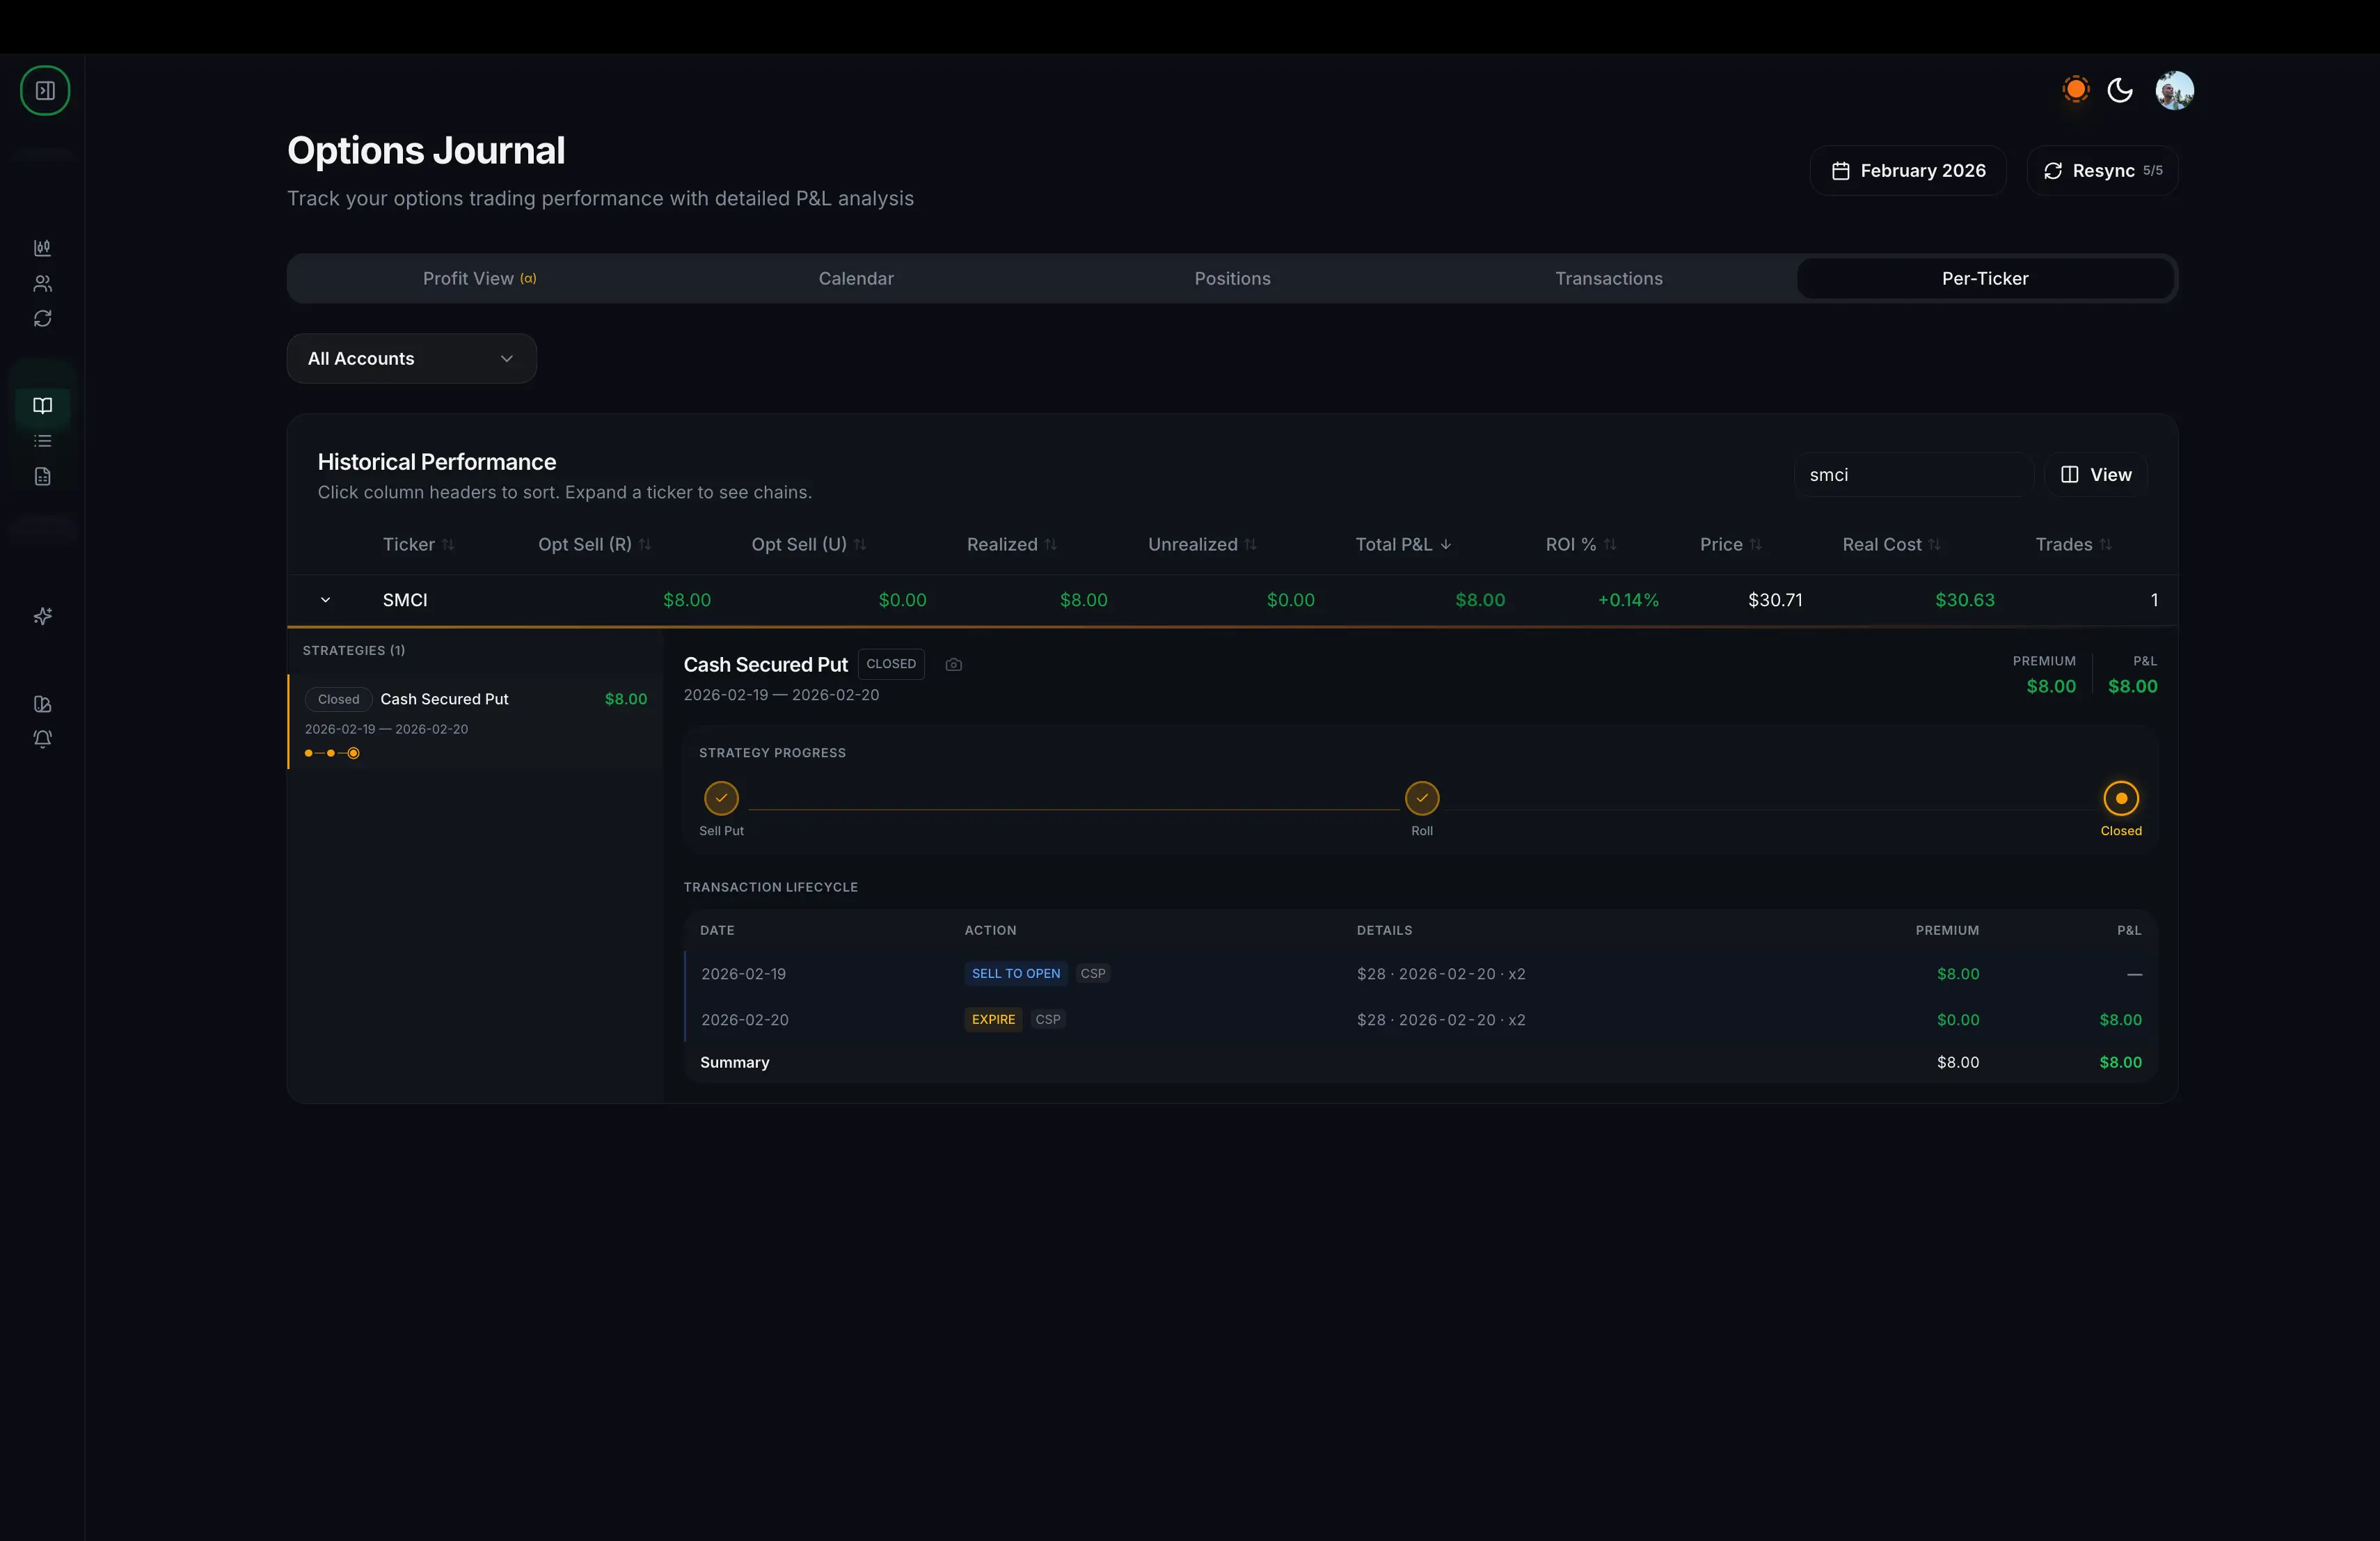
Here's a real example. This is what a $SMCI cash-secured put trade looks like inside the journal — and notice how you don't have to calculate anything yourself. Your new cost basis and true net cost are already there, adjusted for the premium you collected.
The Basic Return Formula (Simple Return)
The simplest way to calculate your return on a cash-secured put trade:
Formula:
Simple Return (%) = (Premium Collected ÷ Capital Required) × 100
Where:
- Premium Collected = Price per share × 100 shares (e.g., $2.00 × 100 = $200)
- Capital Required = Strike price × 100 shares (e.g., $50 × 100 = $5,000)
Example 1: Basic CSP Return
You sell a cash-secured put on XYZ:
- Strike price: $50
- Premium collected: $2.00 per share ($200 total)
- Capital required: $50 × 100 = $5,000
Calculation:
- Simple return = ($200 ÷ $5,000) × 100 = 4.0%
This means you earned 4% on the capital you committed to this trade.
Example 2: Higher Premium CSP
You sell a put on a high-volatility stock:
- Strike price: $100
- Premium collected: $5.00 per share ($500 total)
- Capital required: $100 × 100 = $10,000
Calculation:
- Simple return = ($500 ÷ $10,000) × 100 = 5.0%
The higher implied volatility (IV) generated a higher premium, resulting in a better return percentage.
Annualized Return: The Metric That Actually Matters
A 4% return sounds modest until you realize you earned it in just 30 days. Annualizing your returns lets you compare cash-secured puts to other investments fairly.
Why Annualize?
Stocks typically return 8-10% per year. If your CSP strategy generates 3% every 45 days, you need to annualize to see you're actually earning much more than buy-and-hold.
Without annualization: "I only made 3% this month" With annualization: "I'm on pace for 24% annual returns"
Annualized Return Formula:
Annualized Return (%) = (Simple Return × 365) ÷ Days to Expiration
Example 3: 30-Day CSP Annualized
- Strike: $50
- Premium: $1.50 ($150)
- Capital: $5,000
- Days to expiration: 30
Step 1: Calculate simple return
- Simple return = ($150 ÷ $5,000) × 100 = 3%
Step 2: Annualize
- Annualized return = (3% × 365) ÷ 30 = 36.5%
That 3% monthly return annualizes to 36.5%—now you can see the real potential.
Example 4: 45-Day CSP Annualized
- Strike: $75
- Premium: $2.25 ($225)
- Capital: $7,500
- Days to expiration: 45
Calculations:
- Simple return = ($225 ÷ $7,500) × 100 = 3%
- Annualized return = (3% × 365) ÷ 45 = 24.3%
Same 3% simple return, but the longer timeframe reduces the annualized percentage. This is why shorter-duration trades can be more efficient.
Return on Capital vs Return on Cash
Understanding what "capital required" means can change your calculation significantly.
Cash-Secured (Full Capital)
In a true cash-secured put, you set aside the full strike × 100 shares:
- Strike: $50
- Full capital held: $5,000
- Premium: $200
- Return on full capital: 4%
Margin-Based (Partial Capital)
If you're using portfolio margin or reduced capital requirements, your broker might only require 20-30% of the strike value:
- Strike: $50
- Margin requirement: $1,500 (30%)
- Premium: $200
- Return on margin: ($200 ÷ $1,500) × 100 = 13.3%
Important: While margin-based returns look better mathematically, they also increase leverage and risk. For wheel strategy purposes, calculating returns on full cash-secured capital gives you a conservative, sustainable view of performance.
Calculating Returns When Assigned
Getting assigned on a cash-secured put isn't a failure—it's often part of the plan in wheel strategy trading. But assignment changes how you calculate total returns.
What Happens at Assignment
When your put expires in-the-money (ITM), you're assigned:
- You buy 100 shares at the strike price
- Your account is debited strike × 100
- You keep the premium you collected when you sold the put
Here's the critical part: The premium you collected effectively reduces your cost basis.
Cost Basis Adjustment Formula:
Adjusted Cost Basis = Strike Price - Premium Per Share
Example 5: Assignment Scenario
You sold a $50 strike put for $2.00 premium and got assigned:
At assignment:
- You pay: $50 × 100 = $5,000
- You previously collected: $200
- Your net cost: $5,000 - $200 = $4,800
- Your real cost basis: $48 per share (not $50)
This $48 cost basis is crucial for:
- Calculating your breakeven
- Setting covered call strikes
- Measuring total wheel cycle returns
- Tax reporting accuracy
Why Brokers Get This Wrong
Most brokers will show your cost basis as $50 per share (the price you paid at assignment), not $48 (your real cost after premium). This makes tracking your actual performance difficult and can cause you to:
- Overestimate losses
- Underestimate profits
- Pay more taxes than necessary
- Make poor decisions on covered call strikes
Here's where manual tracking becomes a problem. If you're managing 10+ wheel positions in spreadsheets, calculating and maintaining adjusted cost basis for each assignment is tedious and error-prone. That's when platforms like QuantWheel become essential—the journal automatically adjusts your cost basis when assignments happen, so your real breakeven is always accurate.
Complete Wheel Cycle Return Calculation
The wheel strategy involves multiple stages: selling cash-secured puts, getting assigned, selling covered calls, and exiting. To calculate your TRUE return, you need to track the entire cycle.
The Full Wheel Cycle
Stage 1: Cash-Secured Put
- Sell $50 strike put
- Collect $2.00 premium ($200)
Stage 2: Assignment
- Buy 100 shares at $50
- Adjusted cost basis: $48/share
Stage 3: Covered Calls
- Sell $52 strike call for $1.50 premium ($150)
- If called away, you sell shares at $52
Stage 4: Exit
- Shares sold at $52
- Total profit calculation needed
Example 6: Complete Wheel Cycle Return
Cash-Secured Put:
- Sold $50 put for $2.00 ($200)
- Capital required: $5,000
- CSP simple return: 4%
Assignment:
- Bought 100 shares at $50 (paid $5,000)
- Real cost basis: $48/share ($4,800 total)
Covered Call:
- Sold $52 call for $1.50 ($150)
- Called away at $52 (received $5,200)
Total Profit:
- CSP premium: $200
- Covered call premium: $150
- Capital gain: $5,200 (sale) - $5,000 (purchase) = $200
- Total profit: $550
Total Return Calculation:
- Total profit: $550
- Initial capital: $5,000
- Simple return: ($550 ÷ $5,000) × 100 = 11%
- Total cycle duration: 90 days
- Annualized return: (11% × 365) ÷ 90 = 44.6%
Notice how tracking the full cycle—including both premiums and the capital gain—gives you the complete picture. Many traders only track individual leg returns and miss the total performance.
Advanced Considerations for Return Calculations
1. Early Assignment Impact
If you're assigned early (before expiration), your time-based return changes:
Original plan:
- 45-day trade
- Expected annualized return: 32%
Early assignment at day 30:
- Actual duration: 30 days
- New annualized return: (4% × 365) ÷ 30 = 48.7%
Early assignment can actually improve your annualized return by shortening the trade duration, though it also means you now own shares.
2. Rolling Impact on Returns
When you roll a cash-secured put (close current position, open new one at different strike/date), you need to calculate the NET credit/debit:
Roll scenario:
- Original put: $50 strike, 30 DTE, collected $2.00
- Stock drops to $48
- Close original put: Pay $3.00 to close (loss of $1.00)
- Open new put: $48 strike, 45 DTE, collect $2.50
Net on roll:
- Closed for: -$300
- Opened for: +$250
- Net roll credit: -$50 (cost $50 to roll)
Total return calculation:
- Original premium: $200
- Roll cost: -$50
- Net premium: $150
- New capital required: $4,800 ($48 strike)
- Return to date: ($150 ÷ $4,800) × 100 = 3.1%
Rolling complicates return calculations because you're essentially modifying an open trade. Tracking rolls manually across multiple positions becomes very challenging.
3. Dividend Impact
If you get assigned on a dividend-paying stock, include dividends in your total return:
Scenario:
- Assigned at $50 strike ($2 premium collected)
- Real cost basis: $48
- Held for 60 days
- Collected $0.50/share dividend ($50 total)
Total benefit:
- Premium: $200
- Dividend: $50
- Total: $250
- Return: ($250 ÷ $5,000) × 100 = 5%
Tools for Calculating CSP Returns
Manual Spreadsheet Method
Pros:
- Complete control
- Free
- Customizable
Cons:
- Time-consuming (15-30 minutes per week)
- Error-prone with multiple positions
- Doesn't auto-update with broker data
- Cost basis tracking breaks with assignments
- Rolling calculations get messy
Best for: 1-3 active positions
Broker Platform Tools
Pros:
- Shows basic P&L
- Free with account
- Real-time updates
Cons:
- No percentage return calculations
- No annualized return tracking
- Doesn't adjust cost basis on assignment
- No full wheel cycle tracking
- Limited historical analysis
Best for: Checking current position values
Specialized Options Tracking Platforms
Professional platforms like QuantWheel are built specifically for wheel strategy traders:
Features that matter for return calculations:
- Automatic cost basis adjustment on assignment
- Real-time percentage and annualized return tracking
- Full wheel cycle performance measurement
- Roll tracking with net credit calculations
- Portfolio-level aggregated returns
- Tax-ready reporting with accurate cost basis
Here's the advantage: when you're managing 15 wheel positions and three of them get assigned this month, manual tracking becomes a nightmare. QuantWheel's journal automatically adjusts your cost basis when assignments happen, calculates your actual returns through complete cycles, and shows you exactly how each position is performing—without the spreadsheet headaches.
Common Mistakes in CSP Return Calculations
Mistake 1: Forgetting to Annualize
Wrong: "I made 3% this month, not great" Right: "I made 3% in 30 days, that's 36.5% annualized"
Without annualization, you can't compare CSP returns to other investments.
Mistake 2: Using Wrong Capital Base
Wrong: Calculating return on entire portfolio ($50,000 account, $5,000 position = $200/$50,000 = 0.4%) Right: Calculating return on capital committed to the trade ($200/$5,000 = 4%)
Use the capital required for THIS trade, not your entire account balance.
Mistake 3: Ignoring Cost Basis on Assignment
Wrong: "I got assigned at $50, my cost is $50" Right: "I got assigned at $50 after collecting $2 premium, my real cost is $48"
This $2 difference affects every subsequent decision in the wheel cycle.
Mistake 4: Not Tracking Complete Cycles
Wrong: Tracking each leg separately (CSP: 4%, CC: 3%, capital gain: 4%) Right: Tracking total cycle return (all premiums + capital gain vs initial capital = 11%)
Your total return is what matters, not individual leg performance.
Mistake 5: Comparing Simple Returns Across Different Durations
Wrong: Comparing 3% on 30-day trade to 4% on 60-day trade and choosing the 60-day Right: Comparing 36.5% annualized to 24.3% annualized and choosing the 30-day
Always annualize before comparing trades with different durations.
How to Use Return Data to Make Better Decisions
Once you can accurately calculate returns, use that data to optimize your strategy:
1. Compare Stocks
Which stocks consistently offer better risk-adjusted returns?
- Track return per trade by ticker
- Calculate average annualized return
- Consider win rate and assignment frequency
- Focus on repeatable opportunities
2. Optimize Strike Selection
Do closer strikes (higher delta) or further strikes (lower delta) generate better returns?
- 20-delta puts: Lower return per trade, higher win rate
- 40-delta puts: Higher return per trade, more assignments
- Track which generates better annualized returns for YOUR risk tolerance
3. Choose Optimal Duration
Should you sell 30-day, 45-day, or 60-day puts?
- Shorter duration: Higher annualized returns, more management
- Longer duration: Lower annualized returns, less management
- Calculate your actual return by expiration cycle
4. Set Performance Benchmarks
Establish what "good" looks like for your strategy:
- Target: 2-3% per trade
- Annualized target: 24-36%
- Win rate target: 70-80%
- Assignment rate: 20-30% of trades
If you're consistently below these benchmarks, something needs adjustment (strike selection, stock quality, timing).
Tracking Returns Across Multiple Positions
Managing a single cash-secured put is straightforward. But when you're running 10-20 positions in a full wheel strategy portfolio, return tracking becomes exponentially more complex:
Challenges at scale:
- Different strikes, premiums, and expirations
- Staggered assignments requiring individual cost basis tracking
- Multiple rolls with varying net credits
- Some positions closed for profits, others assigned
- Need for portfolio-level aggregated performance
This is where the spreadsheet typically breaks down. You end up spending an hour each week updating numbers, recalculating cost basis, and trying to figure out your actual total performance.
Professional wheel traders use platforms that automatically:
- Sync with your broker in real-time
- Calculate returns for each position automatically
- Aggregate portfolio-level performance
- Track cost basis through assignments
- Generate performance reports for taxes
Conclusion: Master the Math, Improve Your Results
Calculating return on cash-secured puts isn't just about satisfying curiosity—it's about making data-driven decisions that improve your trading performance.
Key takeaways:
- Use the basic formula: (Premium ÷ Capital) × 100 for simple returns
- Always annualize returns: (Simple Return × 365) ÷ Days to compare fairly
- Adjust cost basis on assignment: Strike - Premium = Real Cost Basis
- Track complete wheel cycles for true performance measurement
- Use the right tools to avoid manual tracking errors at scale
When you can accurately calculate and track returns, you can identify what's working, optimize your strike selection, choose better stocks, and ultimately generate more consistent income from your wheel strategy.
The traders who succeed long-term aren't the ones chasing the highest premium—they're the ones who know exactly what they're earning, why they're earning it, and how to replicate it.
Risk Disclosure
Options trading involves substantial risk and is not suitable for all investors. Past performance does not guarantee future results. This content is for educational purposes only and should not be considered investment advice. Always do your own research and consider consulting with a financial advisor before making investment decisions.
The examples used in this article are for educational purposes only and are not recommendations to buy or sell any security. All investment decisions should be based on your own analysis and risk tolerance. Individual results may vary significantly based on market conditions, execution, timing, and other factors.