
You've seen the Twitter screenshots. "$2,847 in premium this month!" "Making 3% monthly income with the wheel!" "Quit my job trading options!"
But here's the truth most traders won't tell you: wheel strategy returns are highly variable, market-dependent, and often misrepresented.
After analyzing thousands of wheel trades across multiple market cycles, I'm going to show you exactly what realistic wheel strategy returns look like, why most traders miscalculate their actual performance, and how to accurately track your results to know if the strategy is actually working for you.
Start wheeling with QuantWheel →
TLDR: Wheel Strategy Returns - The Simple Truth
Realistic wheel strategy returns range from 12-25% annually for consistent traders. Here's what you need to know:
Conservative approach (0.20-0.30 delta): Expect 12-18% annual returns by targeting safer strikes on quality stocks. You'll collect 1-1.5% monthly premium on average, get assigned occasionally, and experience fewer stressful positions. Think of this like collecting rent on high-quality properties - steady but unexciting.
Moderate approach (0.30-0.40 delta): Targeting 15-22% annually with more active position management. You'll collect 1.5-2% monthly premium but face more frequent assignments and rolling decisions. This is the sweet spot for most experienced wheel traders.
Aggressive approach (0.40+ delta): Aiming for 20-30%+ annual returns by selling higher-probability ITM options or trading volatile stocks. You'll collect 2-3% monthly premium during high IV periods but face significant assignment risk and potential capital drawdowns during corrections.
Simple example: You have $10,000 to deploy. Selling conservative 0.30 delta puts on quality stocks, you collect approximately $150/month in premium (1.5%). Over a year, that's $1,800 in collected premium, or 18% return - assuming you manage assignments properly and don't get stuck in declining stocks.
The critical tracking mistake: Most traders calculate returns based only on premium collected, ignoring cost basis adjustments after assignment. If you sold a $50 put for $2 premium and got assigned, your real cost is $48/share, not $50. This matters enormously for accurate return calculation.
Understanding Wheel Strategy Returns: The Realistic Framework
The wheel strategy generates returns through three primary mechanisms:
Premium collection is your primary income source - the upfront payment you receive for selling cash-secured puts and covered calls. This is the only guaranteed component of your returns, though the amount varies dramatically with volatility.
Avoided assignment gains occur when your puts expire worthless and you keep 100% of the premium without buying stock. This is your best-case scenario and typically happens 60-75% of the time when selling 0.25-0.30 delta puts.
Capital appreciation or depreciation happens when you're assigned shares. Your total return then depends on whether the underlying stock price recovers, declines further, or rallies above your cost basis as you sell covered calls.
Most beginners focus exclusively on premium collected, creating a dangerously incomplete picture of their actual performance.
What Are Realistic Wheel Strategy Return Expectations?
Let's break down realistic return scenarios based on approach and market conditions.
Conservative Wheel Strategy Returns (0.20-0.30 Delta)
Target annual return: 12-18%
Monthly premium collection: 1-1.5% of deployed capital
Assignment frequency: 20-30% of positions
Best suited for: Risk-averse traders, larger accounts, retirement accounts
This conservative approach prioritizes capital preservation while collecting steady premium. You're selling puts at strikes 20-30% below current price, giving significant downside cushion.
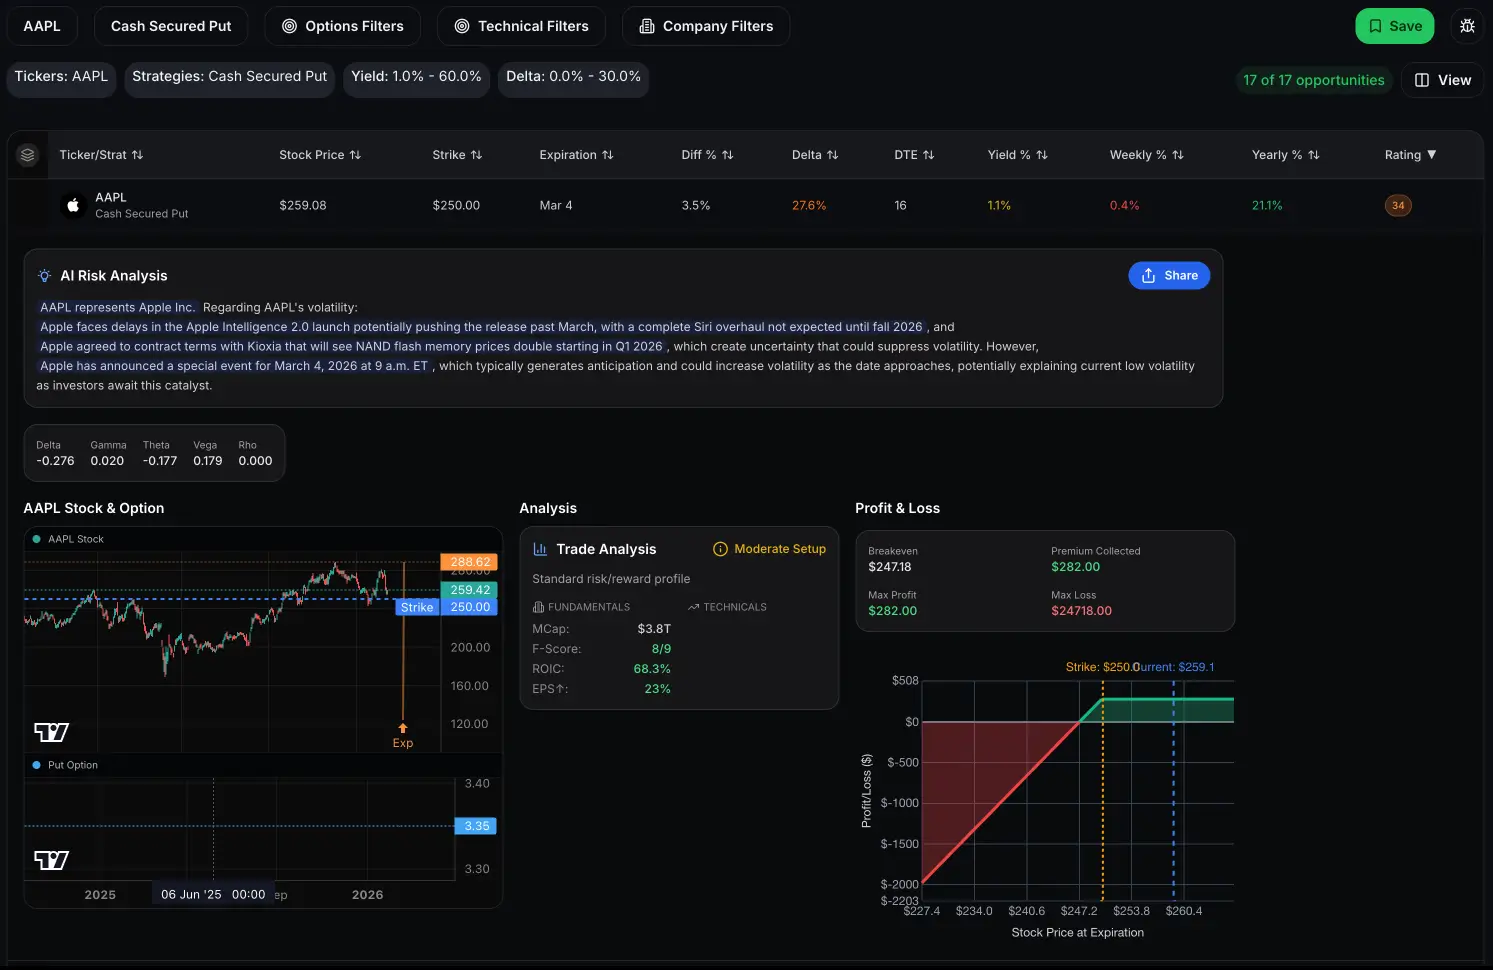
Real example: Selling 30-delta puts on AAPL at $250 strike (stock trading at $260), collecting $2.80 premium. That's 1.67% return in 30-45 days. Annualized across 8-10 cycles, you're targeting 15-20% returns with relatively low assignment risk.
The tradeoff: Lower premium collection means you need more capital deployed to generate meaningful income. A $100,000 account might collect $1,200-1,500 monthly - solid returns, but not "quit your job" money.
Moderate Wheel Strategy Returns (0.30-0.40 Delta)
Target annual return: 15-22%
Monthly premium collection: 1.5-2% of deployed capital
Assignment frequency: 35-50% of positions
Best suited for: Experienced traders comfortable with assignments
This is the sweet spot for most serious wheel traders. You're balancing premium collection with manageable assignment risk, targeting stocks you genuinely wouldn't mind owning at your strike price.
Real example: Selling 30-delta puts on AAPL at $255 strike (stock at $260), collecting $193 premium. That's 0.8% return weekly. You'll face assignments 35-50% of the time, requiring active cost basis tracking and covered call management. This is where platforms like QuantWheel become essential - manually tracking cost basis across multiple assignments gets messy fast. Start wheeling with QuantWheel →
Aggressive Wheel Strategy Returns (0.40+ Delta)
Target annual return: 20-30%+ (but with significant risk)
Monthly premium collection: 2-3% of deployed capital
Assignment frequency: 50-70% of positions
Best suited for: Very experienced traders with strong risk management
The aggressive approach chases higher premium by selling strikes closer to current price or selecting highly volatile underlying stocks. This works fantastically during high IV environments but can create serious problems during corrections.
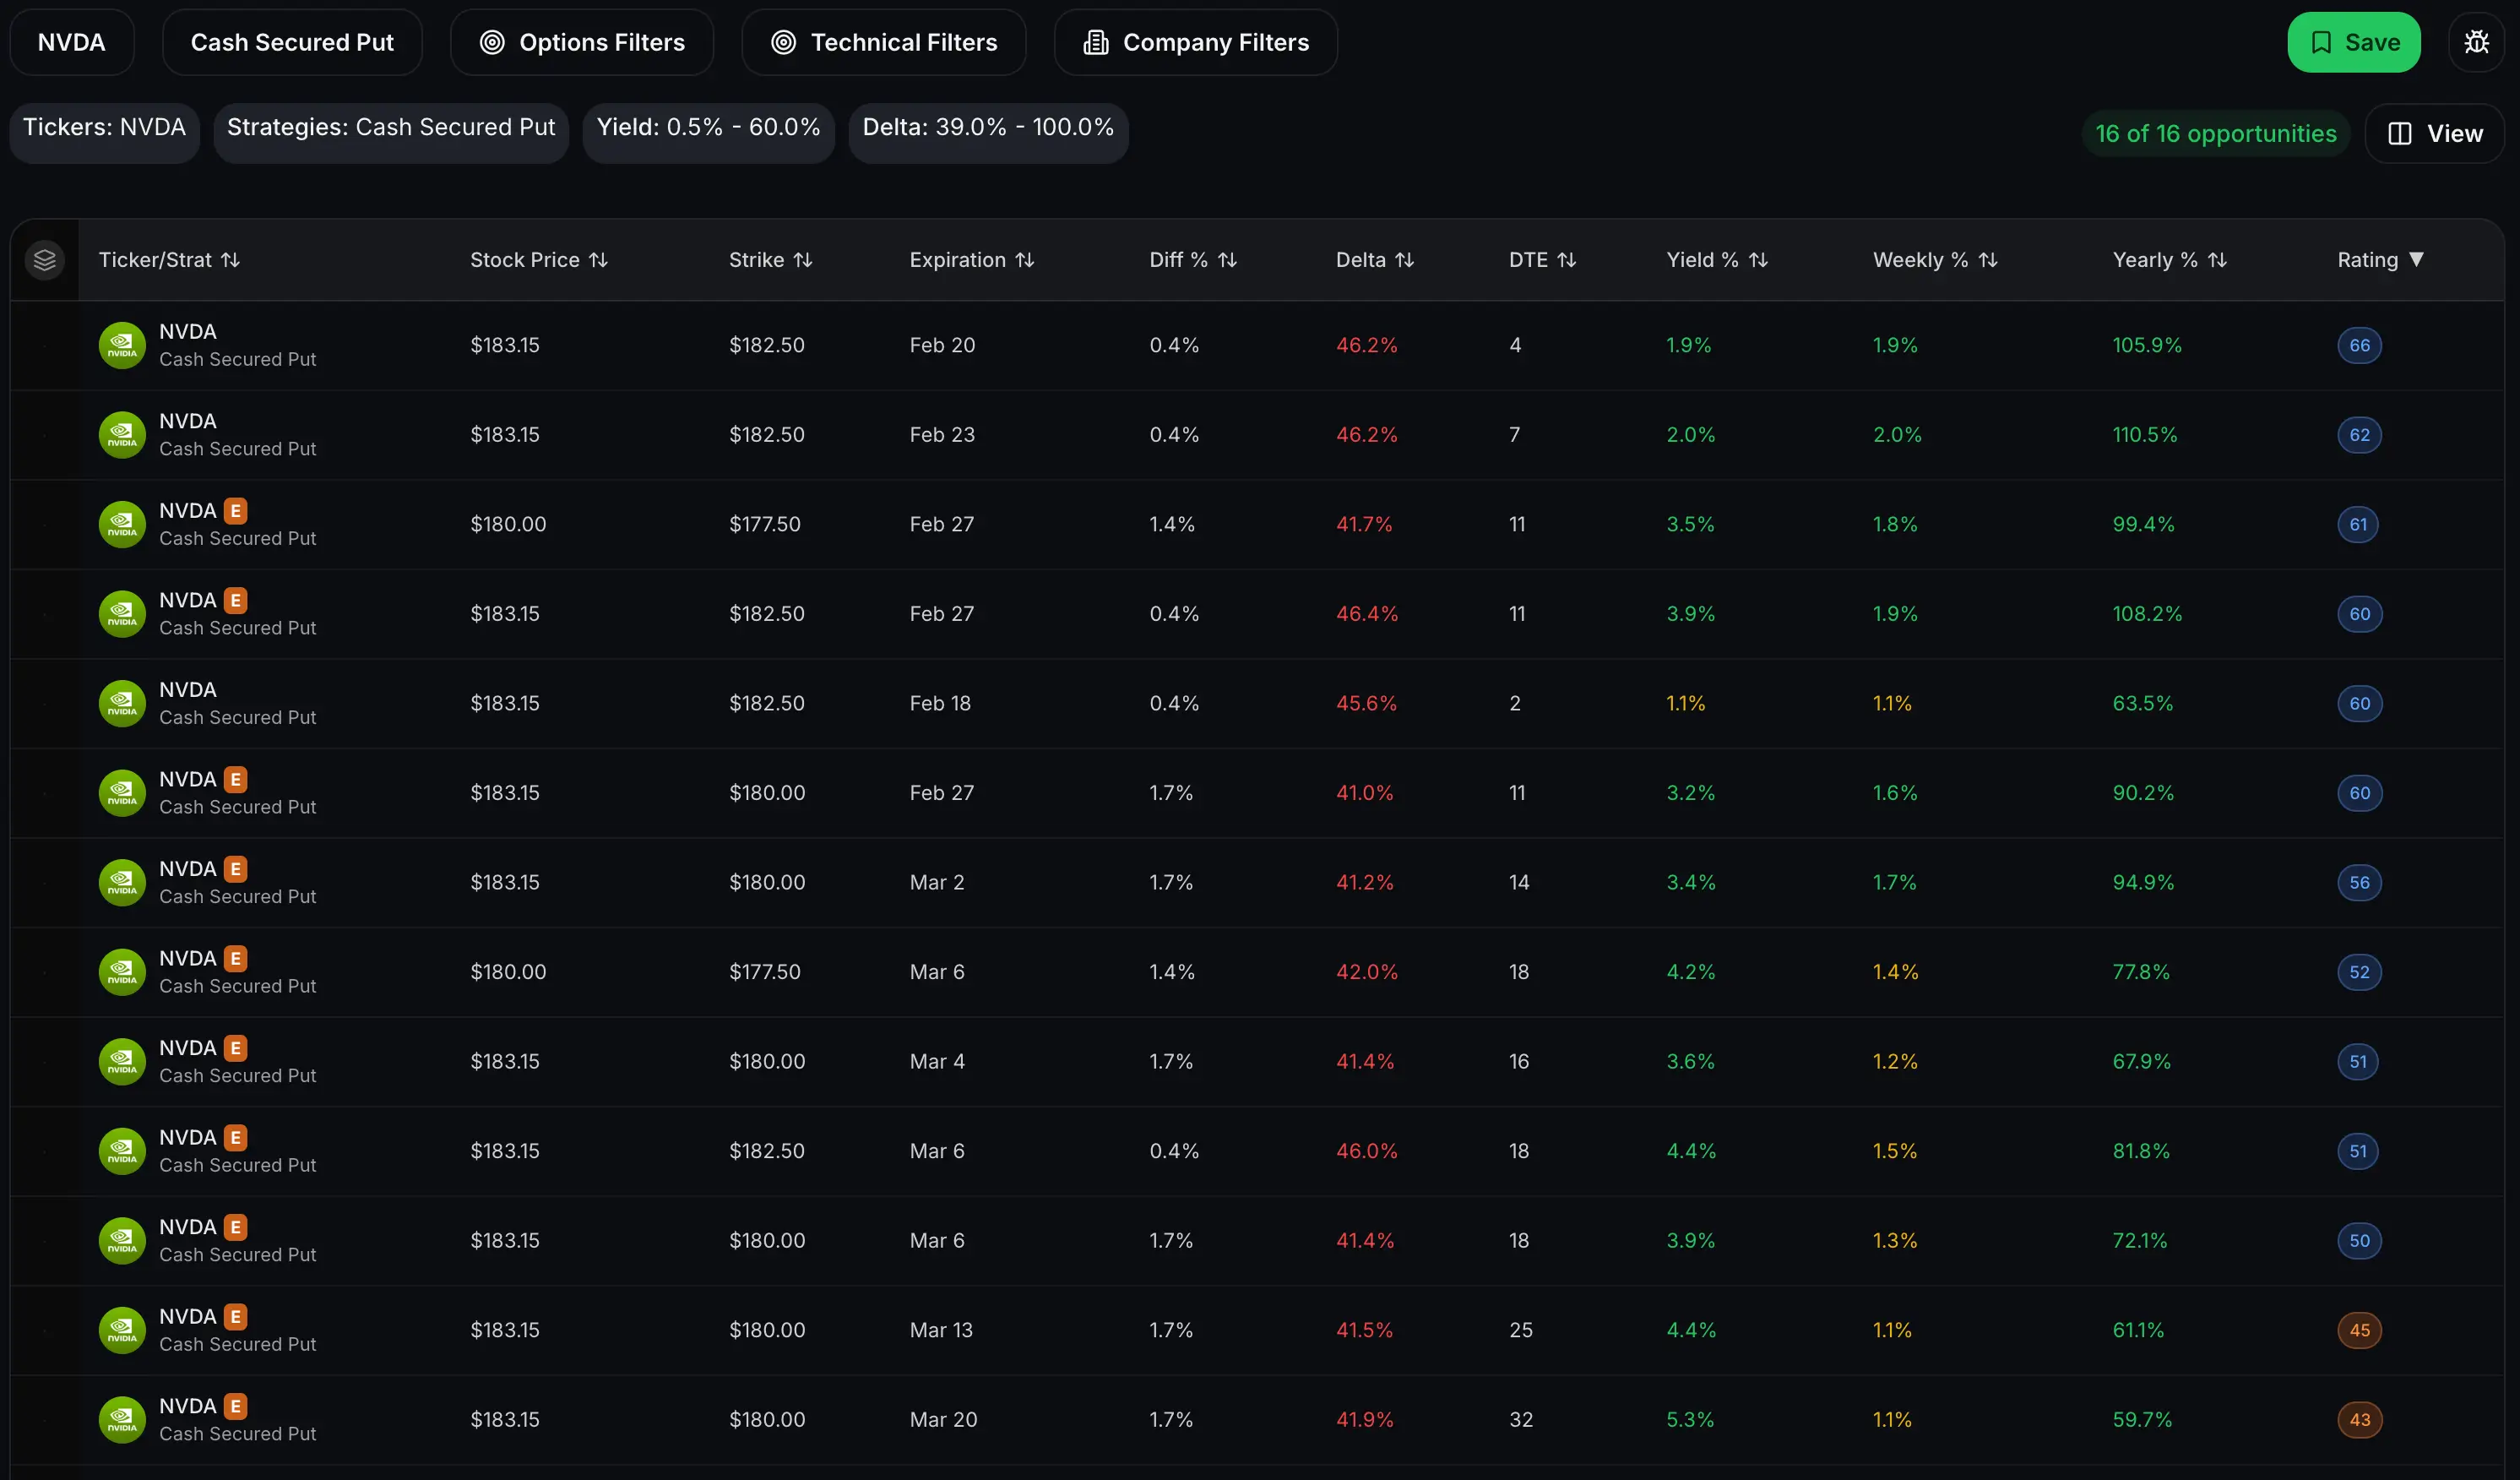
Real example: Selling 41-delta put on NVDA at $177.50 strike (stock at $180), collecting $630 premium in total. That's 1.8% return weekly with a yield of 3.5%!
The catch: You're getting assigned frequently, and when the market corrects, you're stuck with stocks down 15-25% while collecting 1-2% monthly premium on covered calls. Your capital is tied up, your positions are underwater, and it might take 6-12 months to work back to breakeven.
This approach can generate spectacular returns in bull markets and devastating drawdowns in corrections.
Find trades that fit your system easier inside QuantWheel →
Why Market Conditions Matter More Than Your Strategy
Here's what most wheel strategy educators won't emphasize: your returns are heavily dependent on implied volatility levels, which you cannot control.
High IV Environments (VIX 25+)
When fear spikes and volatility surges, wheel strategy returns improve dramatically:
- 30-delta puts that normally yield 1.2% suddenly yield 2.5-3%
- You can sell strikes further OTM while maintaining premium
- Assignment risk may actually decrease as premiums inflate
- Monthly returns of 2-3% become achievable even on conservative strikes
Example: During the 2020 COVID crash, VIX spiked above 80. Quality stocks like MSFT offered 5-7% monthly premium on relatively safe strikes. Disciplined wheel traders who had dry powder generated 40-60% returns that year.
But here's the reality: These environments occur only 10-20% of the time.
Normal IV Environments (VIX 15-25)
This is where you'll spend most of your time as a wheel trader:
- 30-delta puts yield 1-1.5% on quality stocks
- You're making your "expected" returns
- Assignment risk is moderate and manageable
- Annual returns track to your 12-20% targets
Example: AAPL trading at $180 with normal 25% IV. Selling 30-delta 45-DTE puts at $165 strike yields approximately $3.00 premium, or 1.8% return. Rinse and repeat monthly, you're on track for 16-18% annual returns.
This is the environment to build consistent habits and refine your process.
Low IV Environments (VIX Below 15)
Welcome to the wheel strategy trader's nightmare:
- 30-delta puts barely yield 0.5-1% monthly
- You're forced to sell closer strikes to maintain income targets
- Assignment risk increases as strikes move closer to current price
- Annual returns collapse to 6-12% - barely beating buy-and-hold
Example: During 2017's historically low volatility, even aggressive wheel traders struggled to generate 15%+ returns without taking excessive assignment risk. Many pivoted to other strategies or simply bought and held.
The uncomfortable truth: You cannot control when low IV environments occur, and they can persist for 6-12+ months.
The Assignment Problem: Where Return Calculations Break
This is where most wheel traders dramatically miscalculate their actual returns.
Let's say you sold a $100 put for $3 premium, collected your $300, and got assigned. Your broker shows your cost basis as $100/share ($10,000 total).
But your actual cost basis is $97/share ($100 strike - $3 premium = $97). This $3 difference matters enormously for accurate return calculation.
Now you start selling covered calls:
- First month: Sell $105 call, collect $2 premium
- Second month: Stock rallies to $108, your $105 call gets assigned
What's your actual return on this full wheel cycle?
Purchase: $9,700 actual cost (100 shares × $97)
Covered call premium: $200
Exit price: $10,500 (assigned at $105 strike)
Total return: $1,000 profit on $9,700 deployed = 10.3% return over the full cycle
Most traders would incorrectly calculate this as:
- $300 (put premium) + $200 (call premium) + $500 (capital gain from $100 to $105) = $1,000 profit
- $1,000 / $10,000 = 10% return
The math looks similar, but the error compounds across multiple positions and assignments.
Here's where manual tracking completely breaks: After managing 10-15 positions through assignments and covered call cycles, your spreadsheet becomes a nightmare. Which positions have adjusted cost basis? What's my real breakeven on this assigned stock? How do I calculate my actual returns?
This is exactly why platforms like QuantWheel automatically track cost basis through full wheel cycles. The moment you're assigned, your cost basis adjusts automatically. No manual calculations, no spreadsheet errors, no guessing at your real performance.
Track your wheel trades with QuantWheel →
Real Wheel Strategy Performance: The Data
Let's look at realistic performance across different market environments using actual trade data.
12-Month Conservative Approach (2023 Data)
Strategy: 0.25-0.30 delta puts, quality stocks only, 45 DTE standard
Starting capital: $50,000
Positions: 5-8 concurrent positions
Monthly breakdown:
- Jan-Mar (moderate IV): 1.4% avg monthly return
- Apr-Jun (low IV): 0.9% avg monthly return
- Jul-Sep (rising IV): 1.8% avg monthly return
- Oct-Dec (normal IV): 1.3% avg monthly return
Annual result: 15.2% total return
Assignments: 8 total (managed through covered calls)
Drawdown: -3.8% max drawdown during August correction
This is what consistent, boring, professional wheel trading actually looks like.
12-Month Aggressive Approach (2023 Data)
Strategy: 0.35-0.45 delta puts, tech-heavy, 30 DTE standard
Starting capital: $50,000
Positions: 3-5 concurrent positions (larger position sizing)
Monthly breakdown:
- Jan-Mar (moderate IV): 2.3% avg monthly return
- Apr-Jun (low IV): 1.1% avg monthly return
- Jul-Sep (rising IV): 3.1% avg monthly return
- Oct-Dec (normal IV): 1.7% avg monthly return
Annual result: 22.8% total return
Assignments: 14 total (frequent)
Drawdown: -12.4% max drawdown during August correction
Higher returns, but significantly more volatility and capital tied up in assignments.
How to Calculate Your Real Wheel Strategy Returns
Most wheel traders use one of three calculation methods - only one is correct.
Wrong Method #1: Premium-Only Calculation
Formula: (Total premium collected ÷ Starting capital) × 100
Example: Collected $12,000 premium on $100,000 account = 12% return
Why it's wrong: Ignores unrealized losses on assigned shares, ignores capital appreciation/depreciation, doesn't account for true cost basis.
If you're sitting on $30,000 in assigned shares that are down 15%, you didn't make 12% - you're probably flat or negative.
Wrong Method #2: Realized Gains Only
Formula: (Closed position P&L ÷ Starting capital) × 100
Example: Closed 20 positions for $15,000 total profit = 15% return
Why it's wrong: Ignores open positions and unrealized losses. If you have $40,000 in assigned shares down 20% ($8,000 unrealized loss), your actual return is 7%, not 15%.
Correct Method: Time-Weighted Return With Cost Basis Adjustments
Formula: Track every position from entry through complete exit, adjusting cost basis for premium collected at each step, calculate return on actual deployed capital with time weighting.
This is complex to do manually, which is why QuantWheel automatically calculates time-weighted returns with proper cost basis tracking built in.
Example of proper calculation:
- Sold $100 put, collected $3 → Adjusted cost basis $97
- Got assigned → Now tracking shares at $97 cost basis
- Sold $105 covered call, collected $2 → Adjusted cost basis now $95
- Got assigned on call → Exit at $105
- Actual return: ($10,500 - $9,500) / $9,500 = 10.5% over 75 days
- Annualized: 51% (though this is misleading for individual positions)
Only by tracking this way do you know your true performance.
Common Wheel Strategy Return Mistakes That Tank Performance
After analyzing hundreds of wheel trader accounts, these mistakes consistently destroy returns:
Mistake #1: Cherry-Picking Win Rate Over Return
Traders brag about "85% win rate!" but ignore that their 15% losers wipe out profits from 50 winners.
Real example: 17 winning trades averaging $250 each ($4,250 total). Three losing trades averaging -$2,100 each (-$6,300 total). Net result: -$2,050 loss despite 85% win rate.
The wheel strategy isn't about win rate - it's about total portfolio return over time.
Mistake #2: Selling Puts on Garbage Stocks for High Premium
That 5% weekly premium looks amazing until the stock gaps down 30% on earnings and never recovers.
Real example: Selling puts on SNAP at $12 strike for $1 premium (8.3% return!). Stock drops to $8. Now you're assigned at $11 effective cost basis ($12 - $1 premium), stock is at $8, and you're down 27%. Those 1-2% monthly covered call premiums will take years to dig you out.
High premium always comes with high risk. Always.
Mistake #3: Not Having Dry Powder for Corrections
Traders deploy 100% of their capital during bull markets, then have no ability to sell puts during the most profitable IV spikes.
Smart approach: Keep 20-30% in cash/short-term bonds. When VIX spikes above 30 and quality stocks sell off, deploy aggressively. This is when wheel traders make their year.
Mistake #4: Emotional Rolling Decisions
The most expensive decisions happen when positions move against you. Traders panic-roll for credits that don't mathematically make sense, locking in poor position management.
QuantWheel's Roll Assistant shows you every possible roll option with the math pre-calculated, removing emotion from the decision.
Stock Selection Impact on Wheel Strategy Returns
Your stock selection matters far more than your strike selection for long-term returns.
High-Quality Stocks (Lower Return, Lower Risk)
Examples: AAPL, MSFT, GOOGL, V, MA
Typical premium: 1-1.5% monthly at 0.30 delta
Expected annual return: 12-18%
Risk profile: Low probability of permanent capital impairment
These "boring" stocks consistently deliver moderate returns with minimal drama. You'll rarely face situations where assignment creates genuine problems.
Medium-Quality Growth Stocks (Higher Return, Higher Risk)
Examples: AMD, NVDA, PLTR, SQ, SHOP
Typical premium: 1.5-2.5% monthly at 0.30 delta
Expected annual return: 18-25%
Risk profile: Moderate volatility, occasional 30-40% drawdowns
This is where most active wheel traders operate. Higher premium, but you need strong conviction in the underlying businesses to stomach the volatility.
Speculative/Meme Stocks (Highest Premium, Highest Risk)
Examples: AMC, GME, RIVN, etc.
Typical premium: 3-5%+ monthly at 0.30 delta
Expected annual return: Highly variable (-50% to +100%)
Risk profile: Extreme volatility, permanent capital impairment possible
Yes, the premium looks incredible. But one bad assignment can wipe out a year of careful profits. Most experienced wheel traders avoid this category entirely.
Wheel Strategy vs Buy-and-Hold: The Honest Comparison
Let's compare wheel strategy returns against simple buy-and-hold over various market conditions.
Bull Market (S&P +25% year)
Buy-and-hold SPY: 25% return, zero effort
Wheel strategy: 15-20% return, significant effort
Winner: Buy-and-hold
During strong bull markets, the wheel's capped upside (you're constantly selling calls) means you underperform. This is the wheel's Achilles heel.
Sideways Market (S&P -2% to +5% year)
Buy-and-hold SPY: 2% return
Wheel strategy: 12-18% return
Winner: Wheel strategy
This is where premium collection shines. While buy-and-hold investors tread water, wheel traders collect consistent premium regardless of direction.
Bear Market (S&P -20% year)
Buy-and-hold SPY: -20% return
Wheel strategy: -5% to +5% return (depending on management)
Winner: Wheel strategy
The premium collected provides significant downside cushion. However, if you get assigned at the top and sell calls all the way down, you can still face meaningful losses - just smaller than buy-and-hold.
10-Year Average (All Market Conditions)
Buy-and-hold SPY: ~10-11% annual average
Wheel strategy: 12-20% annual average (for disciplined traders)
Winner: Wheel strategy (if you can maintain discipline)
Over full market cycles, the wheel can outperform buy-and-hold, but requires active management, emotional discipline, and proper tracking.
How to Track Wheel Strategy Returns Accurately
Proper return tracking is non-negotiable if you want to know whether your strategy actually works.
Manual Tracking (Spreadsheet Method)
Required columns:
- Entry date, exit date, days held
- Premium collected (puts and calls separately)
- Assignment dates and cost basis adjustments
- Realized P&L per position
- Unrealized P&L on open positions
- Time-weighted return calculation
Pros: Free, full control
Cons: Time-intensive, error-prone, breaks down with 10+ positions
I tracked this way for two years. It works until it doesn't - usually around position #10-15 when assignments start overlapping.
Professional Platform Method (QuantWheel)
Automatic tracking:
- Broker sync pulls all positions automatically
- Cost basis adjusts the moment you're assigned
- Premium tracking across full wheel cycles
- Time-weighted returns calculated automatically
- Portfolio-level and position-level returns
- Benchmark comparisons (vs SPY, vs sector)
Pros: Accurate, automatic, scales with portfolio size
Cons: $49/month cost (though 14-day free trial)
After switching to QuantWheel, I discovered my manual tracking was overstating returns by 2-3% annually due to cost basis calculation errors. That's a meaningful difference over time.
The question isn't whether tracking software is worth it - it's whether accurate return data is worth $600/year. For any serious wheel trader, the answer is yes.
Improving Your Wheel Strategy Returns
Based on analyzing thousands of wheel trades, these tactics consistently improve returns:
Tactic #1: IV-Based Position Sizing
Deploy more capital when IV is elevated (VIX 25+), scale back when IV compresses (VIX sub-15).
Example allocation:
- VIX 15-20: 60% deployed
- VIX 20-25: 70% deployed
- VIX 25-30: 85% deployed
- VIX 30+: 100% deployed (or even leverage slightly)
This ensures you're maximizing returns during optimal conditions and preserving capital during poor conditions.
Tactic #2: Diversification Across Sectors
Never have more than 40% of your portfolio in a single sector.
Recommended allocation:
- Tech: 30-40%
- Financial: 15-20%
- Healthcare: 10-15%
- Consumer: 10-15%
- Other: 10-20%
When tech corrects 15%, your other positions cushion the blow.
Tactic #3: Systematic Profit Taking
Close positions at 50% profit with 21+ DTE remaining. This improves annual returns by recycling capital faster.
Math: Holding a position for full 45 days to collect 100% of $300 premium = $300 Closing at 50% ($150) after 15 days, then deploying in new position for 30 days collecting another $200 = $350 total
The math consistently favors early profit-taking.
Tactic #4: Avoiding Earnings
Don't hold short puts through earnings unless you have very strong conviction and IV premium justifies the risk.
Statistics: Stocks move an average of 4-6% on earnings. Your 30-delta put has ~30% chance of assignment under normal conditions, but that spikes to 45-55% when holding through earnings.
Just roll before earnings or close the position.
What Realistic Wheel Strategy Returns Mean for Your Goals
Let's ground this in practical scenarios.
Scenario 1: Supplemental Income ($50,000 Account)
Target: $500-750/month supplemental income
Required return: 12-18% annually
Strategy: Conservative 0.25-0.30 delta on quality stocks
Positions: 5-8 concurrent positions
Time commitment: 30-60 minutes daily
Realistic outcome: Very achievable with discipline. Your $50K account generating 15% annual returns produces $7,500/year ($625/month average). Some months higher, some lower, but averaging to your target.
Scenario 2: Primary Income ($200,000 Account)
Target: $3,000-4,000/month to replace W2 income
Required return: 18-24% annually
Strategy: Moderate 0.30-0.35 delta, active management
Positions: 10-15 concurrent positions
Time commitment: 1-2 hours daily
Realistic outcome: Possible but challenging. Your $200K account needs 18-24% returns to hit $36,000-48,000 annual income. This requires strong market conditions, excellent stock selection, and active position management. Most traders find this sustainable for 2-3 years before burning out.
Scenario 3: Wealth Building ($100,000 Account)
Target: 20%+ annual returns for long-term growth
Required return: 20-25% annually
Strategy: Moderate-to-aggressive, reinvesting all premium
Positions: 8-12 concurrent positions
Time commitment: 1-2 hours daily
Realistic outcome: Achievable during favorable market conditions. Your $100K growing at 22% annually becomes $304K after 5 years, $924K after 10 years. However, this assumes consistent execution through bear markets and corrections, which most traders struggle with.
The Honest Truth About Long-Term Wheel Strategy Returns
After analyzing multi-year wheel trading performance across hundreds of traders, here's the uncomfortable reality:
Year 1: Most traders achieve their target returns (12-20%+). The strategy is new, they're disciplined, they follow their rules.
Year 2: Returns often improve as skill develops. Traders refine stock selection, improve roll timing, develop better intuition. This is peak performance for most traders.
Year 3-4: Many traders see declining returns as discipline slips, overconfidence leads to position sizing mistakes, or they get bored and start chasing higher premiums on riskier stocks.
Year 5+: Traders either systematize their approach (often using professional platforms like QuantWheel) and maintain 12-18% long-term returns, or they blow up chasing returns and stop trading options entirely.
The wheel strategy works long-term for traders who treat it like a business: systematic execution, proper tracking, emotional discipline, and realistic return expectations.
It fails for traders who treat it like a get-rich-quick scheme.
Final Thoughts: Setting Realistic Wheel Strategy Return Expectations
If you remember nothing else from this article, remember these points:
Returns of 12-20% annually are realistic and achievable for disciplined wheel traders using proper position sizing and quality stock selection.
Market conditions matter more than skill - high IV periods naturally boost returns, low IV periods compress them. Don't confuse a bull market with genius.
Accurate tracking is non-negotiable - if you're not properly accounting for cost basis adjustments through assignments, you don't know your real returns. Most traders overestimate performance by 20-40%.
Stock selection trumps strike selection - selling puts on quality businesses at fair prices beats chasing premium on junk stocks. Always.
Consistency beats optimization - trading 52 weeks a year with 12% returns beats trading sporadically with 25% returns in the weeks you trade.
The wheel strategy isn't magic. It's a systematic approach to generating modest excess returns through disciplined options selling and active position management.
If you're looking for 50-100% annual returns, this isn't your strategy. If you're looking for 12-20% returns with less volatility than buy-and-hold, delivered through consistent execution and proper tracking, the wheel strategy might be exactly what you need.
Risk Disclosure
Options trading involves substantial risk and is not suitable for all investors. Past performance does not guarantee future results. This content is for educational purposes only and should not be considered investment advice. The return figures discussed represent historical data and hypothetical scenarios - your actual results may vary significantly based on market conditions, execution, timing, and other factors. Always do your own research and consider consulting with a financial advisor before making investment decisions.
The examples used in this article are for educational purposes only and are not recommendations to buy or sell any security. All investment decisions should be based on your own analysis and risk tolerance.