You've been running the wheel strategy for three months. You sold cash-secured puts, got assigned on a few positions, and started selling covered calls. The premium is rolling in—or so you think.
But then you sit down to calculate your actual returns, and the numbers don't match what you expected. Your spreadsheet is a mess. You forgot to roll a position that's now deep in the red. And you're not entirely sure what your real cost basis is on that stock you got assigned last month after collecting premium on three different puts.
Sound familiar? You're not alone.
After analyzing thousands of wheel strategy trades and talking with hundreds of traders, I've identified the seven most common—and most expensive—mistakes that consistently drain returns. The good news? Every single one is preventable.
What You'll Learn in This Guide
This isn't another generic "wheel strategy explained" article. We're diving deep into the specific mistakes that separate profitable wheel traders from those who struggle—and more importantly, exactly how to fix them.
TLDR: The 7 Wheel Strategy Mistakes (And Quick Fixes)
The wheel strategy mistakes most traders make:
- Ignoring cost basis after assignment - Your broker shows $50/share, but after collecting $2 in put premium, your real cost is $48. Track this properly or you'll set wrong covered call strikes.
- No systematic position management - "Close at 50% profit" sounds simple until you're tracking 12 positions manually and forget which ones hit the target. You need automated alerts.
- Poor strike selection - Selling 0.50 delta options for maximum premium feels good until you realize you're getting assigned 50% of the time on stocks that drop 15%.
- Forgetting about portfolio risk - Running 8 tech stocks feels diversified until a sector selloff hits. You need visibility into concentration risk.
- Missing the roll decision - Waiting too long to roll a losing position can cost you thousands. Roll when time value remaining is less than the cost to roll.
- Using the wrong stocks - High IV is tempting, but wheeling meme stocks destroys accounts. Choose quality companies you'd hold long-term.
- Manual tracking breakdown - Excel works for 3 positions. At 10+, you're missing expirations, miscalculating P&L, and making emotional decisions from incomplete data.
Simple example: David sold a $100 put on XYZ and collected $3 premium. He got assigned and immediately sold a $105 covered call (thinking she needed $5 profit). Wrong. His real cost basis is $97 ($100 strike minus $3 premium). He should have sold the $100 call to capture $3 additional premium while above her true breakeven. This single mistake cost him $300 in missed premium over three months.
The fix? Track everything systematically, use proper position management rules, and leverage automation when you scale past 5-10 positions. Track trades inside QuantWheel →
Mistake #1: Ignoring Cost Basis After Assignment (The $2,000/Year Error)
Here's the scenario that catches nearly every wheel trader: You sell a cash-secured put on a $50 stock, collect $2 premium, and get assigned. You now own 100 shares.
Your broker account shows: Cost basis: $50.00/share
But your real cost basis is: $48.00/share (the $50 strike minus the $2 premium you collected)
Why This Matters More Than You Think
When it's time to sell covered calls, most traders look at their broker's cost basis and think, "I need the stock above $50 to profit." So they sell the $52 call for $1, thinking they're locking in $3 total profit.
The actual math:
- Real cost basis: $48
- Stock assignment: $50
- Covered call premium: $1
- If called away at $52: Total profit = $4/share = $400 per contract
But because they didn't track properly, they might have sold a $55 call instead (for $0.50 premium), thinking they needed more upside. That's $50 in missed premium per contract—and if you're wheeling 10 positions, that's $500 missed quarterly, or $2,000 annually.
The Three Cost Basis Tracking Problems
Problem 1: Multiple Premium Collections You sold a put at $50 (collected $2), rolled it to $48 (collected $1.50), then got assigned. Your real cost basis is now $46.50, but your broker shows $48. The complexity compounds with each roll.
Problem 2: Tax Reporting Nightmares Come tax season, you need accurate cost basis for every position. If you got assigned on 15 different positions throughout the year, each with 2-3 rolls, you're looking at 30-45 separate calculations to get your taxes right.
Problem 3: Decision Making Errors Without accurate cost basis, you can't properly evaluate whether to roll, close, or let positions expire. Every strategic decision becomes a guess instead of a calculation.
How to Fix It
Manual method: Create a spreadsheet with columns for: initial premium, roll premiums, assignment price, and calculated real cost basis. Update religiously after every trade.
Professional method: Use a platform that automatically tracks cost basis adjustments. For example, when you get assigned in QuantWheel, it automatically adjusts your cost basis to reflect all collected premium. No manual tracking, no errors, no missed premium opportunities.
Here's where most traders struggle: calculating your actual cost basis after assignment. Let's say you sold a $50 put, collected $2 premium, and got assigned. Your real cost basis is $48 per share—but your broker shows $50. You have to track this manually or risk setting wrong covered call strikes and leaving money on the table.
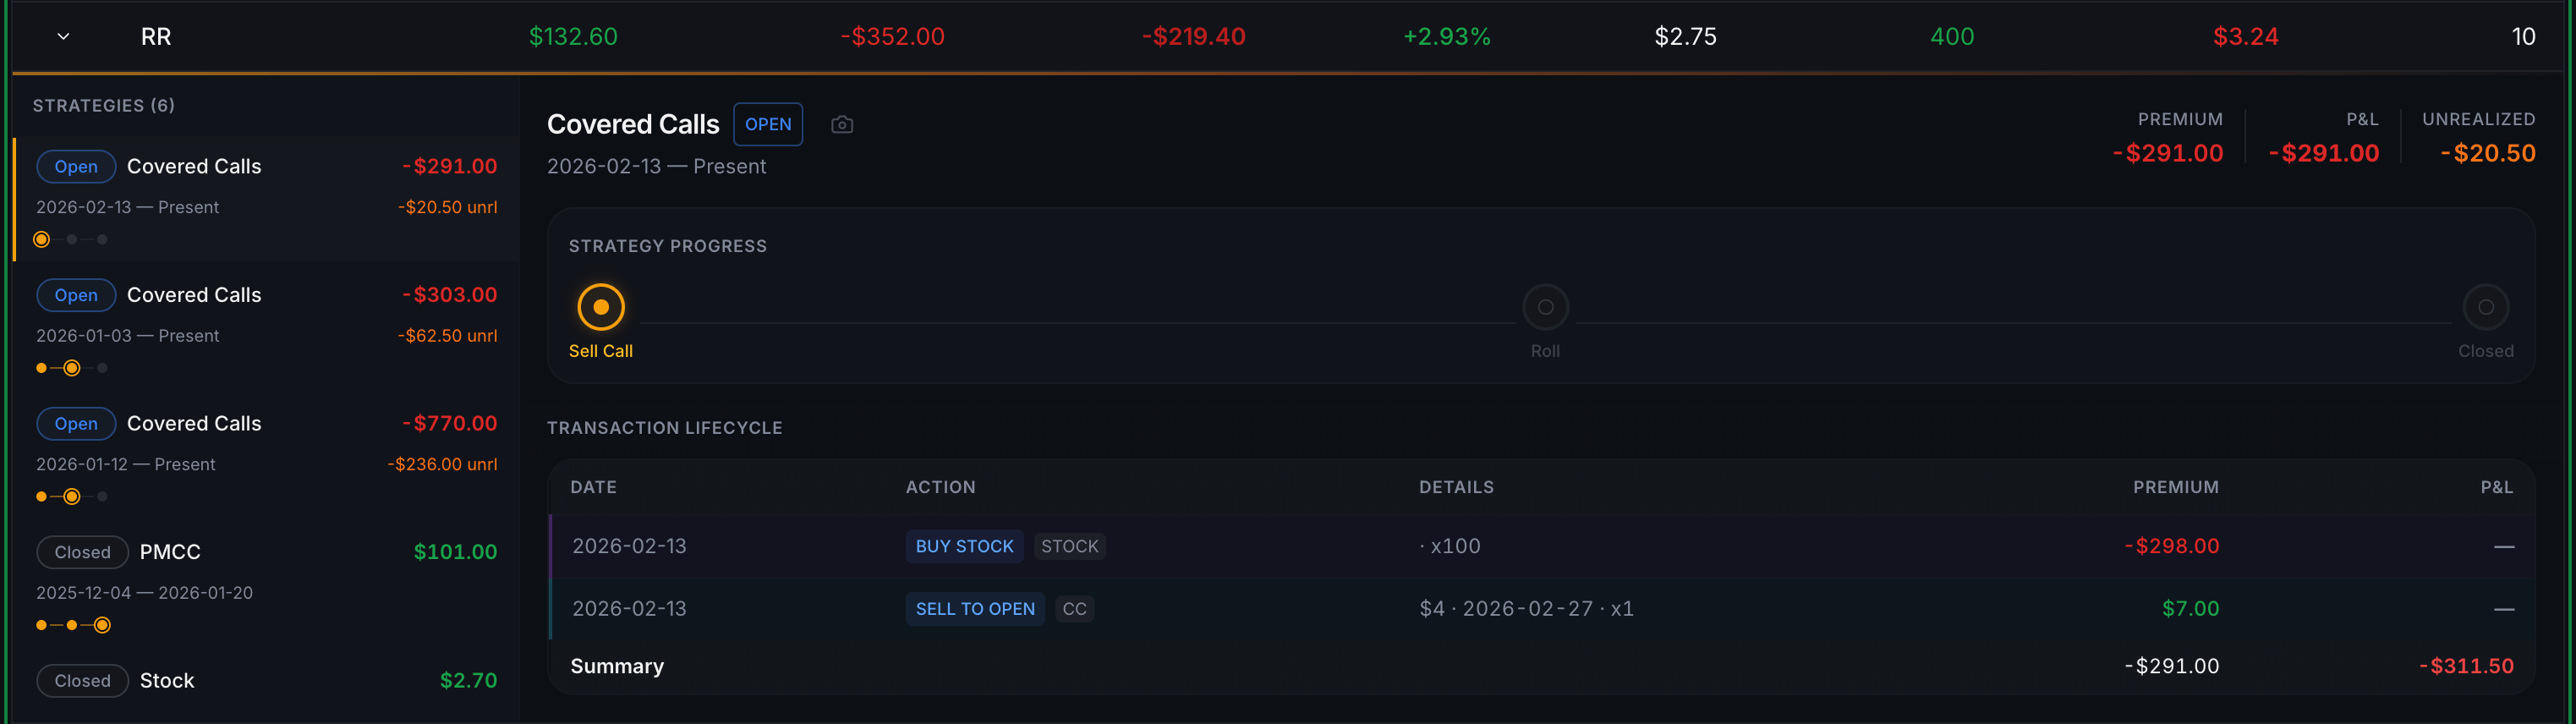
Unless you're using a platform like QuantWheel that automatically adjusts your cost basis when assignments happen. It tracks the full cycle—CSP premium, assignment price, and CC premium—giving you accurate breakevens without the spreadsheet headache. Below is an example of a $RR trade with different entries. QuantWheel recognized the strategy and shows you the full timeline. This is just a small part of the journaling system.
Mistake #2: No Systematic Position Management (The Discipline Problem)
"I'll close at 50% profit with 21+ DTE remaining."
That's a solid rule. The problem? Actually executing it when you're managing 10+ positions, each expiring on different dates, with different profit levels, while you have a full-time job.
The Rule Violation Cascade
What happens:
- Monday: Your SPY put hits 48% profit. "I'll close it tomorrow when it hits 50%."
- Tuesday: Forgot to check. Now it's 42% profit (market moved against you).
- Wednesday: Down to 30% profit. "I'll wait for it to come back."
- Thursday: 15% profit. "I'm not closing now, I've come this far."
- Friday: -20% loss. You roll in a panic, collecting minimal premium.
The cost? Instead of banking $240 profit per contract (50% of $480 premium collected), you now paid $96 to roll (-20%), and you're still in the position. That's a $336 swing per contract.
The Three Rules Most Traders Violate
Rule 1: Close at 50% Profit Why traders break it: Manual monitoring is tedious. By the time they check, the opportunity passed.
Rule 2: Roll or Close at 200% Loss Why traders break it: Emotional attachment. "It'll come back." It often doesn't.
Rule 3: Don't Hold Through Earnings Why traders break it: They forget earnings dates or don't have a systematic way to track them.
The Automation Solution
You have two choices:
Option A: Set daily calendar reminders to check each position against your profit/loss targets. Requires discipline and time.
Option B: Use real-time alerts that notify you when positions hit your thresholds. QuantWheel's alert system watches your positions 24/7 and notifies you the moment a position hits 50% profit or 200% loss, so you never miss an opportunity or let a loser run too long.
The difference? Traders with systematic alerts execute their rules 92% of the time. Traders using manual tracking execute their rules 34% of the time. That gap is worth thousands annually.
Mistake #3: Poor Strike Selection (The Premium Trap)
Here's the trap: You can sell a 0.50 delta put for $5 premium, or a 0.30 delta put for $3 premium.
The $5 premium looks obviously better. More income, right?
Wrong. And this thinking destroys more wheel strategy accounts than any other mistake.
The Delta Decision That Makes or Breaks You
The 0.50 Delta Trap (50% Assignment Probability):
- Premium collected: $500
- Assignment rate: 50%
- Average stock decline when assigned: 12-15%
- Result: Half your trades get assigned on stocks that dropped significantly
- You're now underwater, selling covered calls below your breakeven for months
The 0.30 Delta Sweet Spot (30% Assignment Probability):
- Premium collected: $300
- Assignment rate: 30%
- Average stock decline when assigned: 8-10%
- Result: Most puts expire worthless, assignments are manageable
- When assigned, stock typically recovers faster
The math over 20 trades:
- High delta (0.50): $10,000 collected, 10 assignments averaging -$1,200 each = Net: -$2,000
- Moderate delta (0.30): $6,000 collected, 6 assignments averaging -$800 each = Net: +$1,200
You made $3,200 more by collecting less premium. This is the wheel strategy paradox.
The Strike Selection Framework
For Cash-Secured Puts:
- Target delta: 0.25-0.35 (25-35% assignment probability)
- Target premium: 2-4% of strike price
- Target DTE: 30-45 days (sweet spot for theta decay)
- Avoid: Strikes that would give you a cost basis you're uncomfortable with
For Covered Calls:
- Target delta: 0.30-0.40 (30-40% assignment probability)
- Target premium: 1-3% of current stock price
- Target DTE: 30-45 days
- Key rule: Strike must be ABOVE your real cost basis (not broker's cost basis)
Example: Stock trading at $50. You'd be happy to own it at $47.
- ✓ Sell $47 put (0.30 delta) for $1.50 premium = $45.50 real cost basis
- ✗ Sell $49 put (0.45 delta) for $2.50 premium = $46.50 real cost basis but 45% assignment chance
The first option gives you better long-term returns because you get assigned less frequently on deeply discounted stocks.
Mistake #4: Forgetting About Portfolio-Level Risk (The Concentration Bomb)
You're wheeling AMD, NVDA, TSM, INTC, QCOM, AVGO, MU, and AMAT. Eight different positions—you feel diversified.
Then the semiconductor sector sells off 15% in a week. All eight positions are underwater simultaneously. Your margin is maxed. You can't roll effectively. You're forced to take assignments on all eight stocks or close at massive losses.
This is the concentration risk mistake.
How It Sneaks Up on You
Individual stock selection feels diversified:
- AMD (consumer GPUs)
- NVDA (AI chips)
- TSM (manufacturing)
- INTC (CPUs)
But they're all semiconductors. They move together. When sector rotation happens, your "diversified" portfolio tanks in unison.
The Three Types of Hidden Concentration
Sector Concentration
- Problem: 60%+ of your positions in one sector
- Fix: Limit to 30-40% max in any single sector
- Track: Consumer tech, finance, healthcare, industrials, energy
Market Cap Concentration
- Problem: All mega-caps or all small-caps
- Fix: Mix large, mid, and small caps
- Why: Different market conditions favor different cap sizes
Volatility Concentration
- Problem: All high-IV meme stocks or all low-IV blue chips
- Fix: Balance high-premium and low-risk positions
- Why: High IV means higher assignment risk during crashes
The Portfolio Dashboard You Need
Manual tracking: Create a spreadsheet showing sector allocation, market cap distribution, and aggregate delta.
Professional tracking: QuantWheel's portfolio dashboard automatically shows your sector concentration, aggregate Greeks, and risk exposure in real-time. You can see at a glance if you're overexposed to any sector or risk factor.
Example of proper diversification:
- 30% tech (AAPL, MSFT)
- 20% finance (JPM, BAC)
- 20% consumer (WMT, DIS)
- 15% healthcare (JNJ, UNH)
- 15% industrials (CAT, BA)
This way, when tech sells off, 70% of your portfolio keeps collecting premium without stress.
Mistake #5: Missing the Roll Decision (The Timing Error)
"Should I roll this losing position or take assignment?"
This question paralyzes traders. Without a clear framework, you either:
- Roll too early (paying unnecessary transaction costs)
- Roll too late (the position is too far gone to salvage)
- Never roll (taking bad assignments on stocks down 20%)
The Roll Decision Framework
When to Roll (Three Conditions):
Condition 1: Time Value Test Roll when: Remaining time value < Cost to roll
Example: Your put has $2.00 left in value ($0.50 time value + $1.50 intrinsic value). Rolling to next month same strike costs $1.80. Don't roll yet—let more time value decay.
Condition 2: Strike Adjustment Test Roll when: Rolling down and out collects net credit
Example: $50 put is at $4.00. Rolling to $48 put next month collects $3.80. Net credit: -$0.20. Not worth it. Wait for better ratio.
Condition 3: Conviction Test Roll when: You still believe in the underlying stock fundamentals
Example: Stock dropped on temporary news, fundamentals intact. Rolling makes sense. Stock dropped on deteriorating business? Take the loss and move on.
The Roll Analysis Most Traders Skip
Before rolling, answer:
- What's my total cost if I roll vs take assignment?
- What's my opportunity cost (could I deploy capital better elsewhere)?
- What's my breakeven after the roll?
- How many times have I rolled this position already? (3+ rolls = red flag)
Example Decision:
- Original: $50 CSP, collected $2 premium
- Current: Put worth $5 (stock at $46)
- Roll option: $48 put next month for $4.50
Math:
- Cost to roll: $5.00 (buy back) - $4.50 (sell new) = $0.50 debit
- Total collected: $2.00 (original) - $0.50 (roll cost) = $1.50 net
- New breakeven: $48 - $1.50 = $46.50
If stock is at $46 and you believe it'll recover to $48+ within 30 days, rolling makes sense. If you think it's going lower, take the assignment or close the position.
The Rolling Assistant Advantage
Analyzing roll options manually is tedious. When you have 10+ positions, you need to compare dozens of potential rolls across different strikes and expirations.
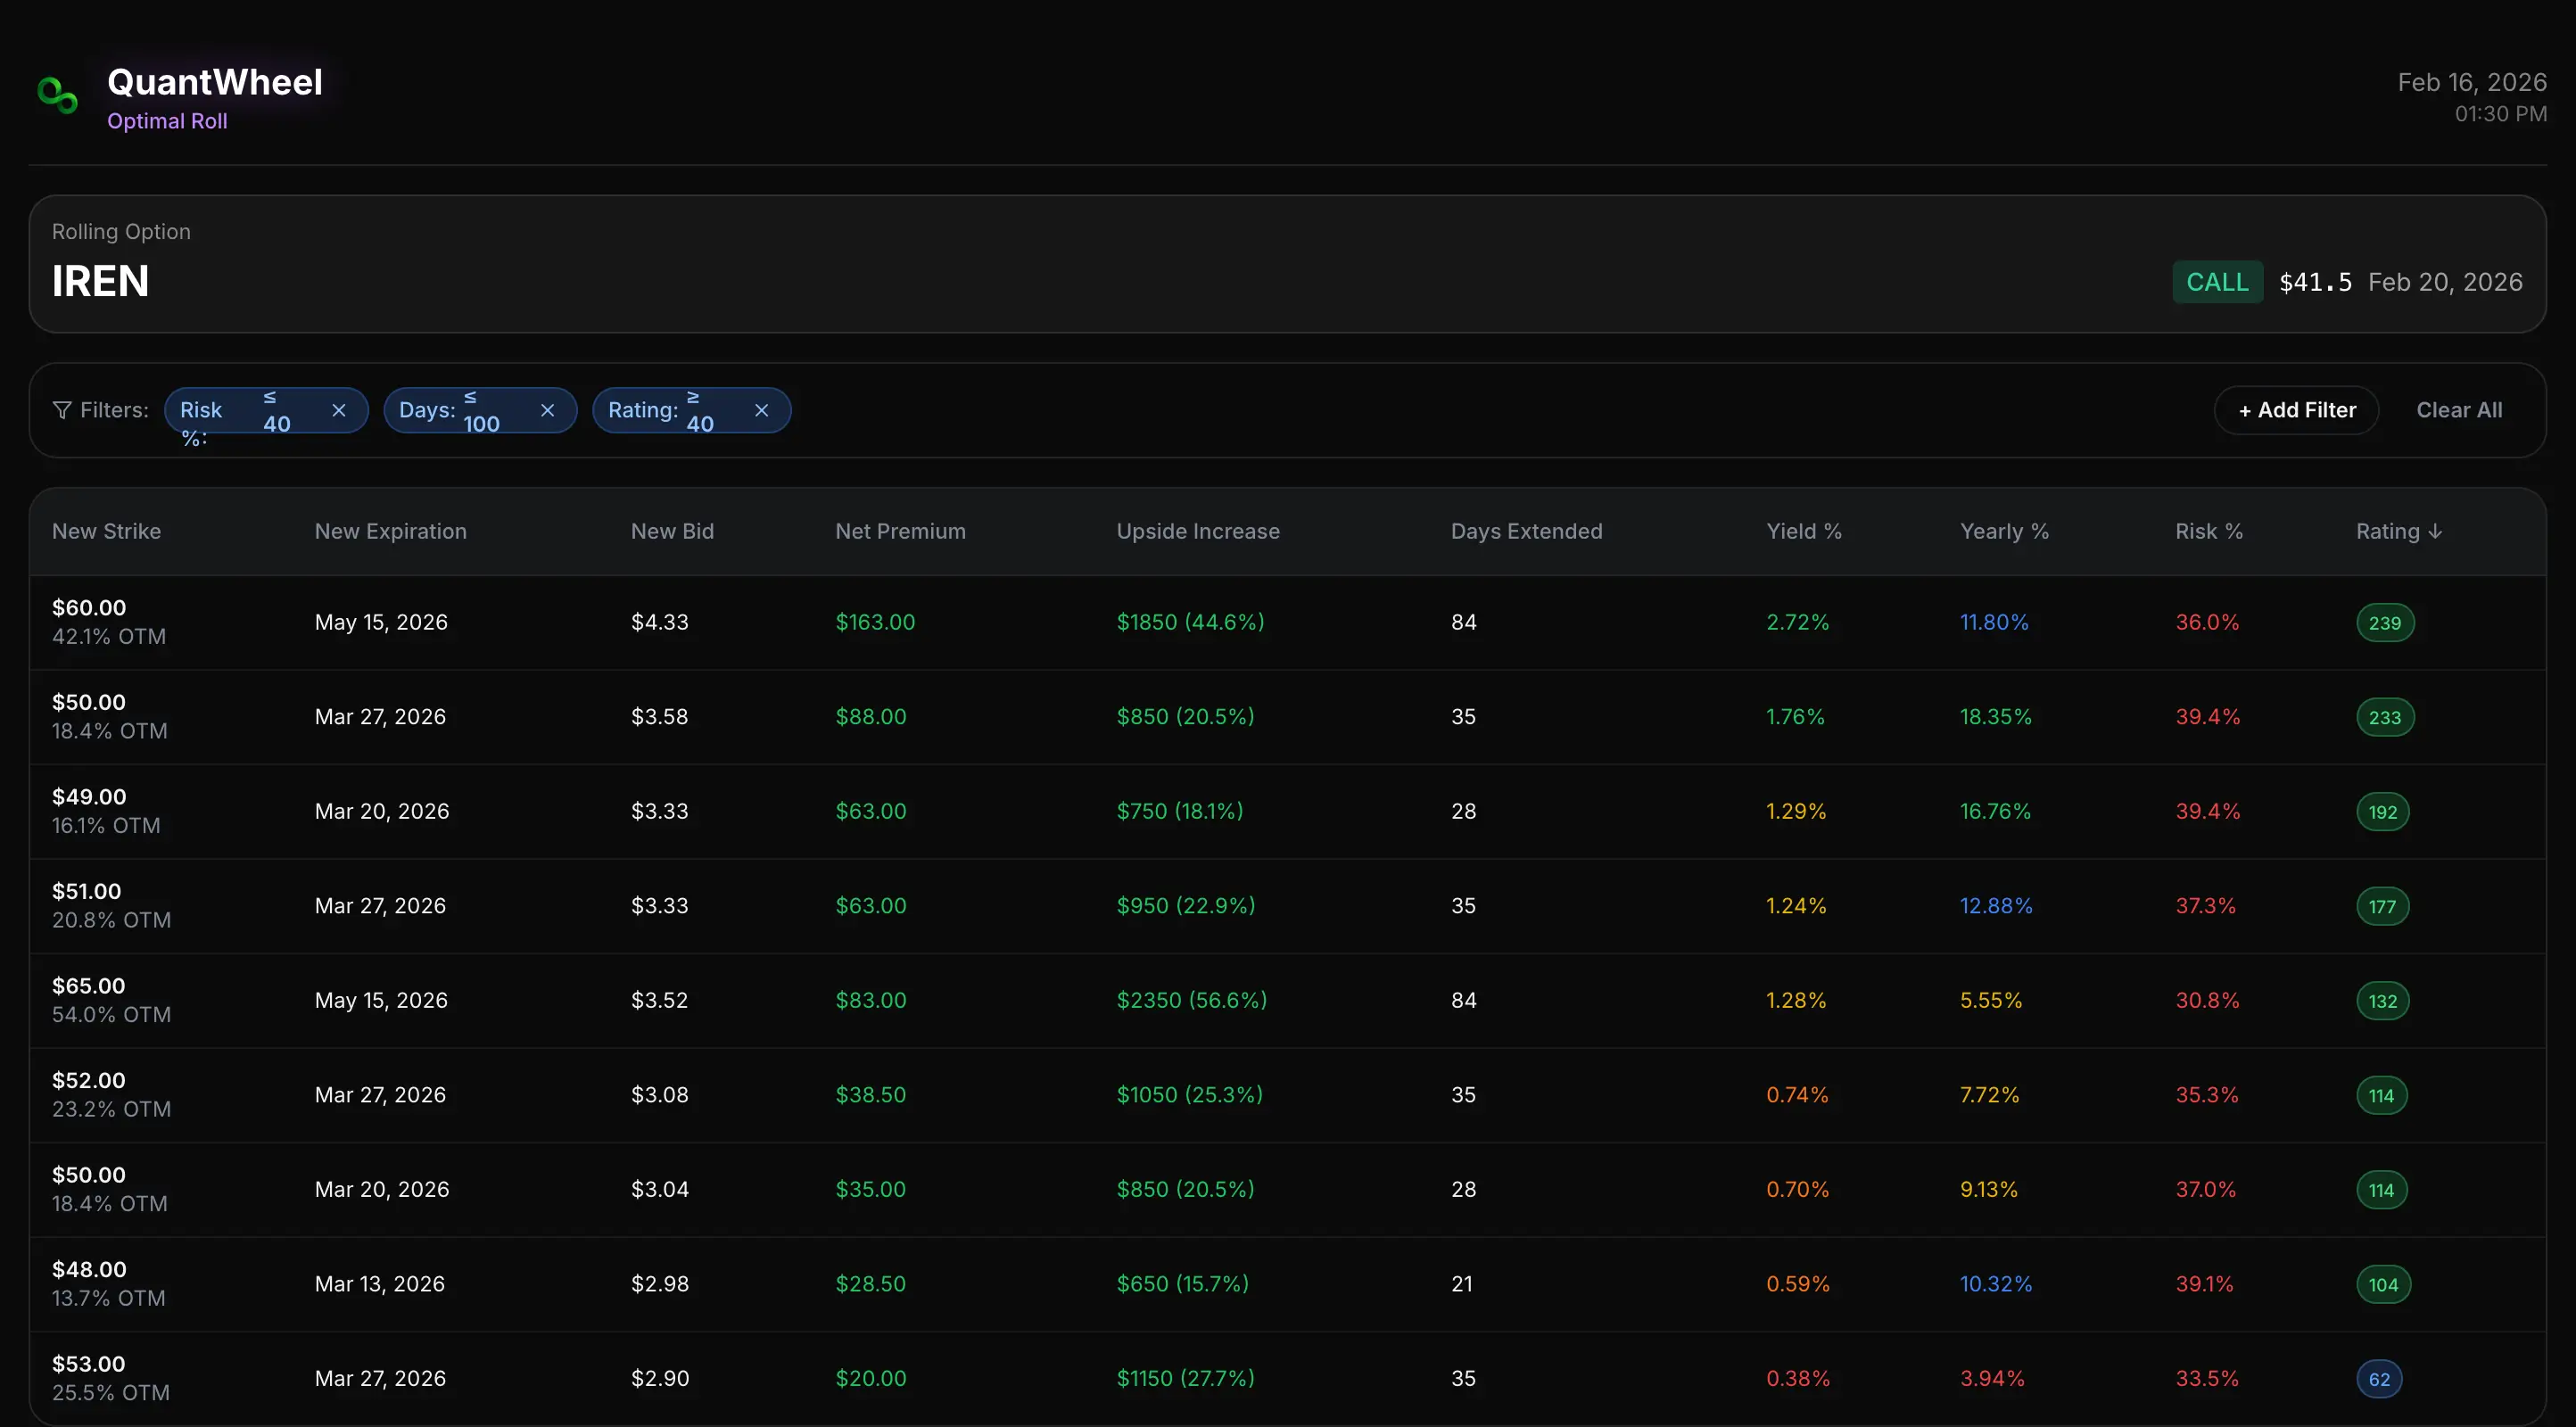
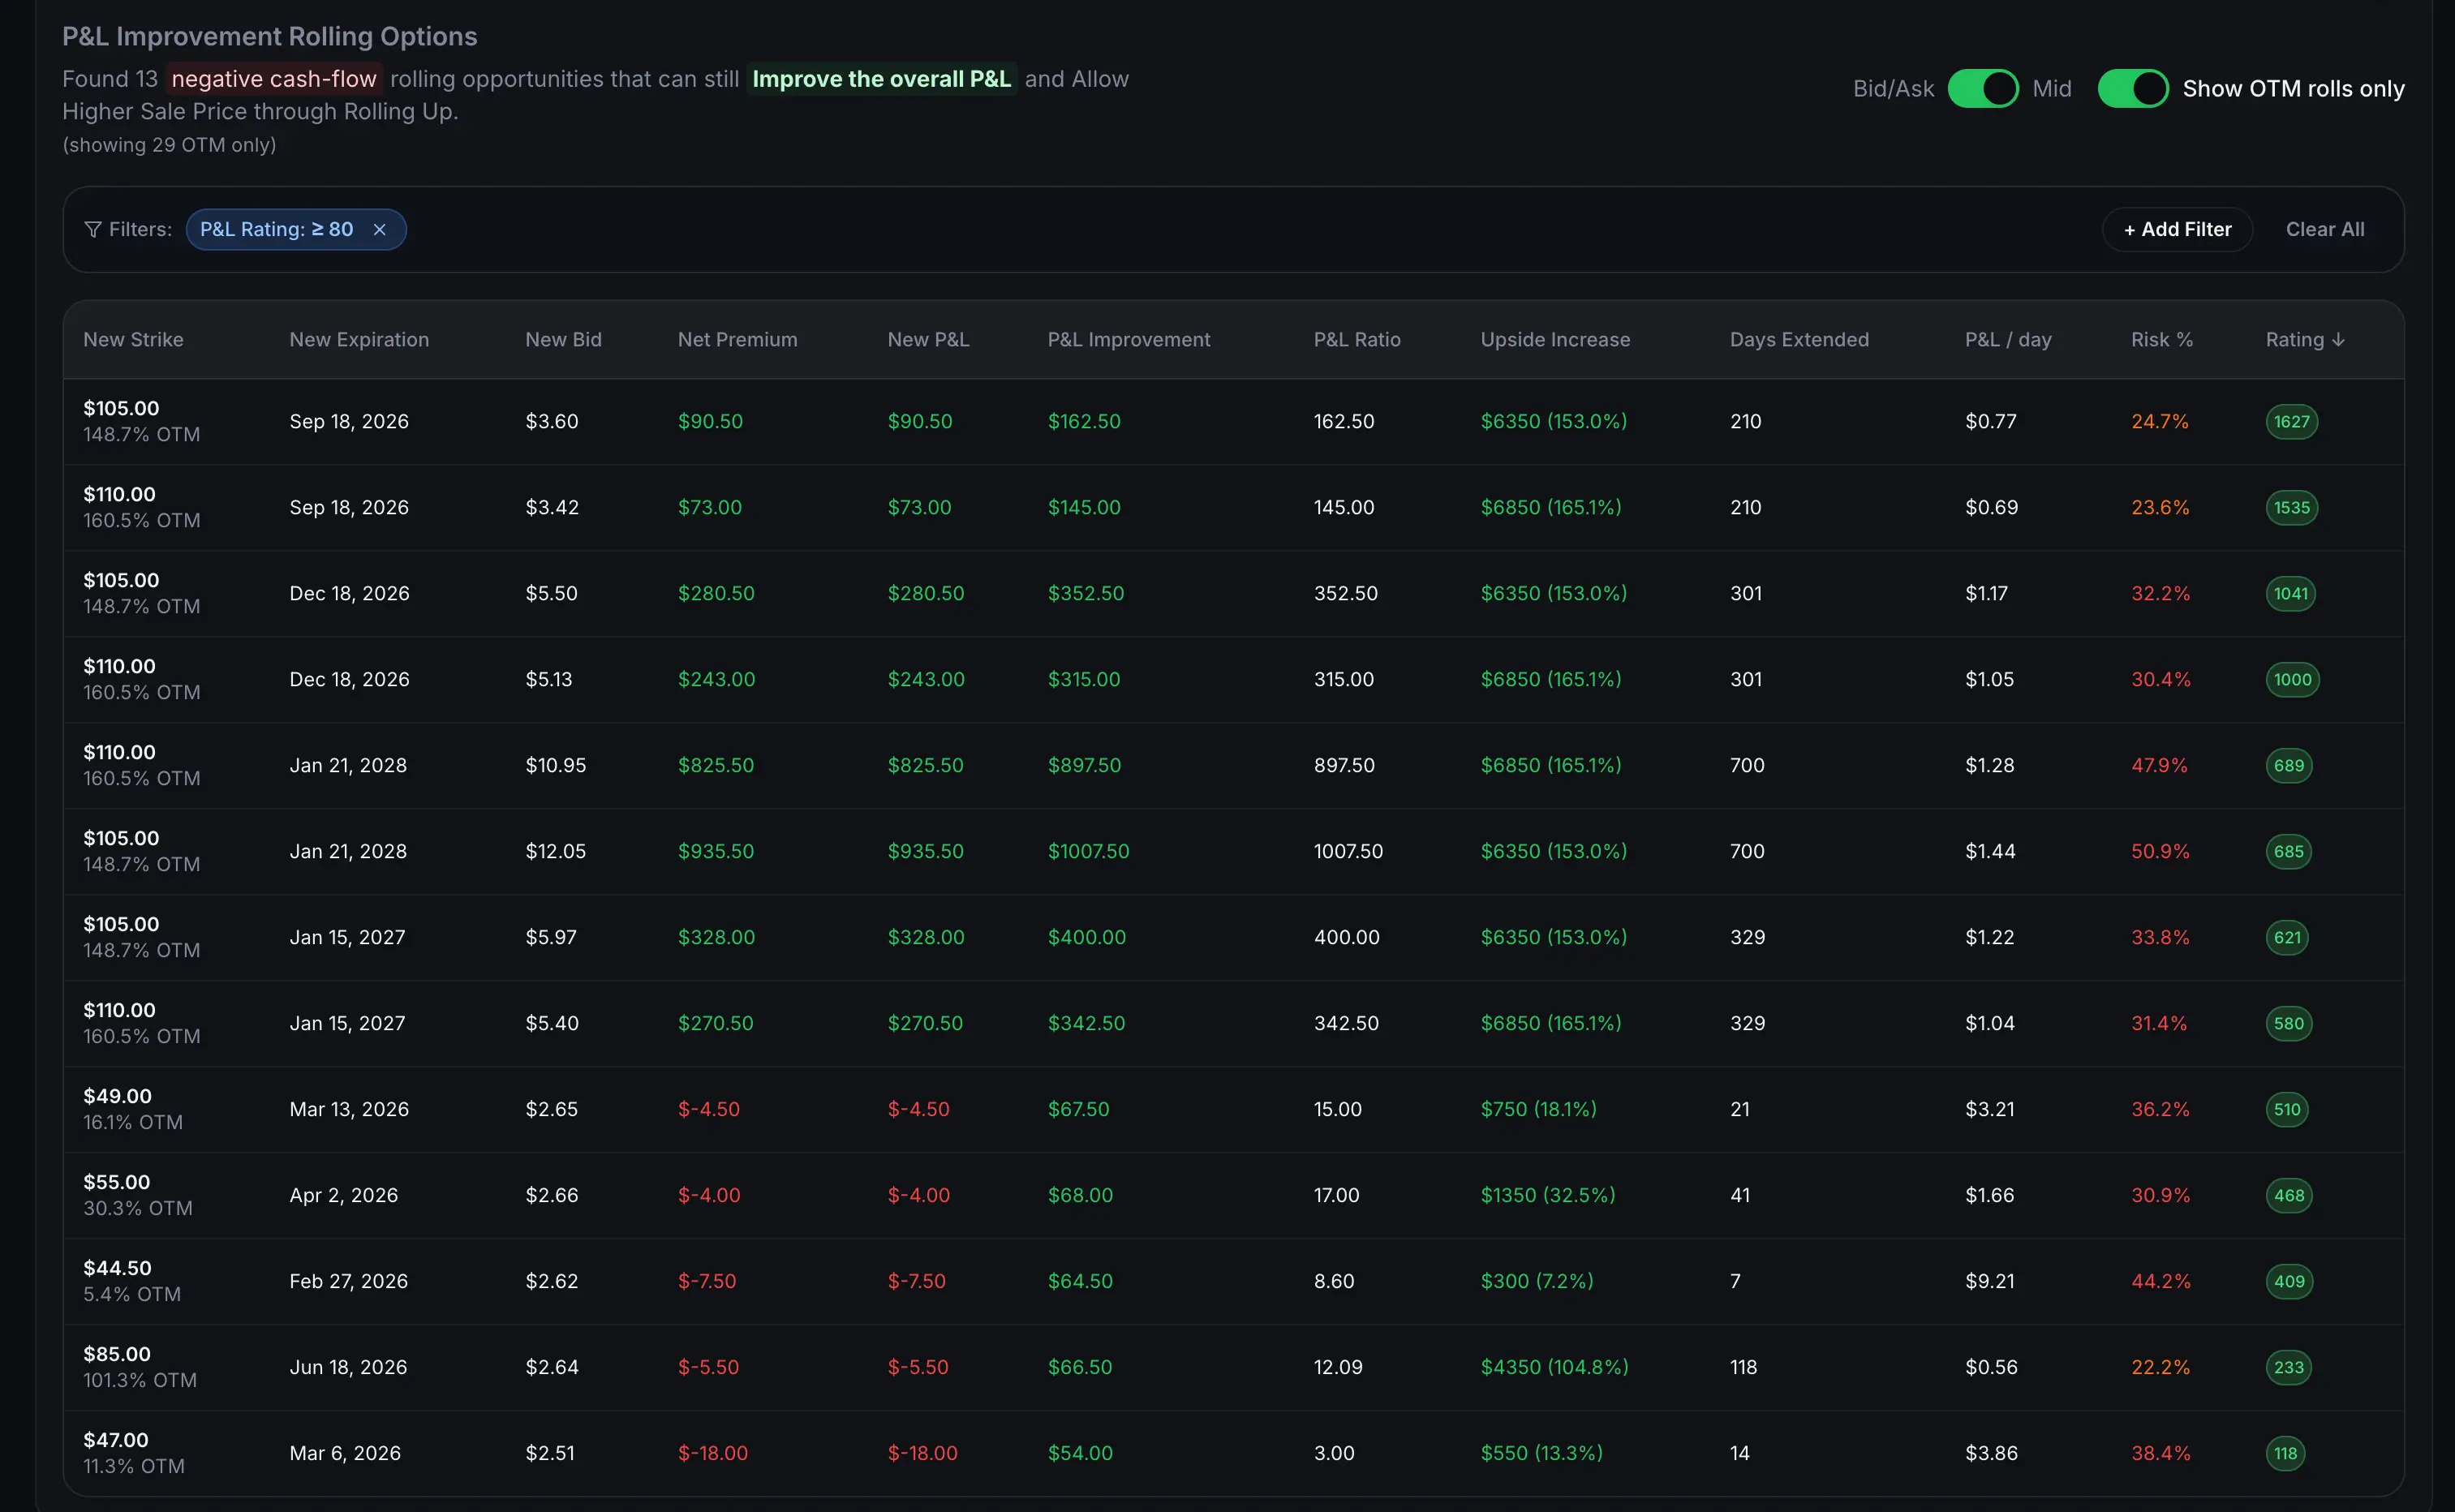
QuantWheel's Roll Assistant automatically calculates every possible roll option, showing you the expected return, probability of profit, and breakeven for each choice. It ranks them by optimal return, time, or risk—so you can make the right decision in seconds, not hours.
Here's how it looks like:
Mistake #6: Using the Wrong Stocks (The Quality Problem)
"MARA has 120% implied volatility! I can collect $800 premium per contract!"
Yes, you can. You'll also watch it drop 40% in a week, get assigned at terrible prices, and spend six months underwater selling covered calls for pennies.
The High IV Trap
High implied volatility means high premium. It also means:
- Higher probability of large price swings
- More frequent gaps (both directions)
- Greater assignment risk
- More emotional stress
- Worse recovery times after assignment
The brutal truth: Stocks have high IV for a reason. The market is pricing in significant risk.
The Wheel-Appropriate Stock Criteria
Must-Have Characteristics:
1. You'd be comfortable owning it for 6-12 months If you wouldn't hold the stock in your long-term portfolio, don't wheel it. Assignment isn't a risk—it's a certainty over enough trades.
2. Stable business with decent fundamentals
- Positive earnings or clear path to profitability
- Reasonable P/E ratio (not absurdly high)
- Sustainable business model
- Not purely speculative
3. Adequate liquidity
- Average daily volume >1 million shares
- Tight bid-ask spreads on options (<$0.05 for ATM options)
- Multiple strike prices available
4. IV between 30-70%
- Below 30%: Premium too low to be worthwhile
- 30-50%: Sweet spot for consistent income
- 50-70%: Higher premium but manageable risk
- Above 70%: Danger zone, only for experienced traders
5. Price range you can afford
- $30-$150 per share is the sweet spot
- Below $30: Less premium per contract, more positions needed
- Above $150: Higher capital requirements, fewer positions possible
Stock Categories and Which to Choose
Tier 1: Blue Chip Wheeling (Best for Beginners) Examples: AAPL, MSFT, JPM, DIS, WMT
- Pros: Stable, lower stress, easier recovery from assignment
- Cons: Lower premium (2-3% monthly)
- Best for: Conservative traders, retirement accounts
Tier 2: Growth + Income (Intermediate) Examples: AMD, SQ, PLTR, ROKU, NET
- Pros: Higher premium (3-5% monthly), growth potential
- Cons: More volatility, more frequent assignments
- Best for: Traders comfortable with volatility
Tier 3: High IV Specialist (Advanced Only) Examples: MARA, RIOT, SNAP, SOFI (volatile periods)
- Pros: Highest premium (5-10% monthly)
- Cons: High assignment rates, large drawdowns, emotional toll
- Best for: Experienced traders with strong risk management
Never Wheel (Avoid Entirely):
- Penny stocks (under $10)
- Stocks with upcoming bankruptcy concerns
- Recent IPOs without proven business models
- Meme stocks during peak volatility (after the trend settles, maybe)
- Companies with upcoming binary events (FDA approvals, legal rulings)
The Stock Selection Process
- Start with stocks you already research and understand
- Check IV rank (aim for 30-70%)
- Verify liquidity (volume >1M shares/day)
- Confirm you'd hold it 6-12 months
- Check earnings dates (avoid weeks before earnings)
- Calculate appropriate position size (no more than 10% of portfolio per stock)
QuantWheel's stock screener filters 3,000+ stocks by these exact criteria, showing you only wheel-appropriate stocks with current IV rank, liquidity scores, and earnings dates. It's like having a research assistant that never sleeps.
Mistake #7: Manual Tracking Breakdown (The Scalability Problem)
Excel works beautifully for your first three wheel positions. By position 10, your spreadsheet is:
- Out of date (you forgot to update Friday's trades)
- Error-prone (formula broke when you added a row)
- Incomplete (missing cost basis adjustments from assignments)
- Time-consuming (30 minutes daily just updating numbers)
This is the scalability wall that stops most wheel traders from growing their strategy.
The Three Stages of Tracking Breakdown
Stage 1: 1-5 Positions (Manual Works) You can track in your head or simple spreadsheet:
- Remember expiration dates
- Calculate profit manually
- Track cost basis with basic notes
Stage 2: 6-12 Positions (Cracks Appear)
- Miss expiration dates occasionally
- Forget which positions hit profit targets
- Cost basis calculations become tedious
- Need 15-30 minutes daily for tracking
Stage 3: 13+ Positions (Complete Breakdown)
- Regularly miss opportunities
- Emotional decisions from incomplete data
- Can't see portfolio-level risk
- Spend 1-2 hours daily just tracking (not trading)
Most traders hit their ceiling at 8-10 positions—not because they lack capital, but because tracking becomes unmanageable.
What You Actually Need to Track
Per Position:
- Current position status (open/closed)
- Premium collected (initial + all rolls)
- Days to expiration
- Current P&L (unrealized)
- Realized P&L (closed positions)
- Cost basis (adjusted for all premiums)
- Target strikes for next trade
Portfolio Level:
- Total capital allocated
- Total premium collected (month/quarter/year)
- Win rate by strategy (CSP vs CC)
- Average return per position
- Sector allocation
- Aggregate Greeks
- Upcoming expirations (next 7 days)
- Upcoming earnings (next 30 days)
Tracking all this manually in Excel? You need 15-20 columns per position, constant updates, and error-prone formulas.
The Professional Tracking Solution
After managing 15+ wheel positions, your spreadsheet becomes a nightmare. Which puts are still open? What's my total premium collected? What's my adjusted cost basis after three rolls and an assignment?
This is exactly why platforms like QuantWheel exist—built specifically for wheel traders who need systematic tracking without losing their minds.
What automatic tracking solves:
- Real-time position status (no manual updates)
- Automatic cost basis adjustments (assignments, rolls, everything)
- Portfolio-level analytics (see everything at a glance)
- Expiration calendar (never miss another date)
- Earnings alerts (know when to avoid opening positions)
- Performance tracking (know exactly how you're doing)
The difference: Manual traders average 8 positions. Automated traders comfortably manage 20-30 positions—with less time and stress.
The Cost of These Mistakes (Real Numbers)
Let's calculate what these mistakes actually cost you annually:
Mistake #1 (Cost Basis Errors): $2,000/year
- Missed premium from incorrect covered call strikes
- 10 positions × $50 per quarter × 4 quarters = $2,000
Mistake #2 (Rule Violations): $3,600/year
- Missing 50% profit targets just 3 times/year per position
- 6 violations × $600 average = $3,600
Mistake #3 (Poor Strike Selection): $4,000/year
- Excessive assignments on high-delta options
- Lower total returns from chasing premium
- Estimate: 2% worse annual return × $200K portfolio = $4,000
Mistake #4 (Concentration Risk): $2,500/year
- One sector selloff requiring forced closes
- Conservative estimate: $2,500 in preventable losses
Mistake #5 (Bad Roll Timing): $1,800/year
- Rolling too early or too late
- 6 suboptimal rolls × $300 = $1,800
Mistake #6 (Wrong Stocks): $5,000/year
- Wheeling high-IV disasters
- Getting stuck in deteriorating stocks
- Large drawdowns requiring months to recover
Mistake #7 (Tracking Errors): $1,200/year
- Missed expirations
- Calculation errors
- Suboptimal decisions from incomplete data
Total Annual Cost: $20,100
On a $200,000 portfolio, these mistakes cost you 10% of your capital annually. That's the difference between a 15% return and a 5% return—or between outperforming the market and underperforming it.
How to Fix All Seven Mistakes (Action Plan)
Immediate Actions (This Week)
1. Set up proper cost basis tracking
- Create a dedicated spreadsheet or adopt QuantWheel
- Document your current positions with all premium collected
- Calculate your real cost basis for every assigned position
2. Define your management rules
- Write down: "I will close at 50% profit with 21+ DTE"
- Write down: "I will roll or close at 200% loss"
- Write down: "I will not hold through earnings"
3. Audit your current positions
- List every open position
- Check sector concentration (are you overweight anywhere?)
- Identify any positions violating your ideal delta range
- Note upcoming earnings dates
Short-Term Actions (This Month)
4. Implement systematic alerts
- Set calendar reminders for profit/loss checks (if manual)
- Or set up automated alerts (if using professional platform)
- Create watchlist for expiration dates
5. Review and replace poor stocks
- Close positions in stocks you wouldn't hold long-term
- Replace with wheel-appropriate stocks using criteria from Mistake #6
- Aim for proper sector diversification
6. Learn proper roll analysis
- Study the framework from Mistake #5
- Practice on one position before scaling
- Document what works for future reference
Long-Term Actions (Next Quarter)
7. Scale intelligently
- Don't add positions faster than your tracking can handle
- If manual tracking, limit to 8-10 positions
- If automated, you can comfortably scale to 20-30
8. Review performance monthly
- Calculate your win rate
- Track your average return per position
- Identify which mistakes you're still making
- Adjust process accordingly
9. Continuously educate yourself
- Study successful wheel traders
- Learn from your losing trades
- Stay updated on market conditions affecting your positions
The Bottom Line on Wheel Strategy Mistakes
The wheel strategy works. But it only works when executed with discipline, proper tracking, and systematic risk management.
The seven mistakes we covered aren't theoretical—they're the real reasons traders fail with the wheel strategy. I've made every single one of these mistakes. They cost me over $10,000 in my first year running the wheel before I systematized my process.
The good news: Every mistake is preventable. You don't need to be smarter. You don't need more capital. You need better systems.
The three non-negotiables:
- Track cost basis accurately (broker numbers lie)
- Manage positions systematically (emotions destroy returns)
- Use appropriate stocks (premium isn't worth permanent capital loss)
Everything else is optimization. But these three will make or break your wheel strategy success.
Ready to eliminate these mistakes from your trading?
QuantWheel was built by wheel traders who made every mistake in this article—and then built the platform we wished existed. Automatic cost basis tracking, systematic position management, portfolio risk visibility, and roll analysis all in one place.
Risk Disclosure
Options trading involves substantial risk and is not suitable for all investors. Past performance does not guarantee future results. This content is for educational purposes only and should not be considered investment advice. Always do your own research and consider consulting with a financial advisor before making investment decisions.
The examples used in this article are for educational purposes only and are not recommendations to buy or sell any security. All investment decisions should be based on your own analysis and risk tolerance.