If you've been researching ways to grow your wealth in the stock market, you've probably encountered the debate: should you trade options or buy stocks? Both approaches can build wealth, but they work in fundamentally different ways with distinct advantages and risks.
This guide breaks down everything you need to know about options vs stocks, helping you make an informed decision based on your goals, risk tolerance, and available capital.
TL;DR: Options vs Stocks Explained Simply
Stocks = Ownership: When you buy a stock, you own a piece of a company. You can hold it forever, receive dividends, and profit when the price increases. If you buy Apple stock at $150 and it goes to $200, you make $50 per share.
Options = Contracts: When you trade options, you're buying or selling contracts that give you the right (but not obligation) to buy or sell stocks at specific prices by certain dates. Options expire, require less capital, and offer more strategic flexibility.
Simple Example:
- Buying Stock: You buy 100 shares of XYZ at $50 = $5,000 investment. If it goes to $60, you make $1,000 (20% return).
- Buying Call Option: You buy a call option for $300 that controls 100 shares. If XYZ goes to $60, you might make $700 (233% return), but if it stays flat, you lose your entire $300.
- Selling Put Option (Wheel Strategy): You sell a put option and collect $200 premium. If XYZ stays above $50, you keep the $200 (potentially 10% return in 30 days). If it drops, you buy the stock at $50 minus your $200 premium = $48 real cost.
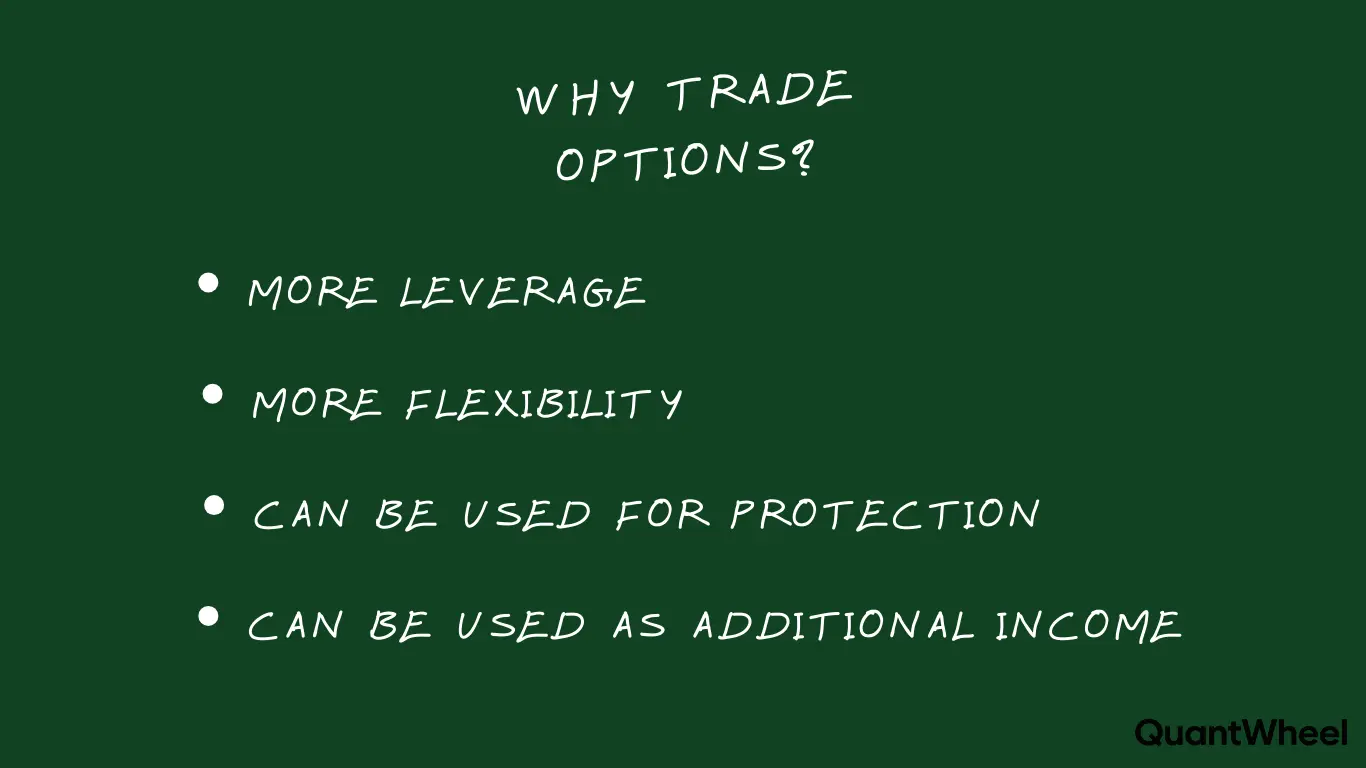
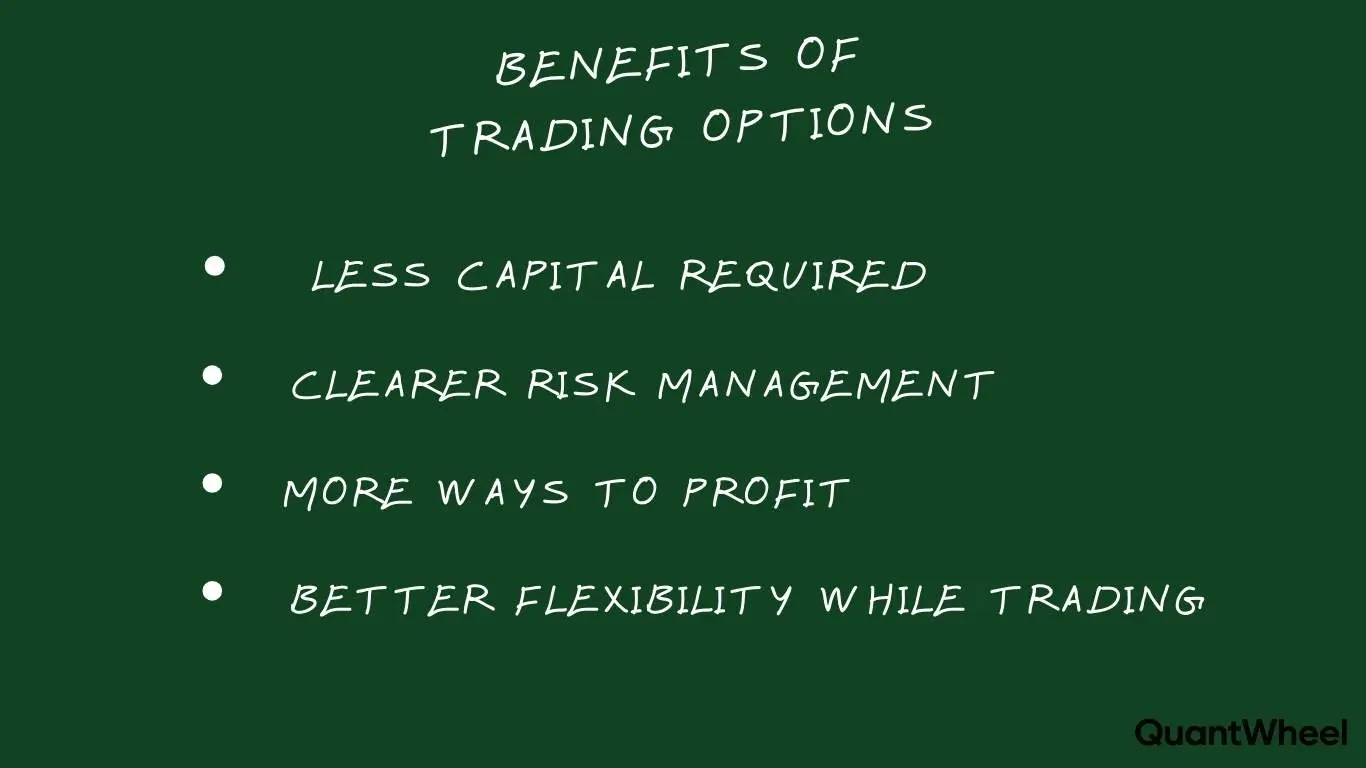
The key difference: stocks require more capital but last forever, while options require less capital but expire and demand active management. Learn options trading faster with QuantWheel →
What Are Stocks? Ownership and Simple Mechanics
Stocks represent fractional ownership in publicly traded companies. When you buy one share of Apple, you literally own a tiny piece of Apple Inc., with all the rights and responsibilities that entails.
How Stock Trading Works
Stock trading mechanics are straightforward. You open a brokerage account, deposit funds, and buy shares at current market prices. Your profit or loss depends entirely on the difference between your purchase price and eventual sale price, plus any dividends received while holding.
If you buy 100 shares of Microsoft at $380 per share, you invest $38,000. If the stock rises to $420, you gain $4,000 (10.5% return). If it falls to $340, you lose $4,000 (10.5% loss). The position remains open indefinitely until you decide to sell.
Stock Ownership Benefits
As a shareholder, you receive several benefits beyond potential price appreciation:
- Voting Rights: You can vote on corporate matters at shareholder meetings
- Dividend Payments: Many companies distribute quarterly cash payments to shareholders
- Unlimited Holding Period: No expiration dates force you to act on specific timelines
- Simplicity: Buy low, sell high—the mechanics are intuitive
- Historical Returns: The S&P 500 has returned approximately 10% annually over long periods
Stock Trading Limitations
Despite their simplicity, stocks have notable constraints:
- Capital Requirements: Building a diversified portfolio requires significant capital ($10,000 minimum, preferably $25,000+)
- Limited Strategies: You're mostly restricted to buying and holding, or selling short
- Market Exposure: Stock positions gain or lose dollar-for-dollar with price movements
- Opportunity Cost: Capital tied up in stocks can't be deployed elsewhere
What Are Options? Contracts with Flexibility and Leverage
Options are financial contracts that give the buyer the right, but not the obligation, to buy or sell an underlying stock at a predetermined price (strike price) before a specific expiration date.
The Two Types of Options
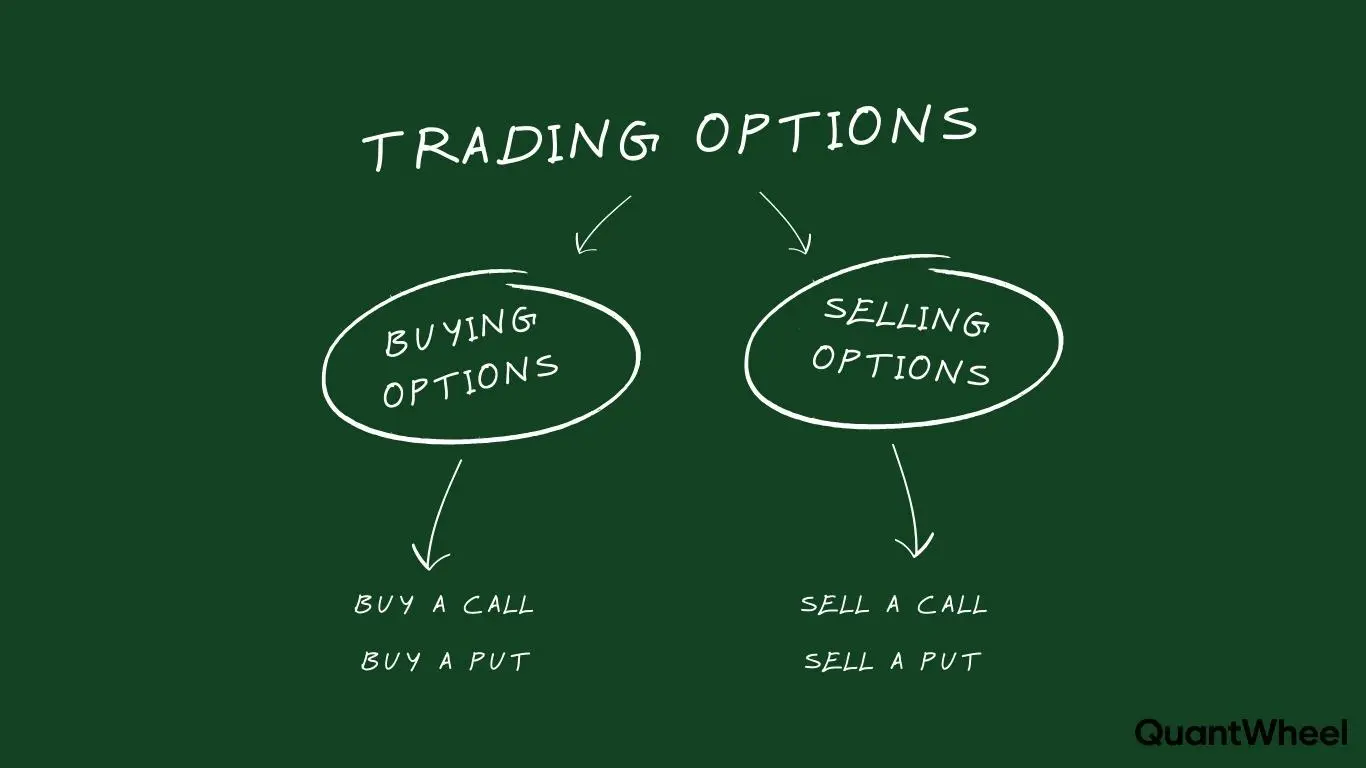
Call Options: Give you the right to BUY stock at the strike price. Traders buy calls when they expect the stock price to rise, or sell calls to generate income on stocks they already own.
Put Options: Give you the right to SELL stock at the strike price. Traders buy puts when they expect the stock price to fall, or sell puts to generate income while potentially buying stock at lower prices.
How Options Trading Works
Options trading involves more moving parts than stock trading. Each contract controls 100 shares of the underlying stock and has three key components:
- Strike Price: The price at which you can buy/sell the stock
- Expiration Date: The last date the option contract is valid
- Premium: The price you pay (when buying) or collect (when selling)
Example: You sell a cash-secured put option on Tesla with a $240 strike price, expiring in 30 days, collecting $5 premium per share ($500 total per contract).
If Tesla stays above $240, the option expires worthless and you keep the $500. If Tesla falls below $240, you're obligated to buy 100 shares at $240, but your real cost basis is $235 ($240 strike minus $5 premium collected).
Options Strategies: Beyond Simple Buying
Unlike stocks where you primarily buy and hold, options enable numerous strategies:
- Buying Calls/Puts: Directional speculation with limited risk
- Selling Cash-Secured Puts: Generate income while potentially buying stocks at discounted prices
- Covered Calls: Generate income on stocks you already own
- The Wheel Strategy: Systematic income generation combining puts and calls
- Spreads: Defined-risk directional strategies combining multiple options
The flexibility of options allows traders to profit in multiple market conditions: rising, falling, or sideways markets.
Capital Requirements: How Much Money You Need
One of the most significant practical differences between options vs stocks is the capital required to start trading effectively.
Minimum Investment for Stocks
To buy stocks outright, you need the full price multiplied by the number of shares:
- 100 shares of a $30 stock: $3,000 required
- 100 shares of a $150 stock: $15,000 required
- 100 shares of a $500 stock: $50,000 required
Financial advisors typically recommend $10,000 minimum to build a properly diversified stock portfolio across multiple sectors. Realistically, $25,000-$50,000 provides meaningful diversification without over-concentrating in any single position.
Minimum Investment for Options
Options require significantly less capital due to leverage and premium collection:
Buying Options:
- Call or put options might cost $200-$1,000 per contract
- Controls 100 shares without buying them outright
- Can start with $2,000-$3,000 account
Selling Cash-Secured Puts:
- Requires cash equal to buying 100 shares at the strike price
- Same as buying stock, but you collect premium upfront
- Typical position size: $3,000-$8,000 per contract
Selling Covered Calls:
- Requires owning 100 shares of the underlying stock
- No additional capital beyond stock ownership
- Generates 1-3% monthly income on stock value
Practical Example: With $10,000, you might buy 200 shares of a $50 stock, or sell 3-4 cash-secured put contracts on different stocks, creating more diversification with options than stocks for the same capital.
Risk Comparison: Understanding What You Can Lose
Risk profiles differ dramatically between options vs stocks, but the reality is more nuanced than "options are riskier."
Stock Trading Risk
When you buy stocks, your maximum loss is 100% of your investment if the company goes bankrupt (rare for established companies). Your maximum gain is theoretically unlimited as stock prices can rise indefinitely.
Realistic Risk Scenarios:
- Bear Market: 20-30% drawdowns are common during recessions
- Individual Stock Risk: Single companies can lose 50-90% of value
- Time Horizon Matters: Losses are only "real" if you sell; holding through downturns historically recovers
Stocks provide the luxury of time. If your $50 stock drops to $30, you can hold for years waiting for recovery. No expiration date forces you to act.
Options Trading Risk
Options risk depends entirely on your strategy:
Buying Options (Highest Risk):
- Maximum loss: 100% of premium paid
- Options can expire completely worthless
- Time decay works against you daily
- Most options buyers lose money statistically
Selling Cash-Secured Puts (Moderate Risk):
- Maximum loss: Similar to buying stock at the strike price
- You're obligated to buy 100 shares if assigned
- Less risky than buying stock outright due to premium cushion
- Example: Selling $50 put for $2 premium means your real cost basis is $48 if assigned
Selling Covered Calls (Lowest Risk):
- Maximum loss: Stock price decline, partially offset by premium collected
- Actually reduces risk compared to holding stock alone
- Potential "loss" of upside if stock rises significantly above strike
The Time Risk: The biggest difference is options expire. If you buy a stock at $50 and it drops to $40, you can wait years for recovery. If you buy an option and the stock doesn't move enough before expiration, you lose everything regardless of eventual recovery.
Profit Potential: How Much You Can Make
Both options and stocks can generate significant returns, but they achieve profits through different mechanics.
Stock Profit Potential
Stock returns come from two sources:
- Price Appreciation: The difference between purchase and sale price
- Dividends: Quarterly cash payments (typically 1-4% annually)
Historical Context:
- S&P 500 average annual return: ~10% over 50+ years
- Individual stocks can return 20-100%+ in single years
- Home run stocks (Amazon, Apple, Tesla) return 1,000%+ over decades
- Buy and hold allows unlimited upside capture
Realistic Expectation: Most stock investors should expect 8-12% annual returns over long periods, with significant year-to-year volatility.
Options Profit Potential
Options returns vary wildly based on strategy:
Buying Options (Speculation):
- Potential: 100-500%+ returns in days or weeks
- Reality: 75%+ of options expire worthless
- High risk, high reward approach
- Not sustainable long-term for most traders
- Best to use for rare situations you are sure about
Selling Options (Income Generation):
- Potential: 1-3% per month (12-36% annualized) through premium collection
- Reality: More consistent but capped upside
- Strategies like the wheel target 15-25% annual returns
- Requires active management and position sizing discipline
Example Comparison:
- Stock holding: Buy 100 shares at $50 ($5,000), hold 1 year, stock rises to $60 = $1,000 gain (20%)
- Wheel strategy: Sell monthly puts/calls on the same $50 stock, collect $150-$250 monthly in premium = $1,800-$3,000 annually (36-60% return on capital deployed), but with active management required
**Problems:**How to find best trades? How to keep track of your trades?
Here's where QuantWheel becomes valuable:
- it finds the best trades that are currently available so you don't have to waste time - a clear signal.
- it tracks every trade you make.
After managing 15+ wheel positions manually in spreadsheets, the tracking becomes chaotic. QuantWheel's Wheel Native Journal automatically tracks full cycles—from cash-secured puts through assignment to covered calls and exit—adjusting your cost basis automatically so you always know your real breakeven and profitability. This level of tracking is essential for understanding whether your strategy is actually working once you start running multiple positions. QuantWheel also removes the unnecessary and gives you only the best trading deals, you just have to adjust your risk and pick a stock you like. Get inside QuantWheel →
Time Commitment: Active vs Passive Approaches
The time required to manage positions differs significantly between options vs stocks.
Stock Trading Time Requirements
Buy-and-Hold Approach:
- Initial research: 2-5 hours per stock
- Ongoing monitoring: 15-30 minutes per week
- Quarterly earnings reviews: 1 hour per stock
- Annual portfolio rebalancing: 2-4 hours
Stocks allow truly passive investing. You can buy index funds or blue-chip stocks, check them quarterly, and largely ignore daily volatility. This makes stocks ideal for busy professionals who don't want active management responsibilities.
Options Trading Time Requirements
Active Options Trading:
- Daily market checks: 15-30 minutes
- Position management: 30-60 minutes per week
- Rolling decisions: 15-30 minutes per position
- Expiration week management: 1-2 hours
- Screening for new opportunities: 30-60 minutes per week
Options demand more attention due to expiration dates and time decay. You can't simply buy and forget—positions require regular monitoring and decision-making about rolling, closing, or letting expire.
Systematic Approaches Reduce Time: Conservative strategies like the wheel can be systematized to 2-3 hours per week once you establish rules: target delta ranges, profit-taking levels, roll triggers, and stock selection criteria. Having clear rules eliminates decision paralysis and reduces time commitment.
Tax Implications: How the IRS Treats Each
Tax treatment differs between stocks and options, affecting your after-tax returns.
Stock Tax Treatment
Long-Term Capital Gains (held 1+ years):
- 0%, 15%, or 20% federal tax depending on income
- Significantly more favorable than ordinary income
- Encourages long-term holding
Short-Term Capital Gains (held <1 year):
- Taxed as ordinary income at your marginal rate
- 10-37% federal tax depending on income bracket
- Day traders pay the highest rates
Qualified Dividends:
- Taxed at long-term capital gains rates (0-20%)
- Provides tax-efficient income for buy-and-hold investors
Options Tax Treatment
Options taxation is more complex:
Options Held <1 year (most options):
- Taxed as short-term capital gains = ordinary income rates
- Premium collected from selling options is taxed as short-term gains
- No favorable long-term rates for typical options activity
Assigned Stock:
- Premium collected from puts adjusts your cost basis
- Premium collected from calls adjusts your sale proceeds
- Holding period starts at assignment for puts, original purchase date for calls
Wash Sale Rules:
- Apply to both stocks and options
- Selling and repurchasing within 30 days defers loss recognition
- More complex with options due to rolling strategies
Qualified Covered Calls:
- Can qualify for long-term capital gains treatment under specific conditions
- Must be held 1+ year and meet IRS strike price requirements
The higher tax rates on options income is a meaningful consideration. A 25% return trading options might be 15-18% after-tax, while a 25% long-term stock gain might be 21-23% after-tax depending on your bracket.
Complexity: Learning Curve and Skill Requirements
The knowledge required to trade successfully differs significantly between stocks and options.
Stock Trading Learning Curve
Basic Stock Investing:
- Understand company fundamentals (revenue, profit, growth)
- Read financial statements (P/E ratio, debt levels, margins)
- Grasp market cycles and economic indicators
- Learn portfolio diversification principles
- Develop emotional discipline for volatility
Time to Competency: 3-6 months of study and practice for basic buy-and-hold investing. Index fund investing can be learned in a few hours.
Resources: Abundant free resources including Investopedia, company annual reports, YouTube tutorials, and countless books.
Options Trading Learning Curve
Options Trading Requirements: Everything required for stock trading PLUS:
- Options mechanics (calls, puts, strike prices, expiration)
- The Greeks (delta, theta, gamma, vega) and their implications
- Implied volatility and IV rank/percentile
- Various strategies (covered calls, spreads, iron condors, wheels)
- Assignment mechanics and cost basis calculations
- Position sizing and risk management specific to options
- Broker platform navigation for options chains
Time to Competency: 6-12 months of study and practice for basic options strategies. Advanced strategies may take 1-2 years to master.
QuantWheel takes all these metrics together in a single rating by a custom formula - it differentiates the good from the bad. This gives you a clear indication on what's a good trade so that you can learn faster. Learn options trading faster with QuantWheel →
Resources: More fragmented learning process. Quality options education requires paid courses, trading communities like r/thetagang, and significant paper trading before risking capital.
The Assignment Learning Curve: One of the most confusing aspects for new options traders is understanding what happens when you get assigned. Your broker shows one cost basis, but your real cost basis after collecting premium is different. You need to track the premium from your original put sale, then adjust for any covered call premium collected before final exit. This is exactly the type of tedious tracking that breaks spreadsheets when you're managing 10+ positions simultaneously.
Liquidity: How Easily Can You Enter and Exit?
Liquidity—your ability to quickly enter and exit positions at fair prices—differs between stocks and options.
Stock Liquidity
Large-Cap Stocks:
- Extremely liquid with tight bid-ask spreads
- Can buy or sell $10,000+ instantly at market price
- Minimal price impact from your order
- Examples: Apple, Microsoft, Amazon, Tesla
Small-Cap Stocks:
- Less liquid with wider bid-ask spreads
- May experience slippage on larger orders
- Potentially difficult to exit quickly without price impact
For most retail traders buying established companies, stock liquidity is never a concern.
Options Liquidity
Options liquidity varies dramatically:
Highly Liquid Options (SPY, QQQ, AAPL, TSLA):
- Tight bid-ask spreads ($0.01-$0.05)
- Instant fills at mid-price or better
- Can trade multi-contract positions easily
Moderate Liquidity Options (many large-caps):
- Wider bid-ask spreads ($0.10-$0.30)
- May need to negotiate between bid and ask
- Multi-contract orders may get partial fills
Low Liquidity Options (small-caps, far-dated expirations):
- Wide bid-ask spreads ($0.50+)
- Difficult to get fair fills
- Can lose 2-5% to spreads on entry and exit
Options Liquidity Checklist: Before trading options on any stock, verify:
- Open interest above 100 contracts minimum
- Bid-ask spread under 5% of option price
- Daily volume suggesting active trading
- Weekly options available (indicates liquidity)
Liquidity matters more for options than stocks because you're often rolling positions, requiring multiple transactions where spreads compound your costs.
Market Conditions: When Each Thrives
Different market environments favor stocks or options depending on your strategy.
When Stocks Outperform
Bull Markets (Rising Prices): Stocks capture unlimited upside in rising markets. During multi-year bull runs like 2009-2020, simply holding stocks generated exceptional returns. No expiration dates mean you capture the entire move without timing concerns.
Recovery Markets: After crashes or corrections, stocks can rebound 30-50%+ as they recover to previous highs. Options with expiration dates might not capture the full recovery if timing is wrong.
Low Volatility Periods: When markets are calm and steadily rising, options premium becomes too small to generate meaningful income. Stock ownership captures the steady appreciation more efficiently.
When Options Strategies Excel
High Volatility Markets: When implied volatility spikes (VIX above 25-30), options premium becomes extremely lucrative. Selling cash-secured puts during panic can generate 5-10% monthly returns, far exceeding typical stock returns.
Sideways/Range-Bound Markets: When stocks trade in ranges for months, stock holders make nothing. Options sellers collect premium monthly regardless, generating 2-3% monthly income even when stocks go nowhere.
Moderate Downtrends: Strategies like the wheel can remain profitable in modest downtrends. Collecting 2% monthly premium provides a cushion against 5-10% annual stock declines that hurt buy-and-hold investors.
Earnings Seasons: Implied volatility spikes before earnings announcements. Selling puts or calls before earnings can generate outsized premium, though with corresponding risk.
The ideal approach might be combining both: hold core stock positions for long-term growth, while selling options on other positions or cash to generate income during volatile periods.
Which Should You Choose? Decision Framework
The right choice between options vs stocks depends on your specific situation, goals, and constraints.
Choose Stocks If You:
- Have limited time (less than 2 hours weekly for active management)
- Prefer simplicity and ease of understanding
- Want truly passive investments that don't require monitoring
- Prioritize long-term wealth building over current income
- Invest through retirement accounts with limited options approval
- Prefer the psychological comfort of ownership with no expiration
- Want favorable long-term capital gains tax treatment
- Don't want to learn complex concepts like Greeks and implied volatility
Ideal Stock Investor Profile: Working professional with 20+ year time horizon, maxing out 401(k) and IRA, buying index funds or blue-chip stocks quarterly, checking portfolio monthly, comfortable with volatility knowing time is on their side.
Choose Options If You:
- Can dedicate 2-3 hours weekly to active position management
- Want more capital efficiency and leverage
- Seek current income generation rather than only price appreciation
- Have smaller account size ($5,000-$25,000) but want diversification
- Enjoy learning complex strategies and ongoing education
- Prefer defined-risk strategies and strategic flexibility
- Can maintain emotional discipline during assignment and volatility
- Are willing to track positions systematically and adjust as needed
Ideal Options Trader Profile: Trader with 2-5 hours weekly available, interested in systematic income strategies like the wheel, comfortable with assignment mechanics, maintains disciplined position sizing, uses tools or spreadsheets to track multiple positions, focuses on high-quality underlying stocks.
Consider Combining Both
Many successful traders use both:
Core-Satellite Approach:
- Core: 60-70% in long-term stock holdings (index funds, retirement accounts)
- Satellite: 30-40% deploying options strategies for income and leverage
This balanced approach provides:
- Long-term wealth building through stock appreciation
- Current income and enhanced returns through options premium
- Tax advantages from long-term stock holdings
- Capital efficiency and diversification through options
- Reduced overall portfolio correlation
Getting Started: Action Steps for Each Path
Ready to begin? Here's how to start with stocks or options depending on your choice.
Starting with Stocks: First Steps
- Open a Brokerage Account: Choose from Fidelity, Schwab, or Vanguard for commission-free stock trading
- Fund Your Account: Transfer $2,000-$10,000 to start (more if possible)
- Research Quality Companies: Focus on profitable companies with strong balance sheets and ask around
- Start Small: Buy 1-2 positions initially while learning
- Buy Index Funds: Consider S&P 500 index fund (SPY, VOO) for instant diversification
- Set Calendar Reminders: Check positions quarterly, rebalance annually
- Continue Learning: Read "The Intelligent Investor" and follow quality financial sites
Starting with Options: First Steps
- Learn Fundamentals: Spend 2-3 months learning options mechanics before trading real money
- Paper Trade: Practice with virtual money for 30-60 days minimum
- Open Approved Account: Apply for Level 2 options approval (cash-secured puts and covered calls)
- Start Small: Begin with 1-2 positions using high-quality, liquid stocks
- Focus on One Strategy: Master cash-secured puts OR covered calls before expanding
- Join Trading Community: r/thetagang on Reddit provides valuable learning and support
- Track Religiously: Maintain spreadsheet or use dedicated software to track cost basis through full cycles
- Set Clear Rules: Define entry criteria, profit targets, and roll triggers before trading
The Tracking Challenge: Once you're managing 5-10 options positions simultaneously, manual tracking becomes overwhelming. This is where dedicated options tracking becomes essential. Whether you use detailed spreadsheets or a platform like QuantWheel, you need systematic ways to track: current positions, upcoming expirations, cost basis adjustments through assignments, premium collected across full wheel cycles, win rates, and portfolio-level risk metrics. Why? Because tracking these things helps you minimize future mistakes. This infrastructure becomes as important as the strategy itself.
Common Mistakes to Avoid
Learning from others' mistakes saves time and capital. Avoid these common errors regardless of which path you choose.
Stock Trading Mistakes
- Panic Selling: Selling during crashes locks in losses; volatility is normal
- Chasing Performance: Buying last year's winners often leads to poor returns
- Over-Diversification: Owning 50 stocks means you can't know any of them well
- Ignoring Fees: Frequent trading generates unnecessary costs and taxes
- No Exit Plan: Buying without knowing when you'll sell leads to poor decisions
Options Trading Mistakes
- Starting Too Complex: Jumping to advanced strategies before mastering basics
- Buying Options: Most beginners buy calls/puts and lose to time decay; selling is more consistent
- Poor Position Sizing: Risking too much on single positions creates catastrophic losses
- Ignoring Liquidity: Trading illiquid options loses money to wide bid-ask spreads
- No Cost Basis Tracking: Losing track of real profitability through full wheel cycles
- Emotional Rolling: Rolling losing positions indefinitely hoping for recovery
- Neglecting Underlying Quality: Selling options on poor-quality stocks leads to permanent capital loss
The biggest mistake is diving in before proper education. Both stocks and options require foundational knowledge before risking real capital.
Conclusion: Options vs Stocks for Your Goals
Both options and stocks can build wealth and generate returns, but they serve different purposes and suit different trading styles.
Stocks excel at: Long-term wealth building, simplicity, passive income through dividends, favorable tax treatment, and unlimited holding periods allowing recovery from downturns.
Options excel at: Capital efficiency, income generation, strategic flexibility, defined-risk approaches, and enhanced returns during high-volatility periods.
The right choice depends on your time availability, risk tolerance, capital size, learning commitment, and financial goals. Many successful traders ultimately incorporate both into diversified portfolios, using stocks for long-term growth and options for tactical income generation.
Whichever path you choose, start small, prioritize education, and develop systematic approaches before scaling up. Both require discipline, patience, and ongoing learning to master.
Risk Disclosure
Options trading involves substantial risk and is not suitable for all investors. Past performance does not guarantee future results. This content is for educational purposes only and should not be considered investment advice. Always do your own research and consider consulting with a financial advisor before making investment decisions.
The examples used in this article are for educational purposes only and are not recommendations to buy or sell any security. All investment decisions should be based on your own analysis and risk tolerance.