If you've ever looked at an options chain and wondered why a put 10 strikes away costs $2.50 while another costs $0.80, you're asking the right question. Options pricing isn't random—it follows mathematical models that account for risk, time, and market expectations.
Understanding how options are priced helps you make smarter decisions when selling cash-secured puts, covered calls, or running the wheel strategy. You'll know when premiums are attractive, when to avoid trades, and how time decay works in your favor.
QuantWheel can help you pick better trades. It does that by taking into account premium, greeks, volatility, technicals, fundamentals, news outlooks, GEX and everything else into a single rating.
TLDR: Options Pricing Explained Simply
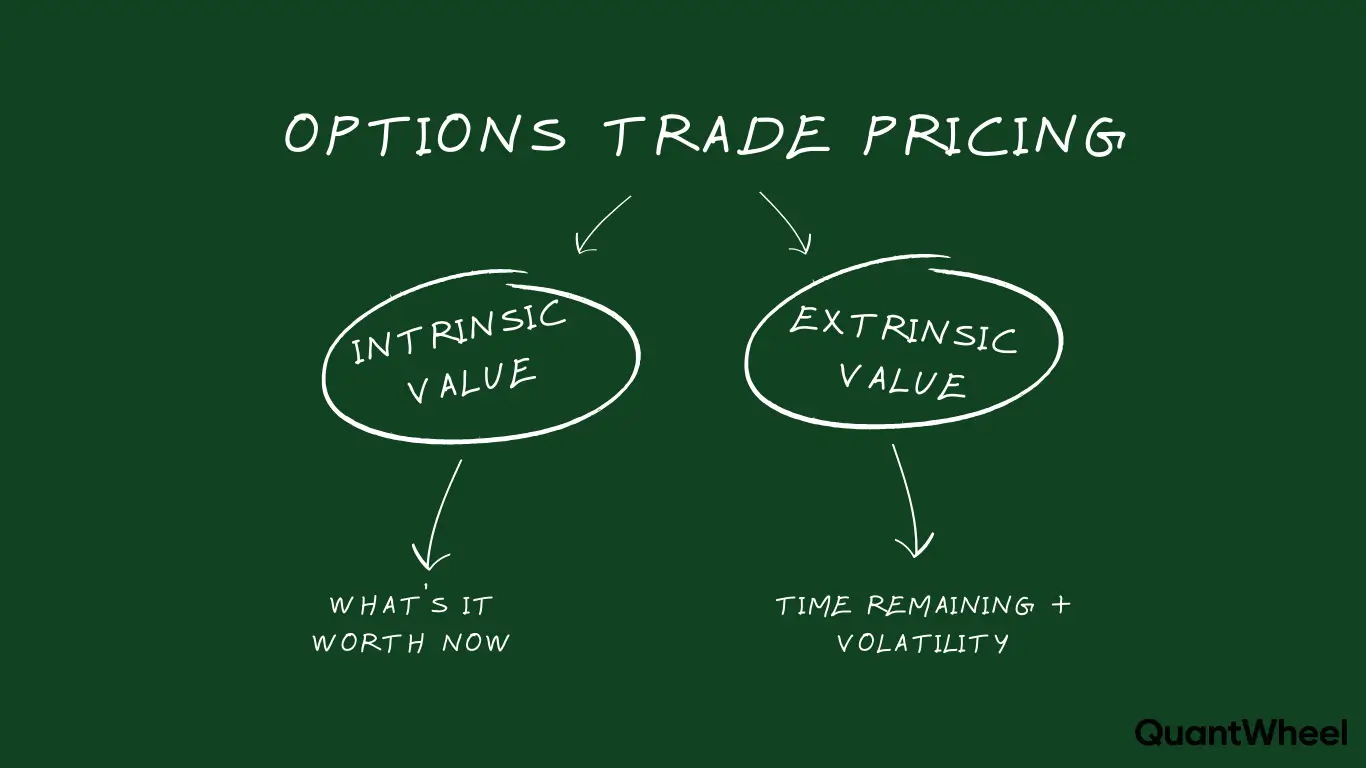
Options have two types of value: intrinsic value and extrinsic value. Intrinsic value is profit you could lock in right now by exercising (zero for out-of-the-money options). Extrinsic value is the extra premium traders pay for time and potential future movement.
Six factors determine option prices: stock price, strike price, time until expiration, implied volatility (expected stock movement), interest rates, and dividends.
The Black-Scholes model is the most common pricing formula, though traders rarely calculate it manually. Your broker shows you the results.
Time decay (Theta) works in sellers' favor. Every day that passes, options lose value if the stock doesn't move, which is why wheel strategy traders target selling options 30-45 days out when decay accelerates.
Example: You sell a $50 cash-secured put on a $52 stock for $2.00 premium. The option has zero intrinsic value (stock is above strike) and $2.00 extrinsic value. As 30 days pass, if the stock stays above $50, that $2.00 erodes to zero and you keep it all. That's how options pricing creates opportunity for sellers.
The Two Components of Options Pricing
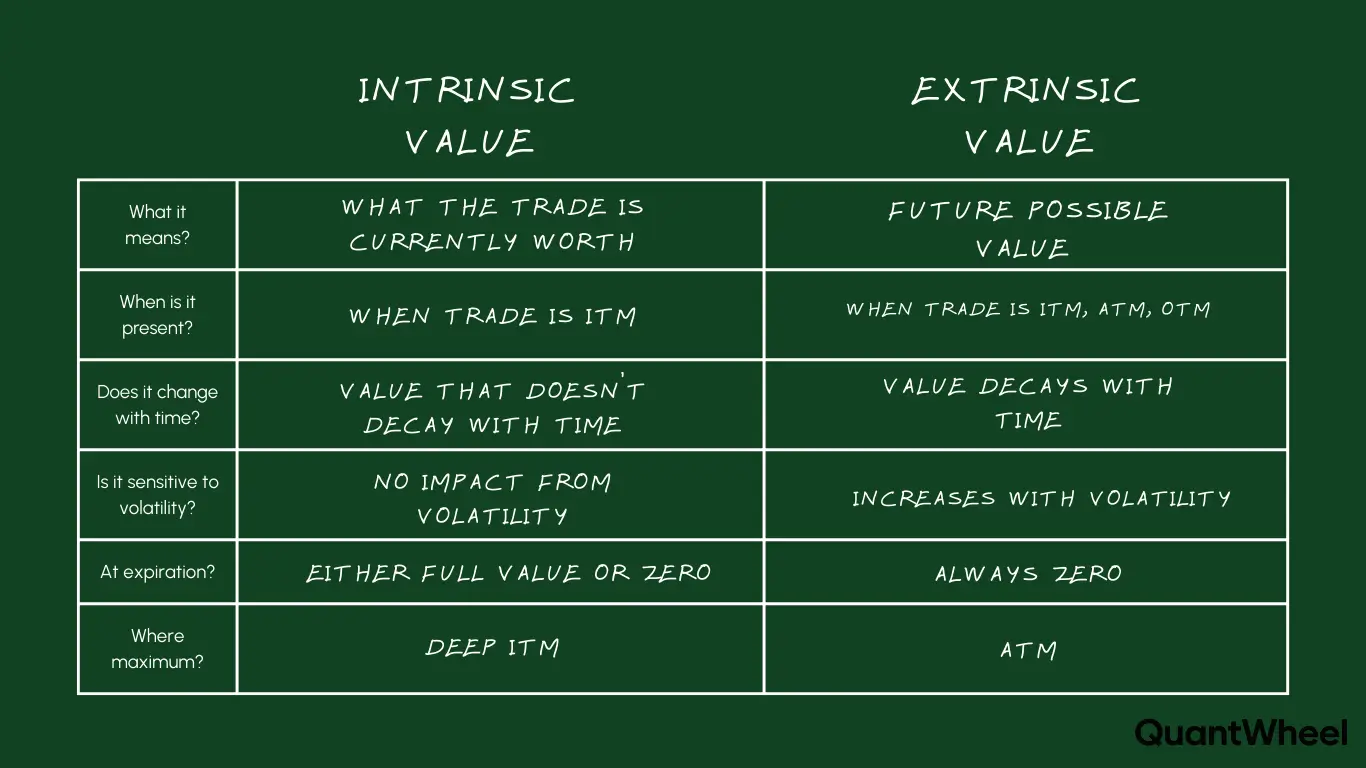
Every option price breaks down into two parts: intrinsic value and extrinsic value. Understanding this split is fundamental to options trading.
Intrinsic Value: What's Guaranteed Right Now
Intrinsic value is the amount of profit you'd lock in if you exercised the option immediately. It's the "in-the-money" portion.
For call options: Stock price minus strike price (if positive)
- Stock at $55, call strike $50 → Intrinsic value = $5.00
For put options: Strike price minus stock price (if positive)
- Stock at $48, put strike $50 → Intrinsic value = $2.00
Out-of-the-money options have zero intrinsic value because exercising them would create an immediate loss. When you sell a cash-secured put below the current stock price, it starts with zero intrinsic value—meaning the entire premium is extrinsic value you're collecting.
Extrinsic Value: The Time and Volatility Premium
Extrinsic value (also called time value) is everything beyond intrinsic value. It represents:
- Time until expiration: More time = more premium
- Volatility expectations: Higher expected movement = more premium
- Probability of profit: Greater chance the option goes in-the-money = more premium
Options with 45 days until expiration have more extrinsic value than options with 7 days, even at the same strike. This is why wheel strategy traders prefer selling options 30-45 days out—you capture significant premium while benefiting from accelerating time decay.
Extrinsic value always decays to zero by expiration. If you sell a put for $2.00 and the stock stays above your strike, that entire $2.00 is profit from extrinsic value erosion.
The Black-Scholes Model: How Wall Street Prices Options
The Black-Scholes model, developed in 1973, is the foundational pricing formula still used today (with modifications). While you don't need to calculate it manually—your broker's platform does it automatically—understanding the inputs helps you evaluate trades.
The Six Pricing Factors
1. Current Stock Price The most obvious factor. As the stock price rises, calls become more valuable and puts become less valuable.
2. Strike Price Your chosen price for the option contract. The further out-of-the-money (OTM), the cheaper the option, but the lower the probability it expires in-the-money.
3. Time Until Expiration More time = more premium. But time decay accelerates as expiration approaches. Options lose about 50% of their extrinsic value in the final 30 days, which is exactly when wheel traders want to be sellers.
4. Implied Volatility (IV) The market's expectation of future stock movement. High IV means expensive options; low IV means cheap options. Wheel strategy traders hunt for high-IV opportunities because premiums are juicier.
5. Risk-Free Interest Rate Usually Treasury yields. Higher rates slightly increase call values and decrease put values. In practice, this has minimal impact on short-term options.
6. Expected Dividends Upcoming dividend payments decrease call values and increase put values because stocks typically drop by the dividend amount on ex-dividend date.
How the Model Works (Simplified)
Black-Scholes calculates the probability the option finishes in-the-money, then applies that probability to the potential payoff, adjusted for time value of money.
For a $50 put on a $52 stock:
- Calculate the probability the stock drops below $50 by expiration
- Estimate the average amount it would be below $50 if it gets there
- Discount that expected value back to present value
- Add extrinsic value for time and volatility
The result is the "fair value" premium. Market forces (supply and demand) create small deviations, but prices generally hover around the model output.
The Greeks: Measuring Price Sensitivity
The Greeks measure how option prices respond to changes in underlying factors. For wheel strategy traders, these aren't just academic—they guide strike selection, timing, and position management.
Delta: Price Movement Sensitivity
What it measures: How much the option price changes for a $1 move in the stock. Range: 0 to 1.00 for calls, 0 to -1.00 for puts Example: A put with -0.30 delta loses $0.30 in value if the stock rises $1.
Practical use: Delta approximates probability of expiring in-the-money. A put with -0.30 delta has roughly 30% chance of finishing ITM. Many wheel traders target 0.20-0.30 delta for cash-secured puts—balancing premium collection with manageable assignment risk.
When you get assigned on a put and start selling covered calls, you might target 0.30 delta calls to collect decent premium while giving yourself room for stock appreciation.
Gamma: Delta's Rate of Change
What it measures: How much delta changes for a $1 stock move. Why it matters: High gamma means delta accelerates quickly as the stock moves.
Gamma is highest for at-the-money options near expiration. This is why positions can suddenly swing from "probably expiring worthless" to "definitely getting assigned" in the final week.
For wheel traders, gamma is less critical than for day traders, but understanding it helps you anticipate when positions might flip from safe to risky.
Theta: Time Decay (Your Best Friend as a Seller)
What it measures: How much the option loses value per day, all else equal. Range: Always negative for long options, positive for short options Example: Theta of -0.05 means the option loses $5 in value per day (per contract).
This is THE Greek for wheel strategy traders. Every day you're short an option, theta works in your favor. You collected $200 premium upfront, and each day that passes, the option's value erodes—putting profit in your pocket without the stock moving.
Theta accelerates in the final 30-45 days before expiration, which is exactly when wheel traders sell options. You capture maximum time decay without holding too close to expiration when gamma risk spikes.
Here's where most wheel traders struggle: calculating theta across 15+ positions manually. Your broker shows theta per option, but aggregating portfolio-level theta—especially after assignments—becomes a spreadsheet nightmare. Platforms like QuantWheel automatically track portfolio theta and show your daily expected profit from time decay across all positions.
Vega: Volatility Sensitivity
What it measures: How much the option price changes for a 1% move in implied volatility. Example: Vega of 0.15 means the option gains $15 in value if IV increases by 1%.
Practical use: When you sell options, you're short vega—volatility increases hurt you, decreases help you. This is why wheel traders target high-IV stocks: you sell when IV is elevated, then profit as IV normalizes and option prices deflate.
The day after earnings announcements, IV often "crushes"—dropping sharply. If you sold puts before earnings, IV crush accelerates your profit as extrinsic value evaporates.
Rho: Interest Rate Sensitivity
What it measures: How much the option price changes for a 1% change in interest rates. Practical reality: Rho barely matters for short-term options. A 30-day option won't change much even if interest rates jump.
Wheel traders can safely ignore rho unless you're trading LEAPS (long-term options), which you probably aren't.
Implied Volatility: The Premium Driver
Implied volatility (IV) is the single biggest factor determining whether option premiums are attractive. Understanding IV helps you find the best wheel strategy opportunities.
What IV Actually Means
IV represents the market's expectation of how much the stock will move over the next year, expressed as an annualized percentage. A stock with 40% IV is expected to stay within +/- 40% of its current price over the next year (roughly).
Higher IV = higher option premiums. Lower IV = lower premiums.
Important: IV is forward-looking. It's not based on past volatility (that's "historical volatility"). IV is extracted from current option prices—it's what the market is pricing in.
IV Rank and IV Percentile: Finding High-Premium Opportunities
Raw IV numbers are hard to interpret without context. Is 35% IV high or low? It depends on the stock.
IV Rank compares current IV to the past year's IV range:
- IV Rank of 80 means current IV is in the 80th percentile of the past year
- High IV Rank (60-100) signals expensive options—good for selling
- Low IV Rank (0-30) signals cheap options—not ideal for premium collection
Wheel strategy traders hunt for stocks with IV Rank above 50-60. You're selling options when they're expensive relative to that stock's normal pricing, increasing your edge.
The IV Crush "Phenomenon"
After earnings announcements or major news events, IV often collapses—called "IV crush." If you're short options (like wheel traders), this is excellent. The option prices deflate rapidly as uncertainty resolves.
Example: Before earnings, a $50 put might cost $2.50 with 60% IV. After earnings (assuming the stock doesn't move much), that same put might drop to $1.80 as IV crushes to 40%. If you sold the put for $2.50, you've already captured significant profit from IV decline alone.
This is one reason experienced wheel traders sometimes sell puts into earnings on stocks they're willing to own—the IV spike creates exceptional premiums.
Time Decay in Action: Why Options Lose Value
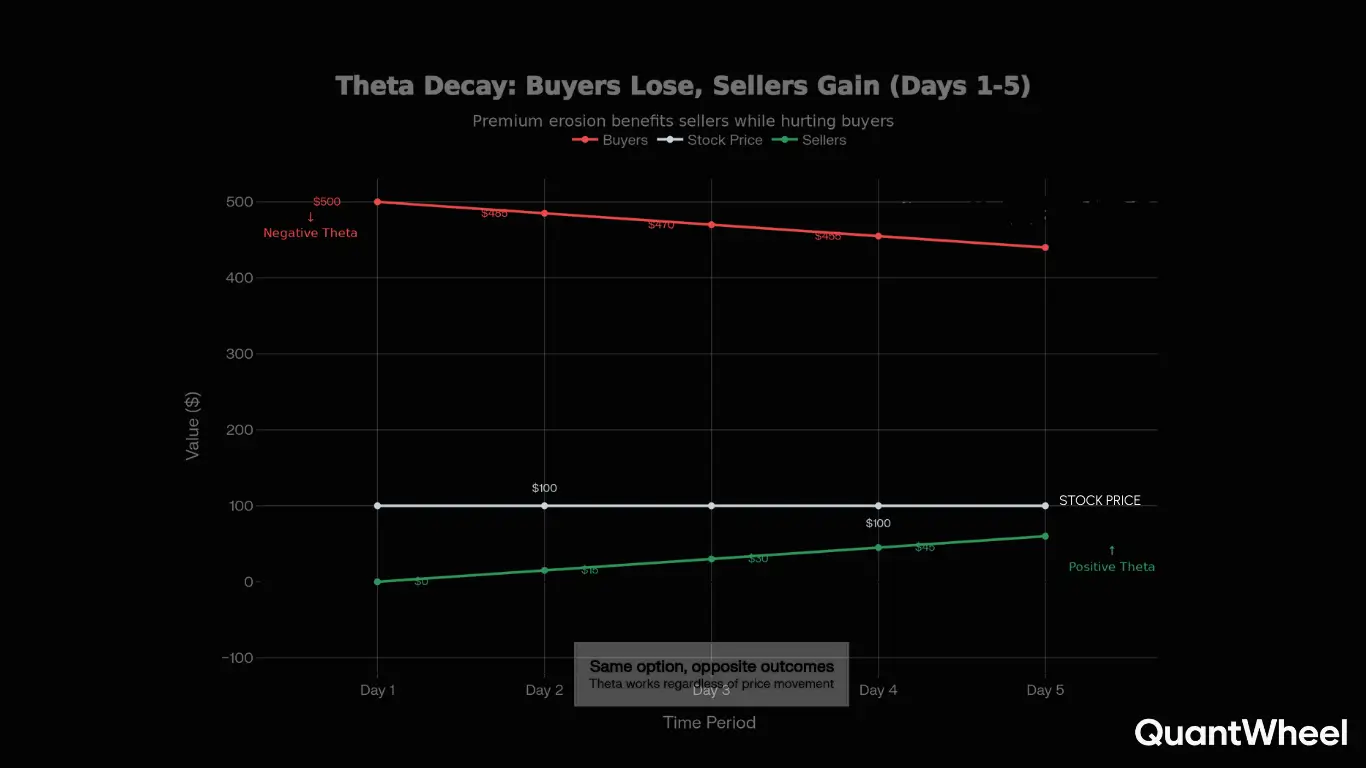
Time decay (theta) is the primary profit driver for wheel strategy traders. Let's see exactly how it works.
The Decay Curve: Non-Linear Acceleration
Options don't lose value evenly over time. Decay accelerates as expiration approaches.
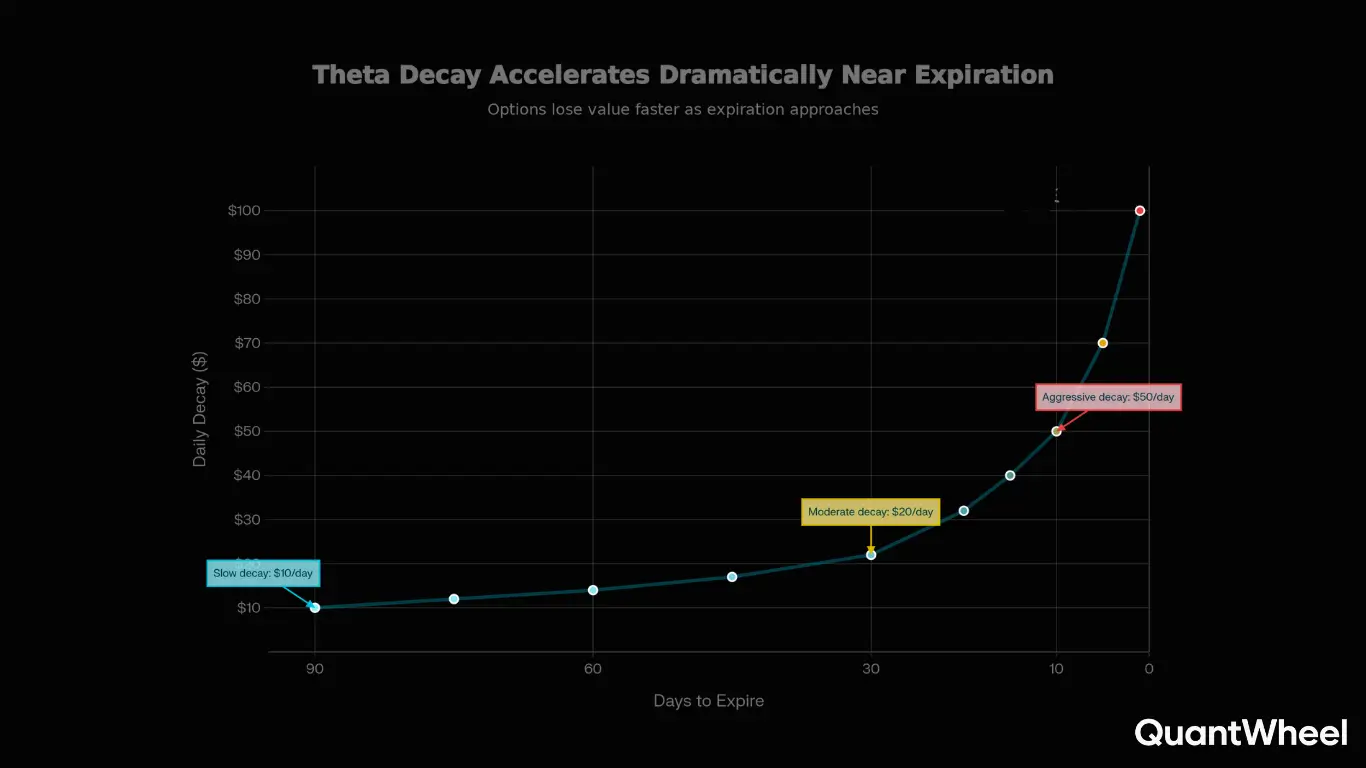
Rough breakdown:
- 90 days out: Slow, steady decay (~10% of value)
- 60 days out: Moderate decay (~20% of value)
- 30 days out: Fast decay (~30% of value)
- 0-15 days out: Extremely fast decay (~40% of remaining value)
This is why selling options 30-45 days out is optimal for wheel traders. You capture the accelerating decay without holding into the chaotic final week when gamma risk spikes.
Example: 45-Day vs 15-Day Puts
Stock: $50
Strike: $48 put (out-of-the-money)
| Days to Expiration | Option Price | Daily Decay |
|---|---|---|
| 45 days | $1.50 | -$0.03/day |
| 30 days | $1.05 | -$0.04/day |
| 15 days | $0.60 | -$0.05/day |
| 5 days | $0.25 | -$0.05/day |
Notice how the rate of decay (daily loss) increases as expiration nears. If you sold the put at 45 days for $1.50 and closed it at 15 days for $0.60, you'd capture $0.90 profit (60% of max profit) while only holding halfway to expiration.
Many wheel traders follow the "50% profit rule"—close positions when you've captured half the premium, then redeploy capital into a new trade. This optimizes the balance between theta capture and capital efficiency.
How Strike Selection Affects Pricing
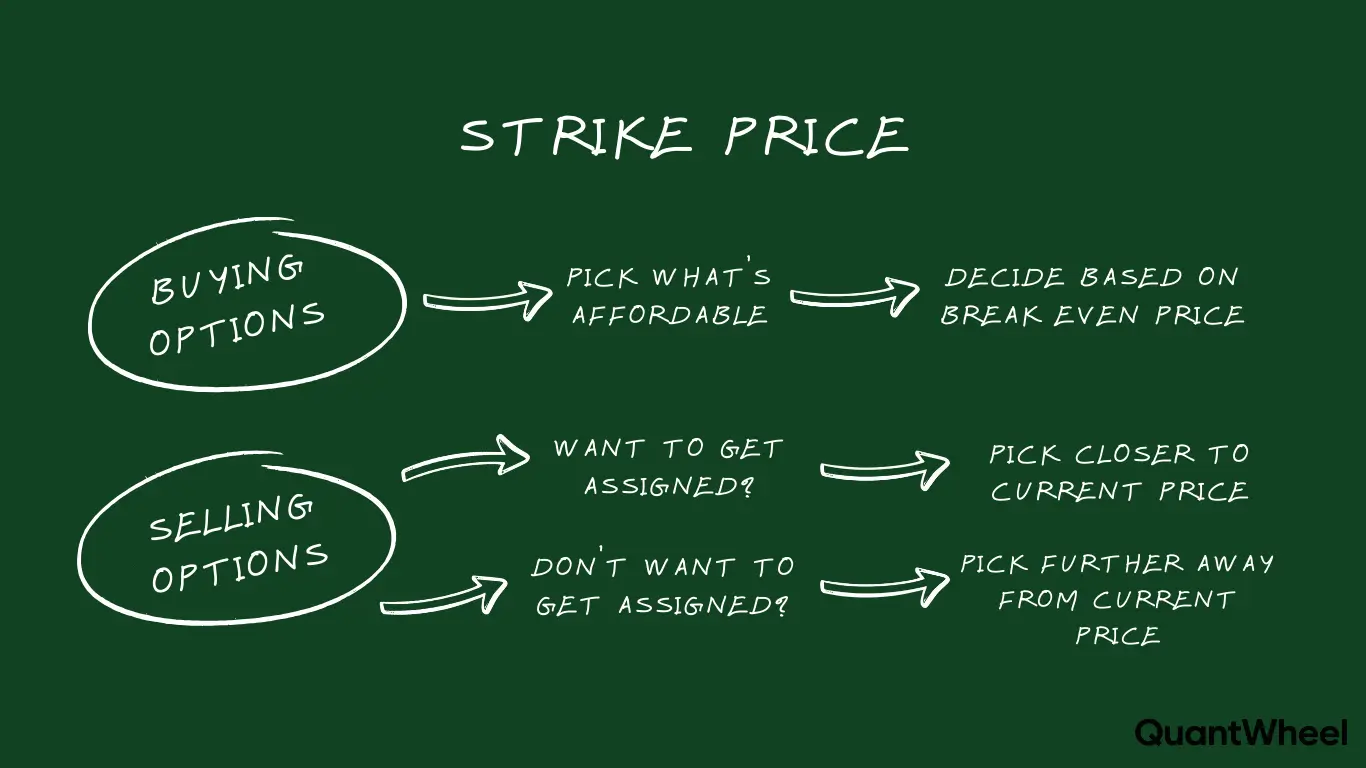
Choosing the right strike is where options pricing meets strategy. Let's compare strikes to see pricing in action.
Stock trading at $52
| Strike | Delta | Premium | Intrinsic | Extrinsic | Assignment Probability |
|---|---|---|---|---|---|
| $55 put | -0.10 | $0.50 | $0 | $0.50 | ~10% |
| $50 put | -0.20 | $1.20 | $0 | $1.20 | ~20% |
| $48 put | -0.30 | $1.80 | $0 | $1.80 | ~30% |
| $45 put | -0.40 | $2.50 | $0 | $2.50 | ~40% |
Trade-offs:
- Higher strikes (closer to stock price): More premium, higher assignment probability, better return on capital
- Lower strikes (further OTM): Less premium, lower assignment probability, more "insurance" feel
Wheel strategy traders typically target 0.20-0.30 delta puts. This balances meaningful premium collection with manageable assignment risk on stocks you actually want to own.
After assignment, when selling covered calls, you might choose:
- Higher delta (0.30-0.40): More premium, but higher chance stock gets called away before you've captured much upside
- Lower delta (0.10-0.20): Less premium, but stock has more room to run while you collect dividends and appreciation
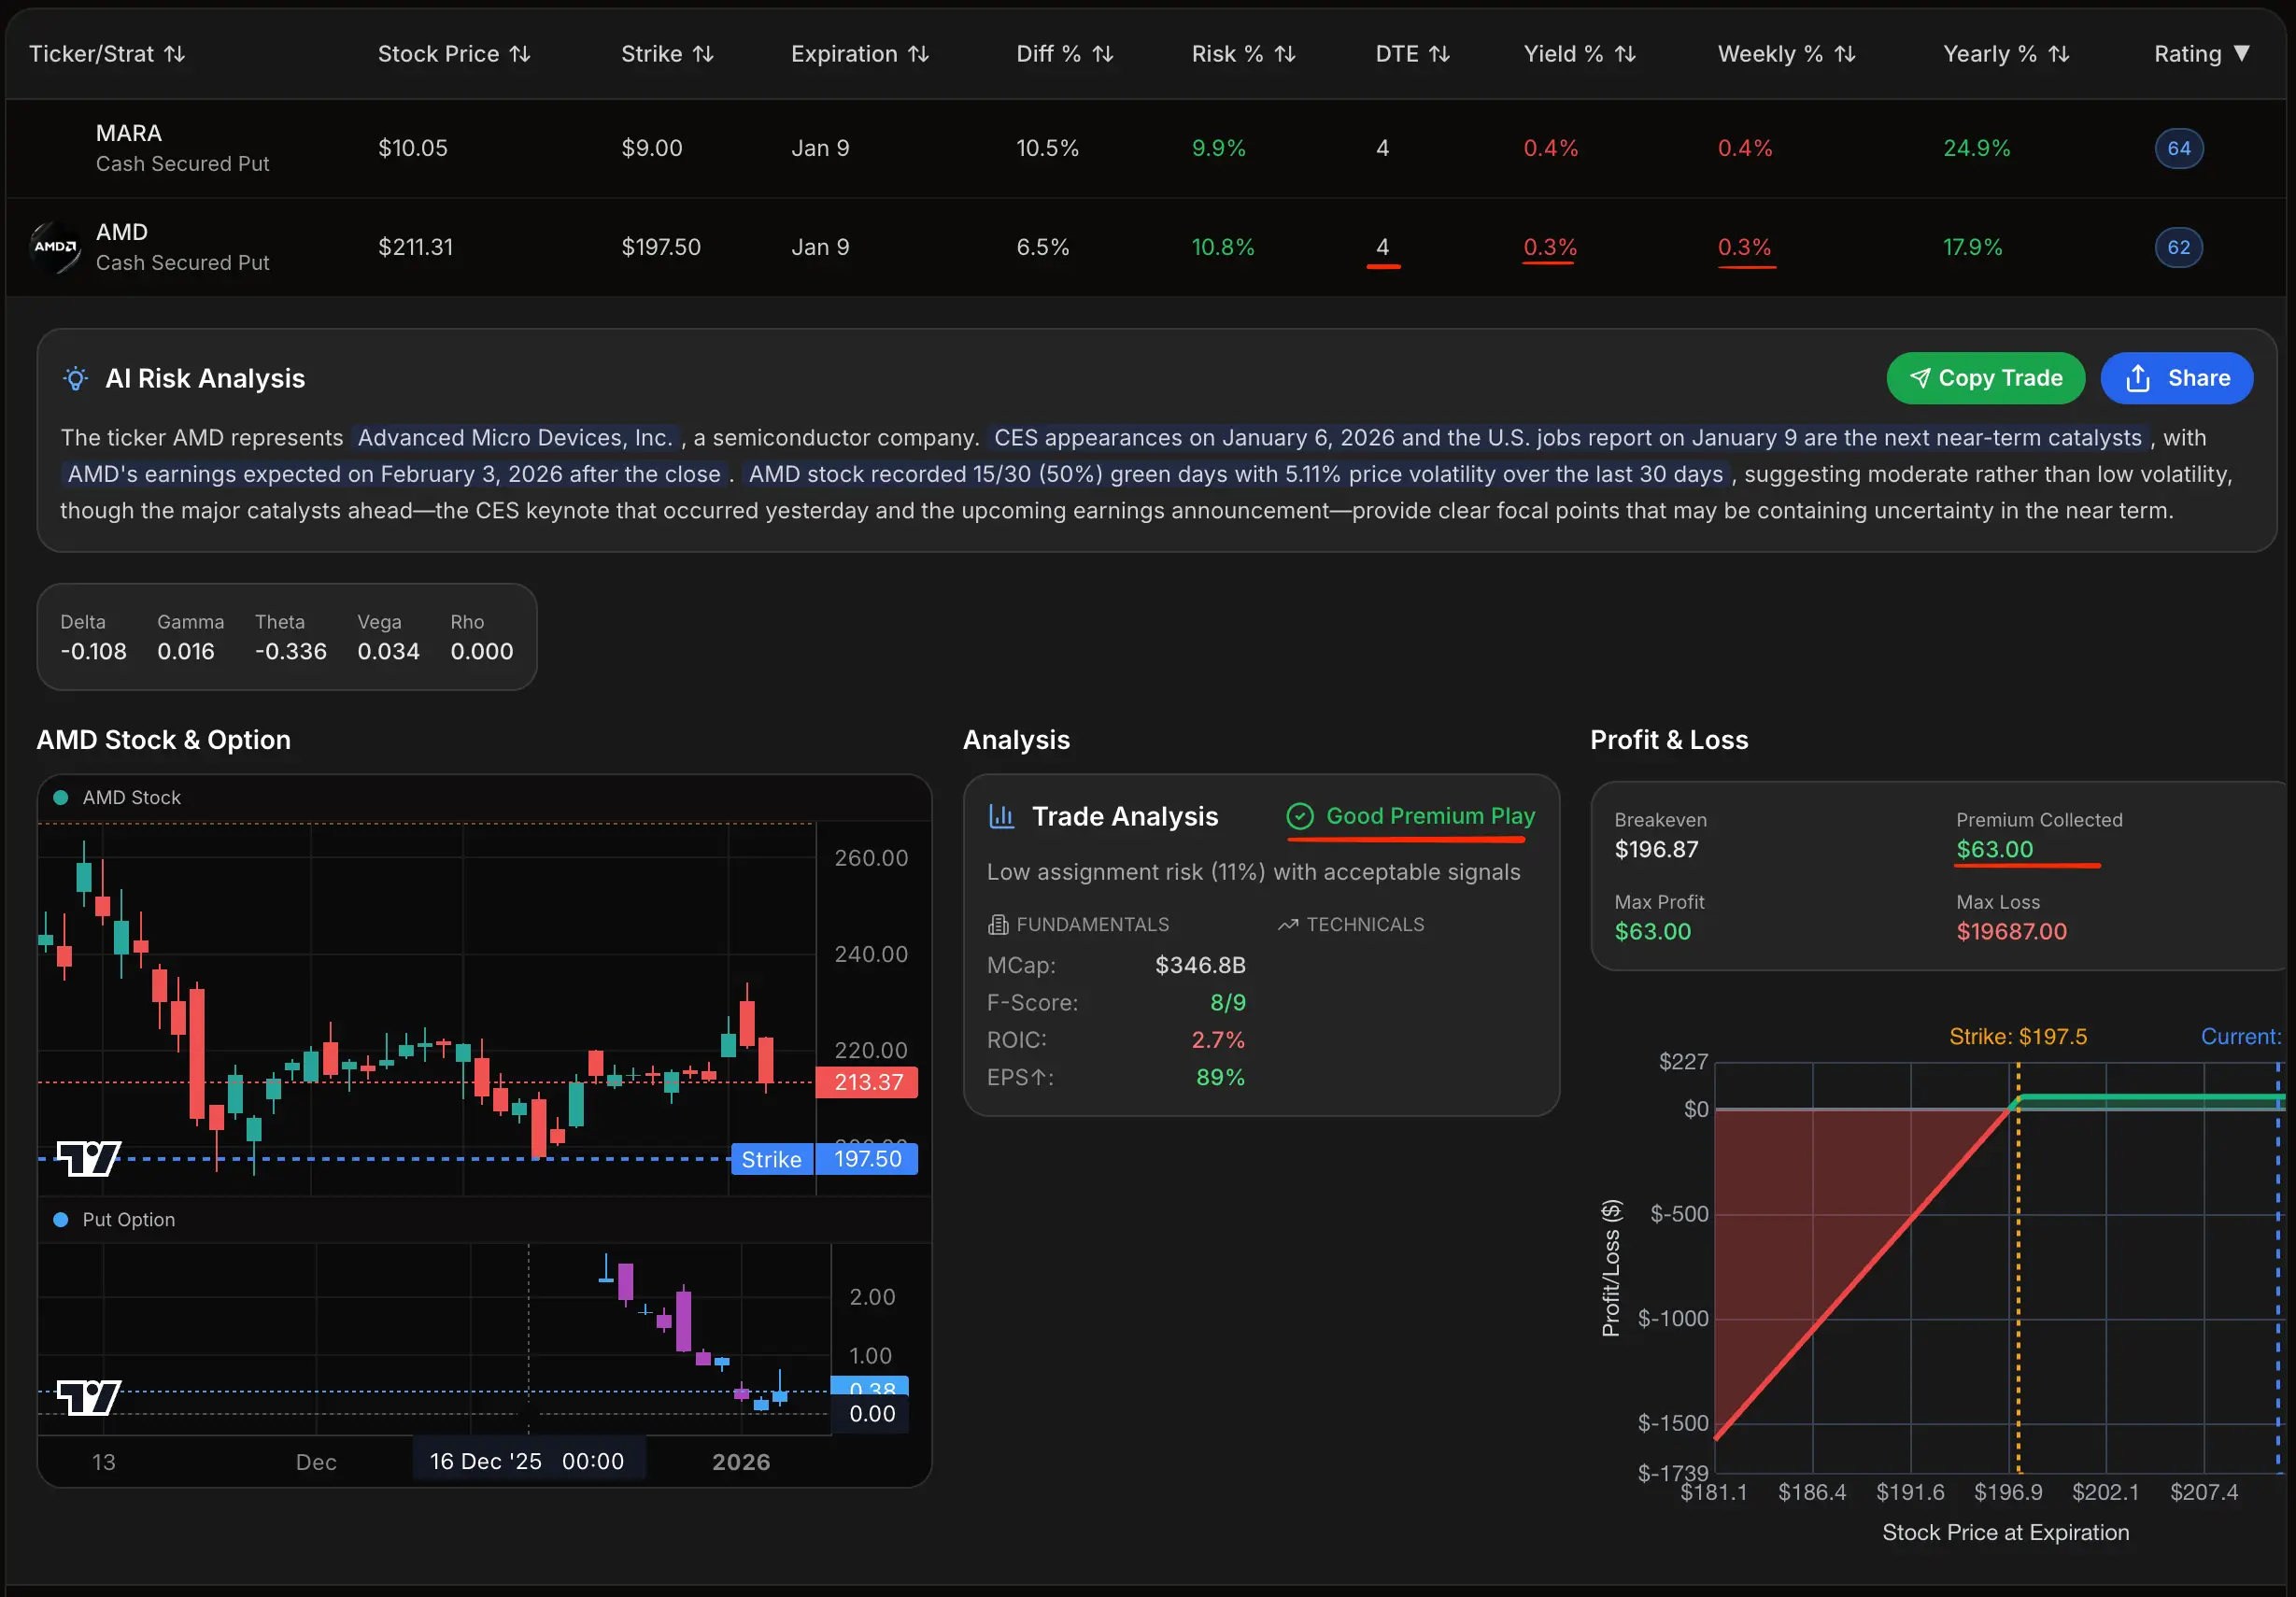
Practical Application: Evaluating a Real Trade
Let's walk through pricing analysis on an actual wheel strategy trade.
Setup:
- Stock: PLTR trading at $18.50
- IV Rank: 68 (elevated—good for selling)
- Trade: Sell $17 put, 35 days to expiration
Options chain shows:
- Premium: $0.85 per share ($85 per contract)
- Delta: -0.28
- Theta: -0.03 (-$3/day decay)
- Vega: 0.08
Analysis:
Intrinsic value: Zero (stock above strike)
Extrinsic value: $0.85 (entire premium is time value)
Probability of assignment: ~28% (delta approximation)
Break-even: $17.00 - $0.85 = $16.15
Daily profit from theta: $3/day if stock stays above $17
Return calculation:
- Premium collected: $85
- Capital at risk: $1,700 (strike × 100 shares)
- Return: 5% over 35 days
- Annualized: ~52% (though you won't sustain this rate)
Decision: Premium looks attractive given 68 IV Rank. The $17 strike is 8% below current price, providing cushion. 28% assignment probability feels manageable on a stock you're willing to own. Theta of $3/day means you're earning meaningful time decay.
This is the kind of analysis wheel traders do before entering every position. When you're managing 10-15 positions, calculating this manually for every potential trade becomes tedious. QuantWheel's screener automatically filters for high-IV opportunities, calculates returns, and ranks trades by attractiveness—letting you focus on execution instead of spreadsheet work.
Common Options Pricing Mistakes to Avoid
Mistake 1: Ignoring Implied Volatility Context
Selling a $2.00 premium sounds great, but if that stock's IV Rank is 10, you're selling cheap options. That same stock might offer $3.50 premium when IV Rank is 75. Always check IV context before committing capital.
Mistake 2: Chasing Premium Without Considering Assignment
A $45 strike put on a $46 stock might pay $2.00, but your assignment probability is extremely high. Yes, the premium looks juicy, but you're almost certainly buying the stock. Make sure you actually want to own it at that price.
Mistake 3: Holding Too Close to Expiration
The final week before expiration is when gamma risk explodes. Positions that seemed safe can swing wildly. Most experienced wheel traders close or roll positions with 7-21 days left, capturing most of the theta while avoiding late-stage chaos.
Mistake 4: Not Accounting for Earnings
Earnings announcements create IV spikes (good for sellers) but also genuine risk. Stocks can gap 10-15% overnight. If you're selling puts into earnings, make absolutely certain you're willing to own the stock at your strike, because assignment probability is elevated.
Mistake 5: Forgetting About Cost Basis After Assignment
Here's where options pricing meets real-world accounting. You sold a $50 put for $2.00 premium and got assigned. Your broker shows your cost basis as $50, but your actual cost is $48 ($50 strike - $2 premium collected).
When you sell covered calls afterward, you need to track your adjusted cost basis to know your real profit potential. If the stock is at $49 and you sell a $50 call, you're not risking much upside—you'd still profit $2 per share ($50 call strike - $48 adjusted basis).
Most brokers don't automatically adjust cost basis for premiums collected, so you're stuck tracking this manually in spreadsheets. Unless you're using a wheel-specific platform like QuantWheel that automatically adjusts cost basis on assignment, tracking full-cycle profit through puts → assignment → calls → exit becomes a manual nightmare across multiple positions.
How QuantWheel Uses Options Pricing Data
Understanding options pricing is one thing. Applying it across a portfolio of 10-15 positions while tracking cost basis, theta decay, and IV changes is another challenge entirely.
QuantWheel's screener uses real-time options pricing to:
- Filter for high-IV opportunities: Find stocks with IV Rank above your threshold
- Calculate accurate returns: Show expected return, break-even, and risk metrics before you trade
- Track portfolio theta: Aggregate time decay across all positions, showing daily expected profit
- Monitor cost basis: Automatically adjust when you get assigned, so you know real profit/loss
- Alert on IV changes: Notify when IV spikes create selling opportunities or when IV crash offers early close opportunities
The platform handles the math so you can focus on finding good stocks and managing positions. Because in the end, options pricing isn't something to calculate by hand—it's information to use for smarter trading decisions.
Key Takeaways
Options pricing combines intrinsic value (immediate profit if exercised) and extrinsic value (time and volatility premium that decays).
Six factors determine prices: stock price, strike price, time to expiration, implied volatility, interest rates, and dividends. The Black-Scholes model processes these inputs to calculate fair value.
The Greeks measure price sensitivity—with Theta (time decay) being most critical for wheel strategy traders who profit from extrinsic value erosion.
Implied volatility drives premium size. High-IV stocks offer attractive premiums for sellers, especially when IV Rank is above 50-60.
Time decay accelerates in the final 30-45 days before expiration, which is exactly when wheel traders sell options to maximize theta capture.
Strike selection balances premium collection with assignment probability. Most wheel traders target 0.20-0.30 delta puts for cash-secured puts.
Understanding options pricing helps you evaluate trades, find opportunities, and avoid common mistakes like selling cheap options or holding too close to expiration.
The real challenge isn't understanding pricing theory—it's applying these concepts across a live portfolio while managing cost basis, tracking theta, and identifying new opportunities. That's where purpose-built tools make the difference between manual spreadsheet chaos and systematic, scalable trading.
Risk Disclosure
Options trading involves substantial risk and is not suitable for all investors. Past performance does not guarantee future results. This content is for educational purposes only and should not be considered investment advice. Always do your own research and consider consulting with a financial advisor before making investment decisions.
The examples used in this article are for educational purposes only and are not recommendations to buy or sell any security. All investment decisions should be based on your own analysis and risk tolerance.