Author: David Romic – retail options trader and active member in the options trading communities on Reddit (u/thedavidromic).
I share wheel strategy setups, trade management, and lessons learned from real positions.
If you haven’t read the fundamentals yet, start with our Options Greeks Guide first. This article assumes you already know what each Greek measures individually.
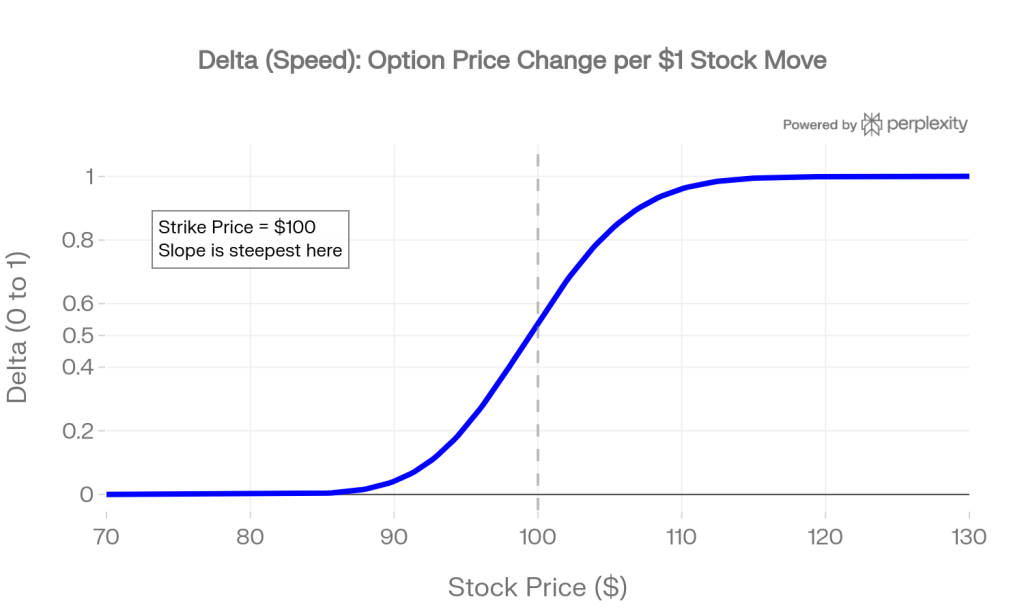
The Delta-Gamma Relationship: Speed and Acceleration
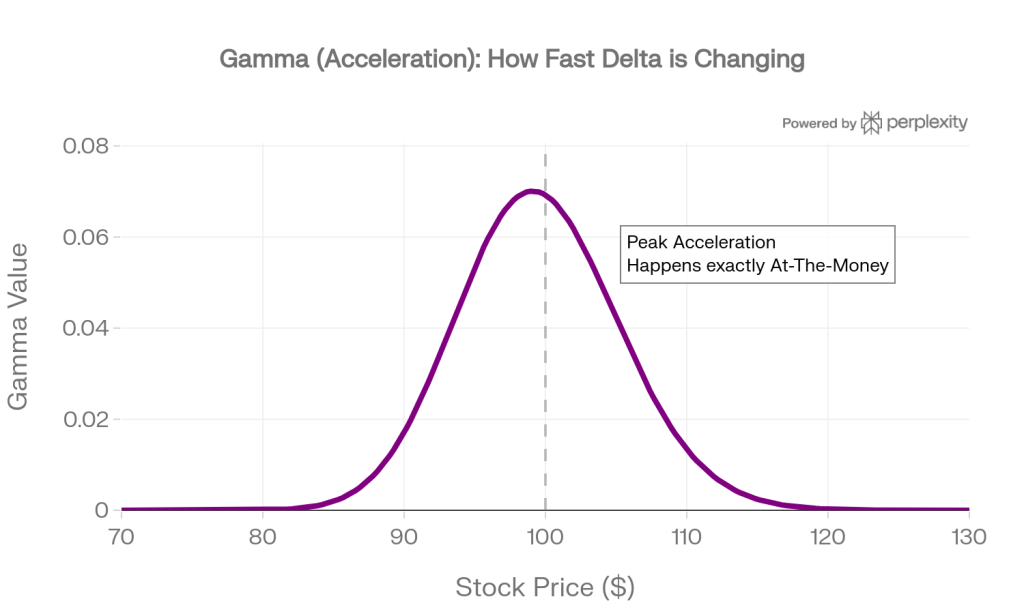
When selling options, Delta and Gamma act as your directional risk and your “snowball” risk.
Delta tells you how much money you will lose if the stock moves $1 against you right now, while Gamma tells you how much worse that loss will get with each additional $1 move.
How to use this information in your trading?
-
Avoid: “Gamma Risk” in Weeklies
Why? As expiration approaches, Gamma spikes dramatically for At-The-Money options.
This means if you sell a 7 DTE put and the stock drops slightly, your Delta will explode to -1.0 almost instantly, turning a small winner into a massive loser -
Picking Trades: The 45 DTE Sweet Spot
Why this DTE? Further-out options have much lower Gamma.
If the stock moves against you at 45 DTE, your Delta changes very slowly, giving you plenty of time to react without panicking. -
When to Roll: The “21 DTE Rule”
Why? Rolling an option out to the next month “flattens” your Gamma exposure.
By exiting at 21 DTE, you dodge the “Gamma cliff” (where price swings become violent) while still keeping the premium you earned from time decay. -
The “Wheel” Exception
If you are running the Wheel strategy and you are 100% happy taking assignment of the shares, Gamma risk is largely irrelevant.
Why? Gamma only hurts if you are trying to buy the option back to close your trade. If your plan is to hold through expiration no matter what, mid-trade price spikes driven by Gamma do not matter to your final outcome.
Why Gamma Makes Delta Unreliable Near Expiration
When you sell a put at -0.25 delta with 35 days to expiration, that delta is relatively stable. Gamma is low (around 0.01-0.02), so even a $3 stock move only shifts your delta to about -0.31. Your risk profile barely changed.
Now take the same put with 3 days to expiration. Gamma might be 0.10 or higher. That same $3 stock drop pushes your delta from -0.25 to -0.55.
Now the risk doubled from the same stock move, purely because gamma amplified the delta shift.
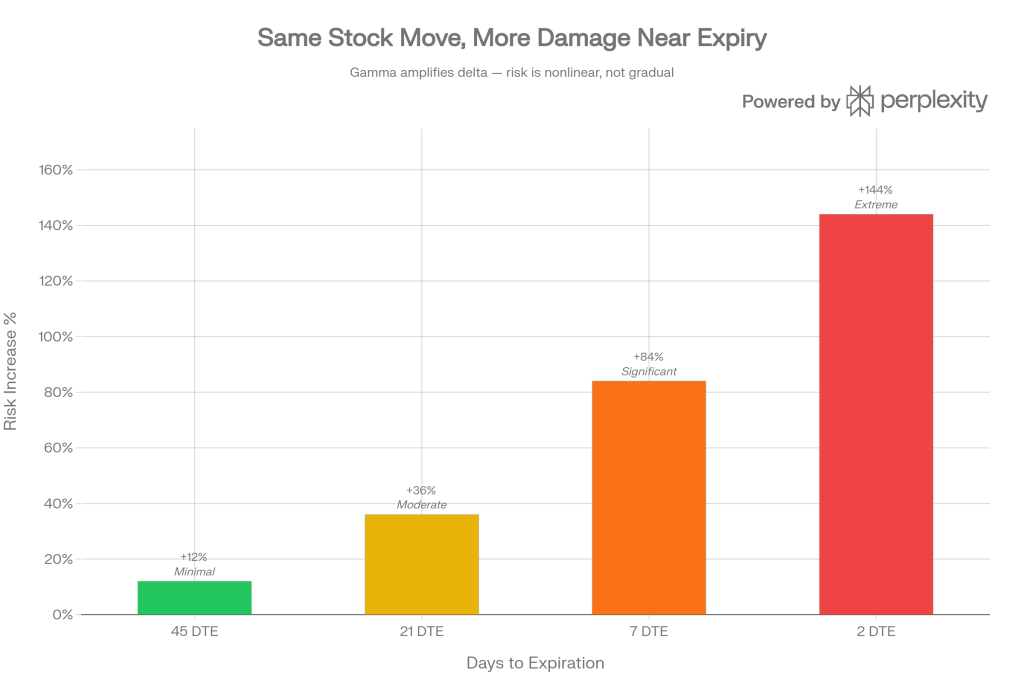
How delta stability changes across the life of a trade:
| DTE | Starting Delta | Gamma | Delta After $3 Drop | Risk Increase |
|---|---|---|---|---|
| 45 DTE | -0.25 | 0.01 | -0.28 | +12% (minimal) |
| 21 DTE | -0.25 | 0.03 | -0.34 | +36% (moderate) |
| 7 DTE | -0.25 | 0.07 | -0.46 | +84% (significant) |
| 2 DTE | -0.25 | 0.12 | -0.61 | +144% (extreme) |
This is exactly why the common advice to “close at 50% profit or 21 DTE” exists.
To make Greeks simpler, QuantWheels custom rating calculates all these greeks and puts them into a single number for you to make an easier decision on which trade is worth it or not.
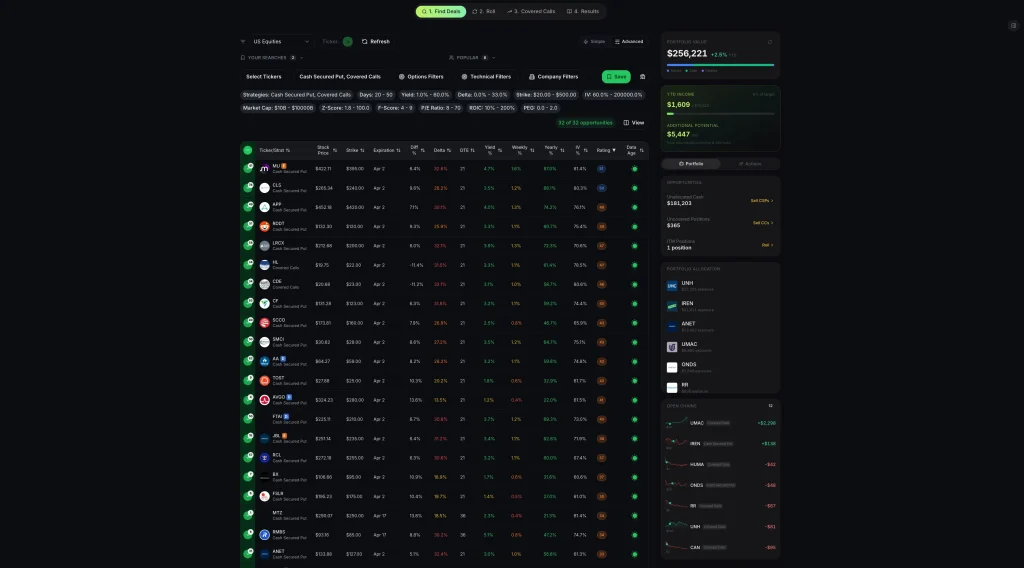
Simplify your trade picking process →
The Gamma Knife Edge: ATM Options
Gamma is highest for at-the-money options.
This creates what experienced traders call the “gamma knife edge” near expiration.
If your short option is sitting right at the strike price with a few days left, delta can swing from 0.30 to 0.70 and back within the same trading day so that’s something to keep in mind.
For wheel traders, this means a stock hovering near your strike in the final days creates the most unpredictable scenario.
You might check your position at lunch and see it safely OTM, then check after the close and find it deep ITM.
The solution: If your option is near the money inside 7 DTE, make a decision. Roll it, close it, or accept the assignment. Don’t just watch and hope.
How Moneyness Affects the Delta-Gamma Pair
The delta-gamma relationship behaves differently depending on where the stock is relative to your strike.
Understanding this helps you anticipate how your position will react in different scenarios.
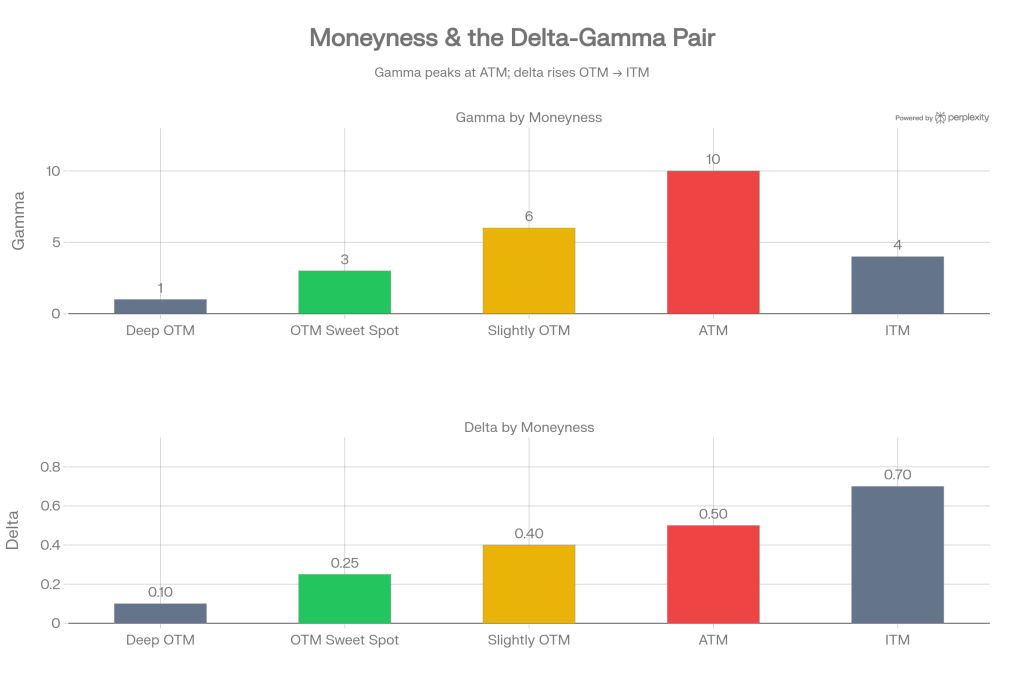
| Option Status | Delta Range | Gamma Level | Behavior | Seller’s Concern |
|---|---|---|---|---|
| Deep OTM (delta 0.05-0.15) | Very low | Very low | Almost no response to stock moves. Delta barely changes. | Safe but very little premium collected. Not worth the capital. |
| OTM sweet spot (delta 0.20-0.30) | Low-moderate | Low-moderate | Responds to stock moves but delta shifts are gradual and predictable. | Ideal zone. Manageable risk, meaningful premium. |
| Slightly OTM (delta 0.35-0.45) | Moderate | Moderate-high | Delta shifts noticeably with small stock moves. Getting sensitive. | More premium but you’re more likely to cross into ATM territory. |
| ATM (delta ~0.50) | High | Maximum | Most sensitive zone. Delta swings rapidly. Coin flip territory. | Maximum uncertainty. High premium but very high assignment risk. |
| ITM (delta 0.60-0.85) | High | Moderate-low | Moves almost dollar-for-dollar with stock. Gamma decreasing. | Assignment is highly likely. Position behaves like stock ownership. |
How to use this information?
This moneyness spectrum explains why the 0.20-0.30 delta zone is the sweet spot for wheel traders. You’re far enough from the gamma knife edge that your position behaves predictably, but close enough to collect meaningful premium.
Delta-Gamma in Action: A Day-by-Day Walkthrough
Let’s trace exactly what happens to a short put during a 3-day stock decline to see delta and gamma compound in real time.
Setup: You sold a $170 put on a stock at $180. At entry (30 DTE), delta is -0.22 and gamma is 0.015.
Day 1: Stock drops from $180 to $177 (-$3). Delta shifts from -0.22 to approximately -0.265 (moved by gamma x $3 = 0.015 x 3 = 0.045).
Your option is now worth about $0.80 more than when you sold it. Unrealized loss: ~$80.
Day 2: Stock drops from $177 to $174 (-$3 more). But now your delta is already -0.265 and gamma has increased to about 0.02 (gamma itself increases as you get closer to ATM).Delta shifts to approximately -0.325.
Your option gains another ~$0.90 in value against you. Cumulative unrealized loss: ~$170.
Day 3: Stock drops from $174 to $171 (-$3 more). Delta is now -0.325, gamma has increased to 0.025. Delta shifts to approximately -0.40.
The option gains another ~$1.05 against you. Cumulative unrealized loss: ~$275.
Notice the acceleration. Day 1 cost you $80. Day 2 cost you $90. Day 3 cost you $105. Each day’s loss is larger than the previous one even though the stock dropped the same $3 each day.
That’s gamma at work – it made delta worse each day, so the next day’s $3 drop hurt more than the last. If the stock continues falling, this compounding accelerates further.
Now compare the same scenario at 5 DTE instead of 30 DTE.
Starting gamma would be 0.06 instead of 0.015.
That same 3-day, $9 decline would shift delta from -0.22 to approximately -0.60 instead of -0.40.
The cumulative loss would be closer to $400 instead of $275.
Same stock move, same starting delta, dramatically different outcome – all because of higher gamma closer to expiration.
The Pin Risk Problem
There’s a specific delta-gamma scenario that wheel traders encounter more often than they expect: pin risk.
This happens when a stock closes very near your strike price on expiration day.
Imagine you sold a $150 put and at 3:30pm on expiration Friday, the stock is at $150.10. Delta is bouncing between -0.45 and -0.55 with every tick. Gamma is extremely high. You genuinely don’t know whether you’ll be assigned or not until after the market closes.
If you’re assigned, you need $15,000 in buying power on Monday for 100 shares. If you’re not assigned, you keep your cash and need to sell a new put.
The solution most experienced wheel traders use: if your option is within $1-2 of the strike inside 3 DTE, close it regardless of the remaining premium if your goal was to not get assigned from the start of the trade.
The certainty of knowing your position is worth more than the $10-30 you’d collect by letting it expire.
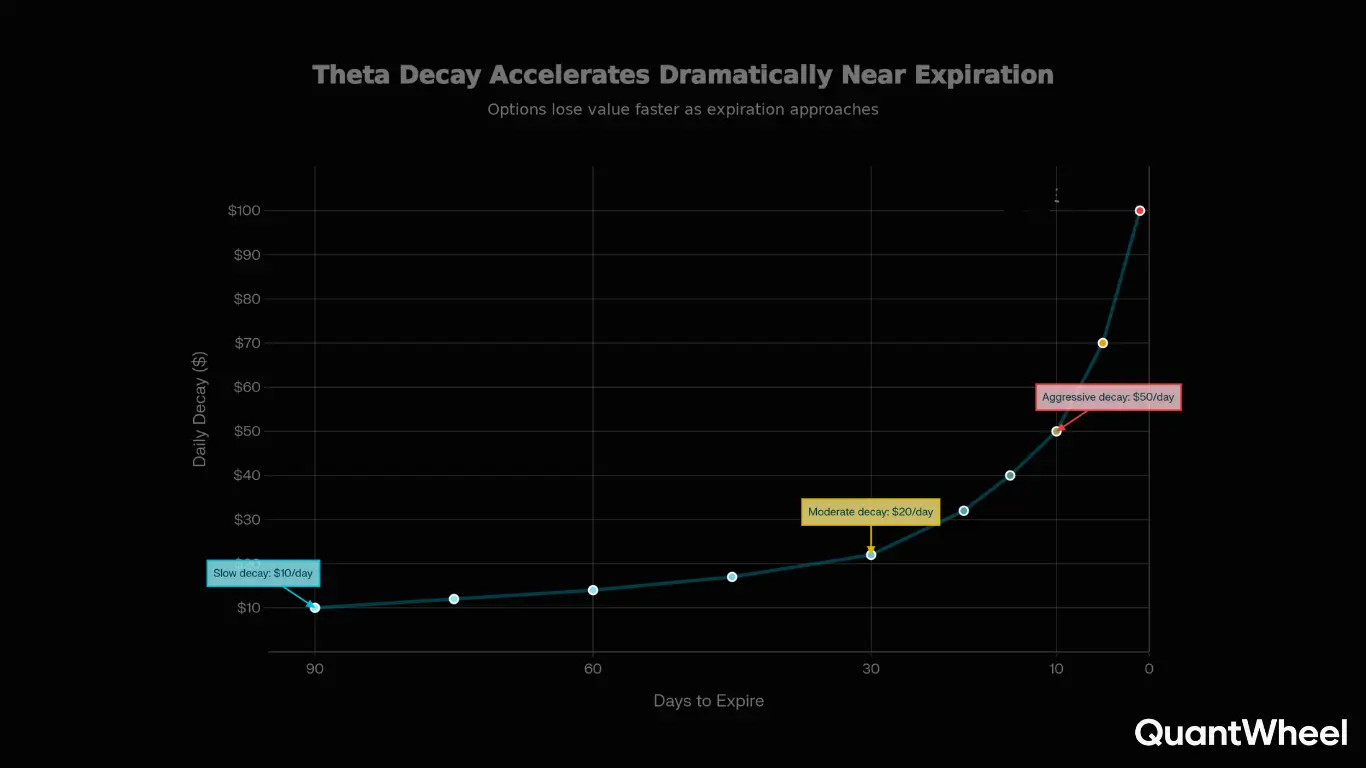
The Theta-Gamma tradeoff dillema for option sellers
Here’s the core tension for every options seller: the time period with the most theta decay is also the time period with the most gamma risk.
The last 7 days before expiration offer maximum daily income but also maximum potential for sudden losses.
The Tradeoff
Let’s put real numbers to this. Consider a short put at the 0.25 delta strike:
| DTE | Daily Theta ($) | Gamma | Loss from $3 Adverse Move | Days of Theta to Recover |
|---|---|---|---|---|
| 45 DTE | $3 | 0.01 | ~$78 | 26 days |
| 21 DTE | $7 | 0.03 | ~$105 | 15 days |
| 7 DTE | $14 | 0.07 | ~$168 | 12 days (but only 7 left) |
| 2 DTE | $20 | 0.12 | ~$246 | 12+ days (impossible to recover) |
Look at that last column. At 45 DTE, a bad move costs you 26 days of theta – painful but recoverable since you have the time.
At 2 DTE, a bad move costs more than 12 days of theta but you only have 2 days left. You physically cannot recover through theta alone. The math simply doesn’t work in your favor at that point.
This is the theta-gamma tradeoff in its clearest form.
The “best” daily theta comes at a time when a single adverse move can wipe out not just days but weeks of accumulated decay.
The Optimal Exit Window
So, what’s the best time to roll or exit a covered call or a cash-secured put?
Research from multiple backtesting studies suggests that closing short options at 50% of maximum profit captures the best risk-adjusted returns. Here’s why this makes sense through the Greeks lens:
At 50% profit (typically reached around 14-21 DTE for options sold at 30-45 DTE), you’ve captured the majority of available theta in the “safe zone” where gamma is still manageable. The remaining 50% of profit requires holding through the period where gamma risk accelerates exponentially. You’re essentially being asked to earn the last $1 while risking $3-5 of potential loss from gamma-driven delta shifts.
Here’s where you can read more about that from traders personal experiences:
| Thread | What it says |
|---|---|
| 50% Rule Discussion | Tastytrade backtests confirm better long-term profits. |
| Gamma Risk Explained | Gamma turns winners to losers post-50%; reduces risk. |
| Wheel CSP Closes | 50% in ~15 days doubles cycles with less risk. |
The Theta-to-Gamma Ratio: A Decision Framework
One practical way to evaluate whether holding a position is worth it is to calculate the ratio of daily theta income to potential gamma-driven loss. You can approximate this by comparing your daily theta to the loss you’d suffer from a 1-standard-deviation stock move.
| DTE | Daily Theta | Expected 1-Day Move (1 SD) | Potential Loss from Move | Theta/Risk Ratio | Worth Holding? |
|---|---|---|---|---|---|
| 35 DTE | $4 | $2.80 | $62 | 6.5% | Yes – favorable ratio |
| 21 DTE | $7 | $2.80 | $84 | 8.3% | Yes – still good |
| 10 DTE | $11 | $2.80 | $140 | 7.9% | Marginal – consider closing |
| 5 DTE | $15 | $2.80 | $210 | 7.1% | No – gamma spikes make this misleading |
| 2 DTE | $20 | $2.80 | $310 | 6.5% | No – tail risk dominates |
The problem isn’t the ratio itself – it’s that the 1-standard-deviation move doesn’t capture tail risk. A 2-standard-deviation move at 2 DTE with high gamma can create losses of $600+ that would take 30 days of theta to recover. At 35 DTE, that same 2 SD move creates maybe $180 in losses. The distribution of outcomes becomes increasingly asymmetric as you approach expiration.
How can you use this?
Calculate your theta-to-gamma ratio (daily theta divided by loss from a 1-2 SD move).
If it’s above 8% (happens most often at around 21 DTE), keep holding; otherwise, close the trade to dodge those gamma blowup.
Weekend Theta and the Friday Decision
There’s a common misconception that holding short options over the weekend is “free theta” because markets are closed but time still passes. In reality, the market prices weekend decay into Friday’s closing prices, so most of the weekend theta is already reflected. What you’re actually exposed to over the weekend is gap risk – the possibility that news breaks on Saturday or Sunday and the stock opens sharply higher or lower on Monday.
For positions that are safely OTM (delta below 0.15), this gap risk is minimal and holding over the weekend is generally fine. For positions near the money (delta 0.30+), the gap risk outweighs the remaining theta. The stock might open $3-5 away from Friday’s close, and with elevated gamma in the final week, that gap could immediately make your position deeply ITM with no chance to manage it.
The practical guideline: if your option expires the following Friday and you’re above 0.25 delta at Thursday’s close, seriously consider closing before the weekend rather than holding through the final 5 days.
How Vega Affects Every Other Greek
Implied volatility doesn’t just change option prices – it reshapes the behavior of every other Greek.
What Happens When IV Rises
When implied volatility increases (for example, before an earnings announcement or during a market selloff), several things happen simultaneously to your short option:
Premium increases (direct vega effect). Your short option becomes more expensive to buy back. If you sold a put for $2.50 and IV spikes 5%, a vega of 0.12 means the option is now worth approximately $3.10 – you’re $60 per contract in the red from volatility alone, even if the stock hasn’t moved.
Delta shifts toward 0.50 for OTM options. Higher IV means wider expected moves, which means OTM options have a greater perceived probability of ending ITM. Your -0.25 delta put might drift to -0.30 or -0.32 delta purely from the IV increase.
Gamma flattens. This is counterintuitive but important: higher IV actually reduces gamma.
The option’s sensitivity to stock moves becomes more gradual because the market already expects larger moves. This is one of the few “silver linings” of an IV spike for sellers.
Theta increases. More premium means more premium to decay. Your daily theta income goes up when IV is elevated. This is partly why selling into high IV works well – even though the position is temporarily underwater from vega, the increased theta starts working harder to recover that loss.
What Happens When IV Drops (IV Crush)
The reverse happens after an event like earnings:
Premium drops sharply (direct vega effect). Your short option becomes cheaper to buy back. This is the “IV crush” effect and it often delivers quick profits. A 10% IV drop with 0.12 vega = $120 per contract of profit from volatility contraction alone.
Delta for OTM options moves further from 0.50. Lower IV means the market expects smaller moves, so OTM options become even more OTM in probability terms. Your -0.25 delta put might drop to -0.18 delta. Good news for sellers.
Gamma increases. With lower IV, delta becomes more sensitive to stock moves near the strike. This is usually fine because if IV crushed, the stock is likely within the expected range.
Theta decreases. Less premium means less premium to decay each day. Your daily income drops. But this usually doesn’t matter because you’re already profitable from the IV crush and should be closing the trade.
IV Regime Impact on Greek Values
| Greek | When IV Is High | When IV Is Low | Implication for Sellers |
|---|---|---|---|
| Delta | OTM options move closer to 0.50 | OTM options move further from 0.50 | In high IV, sell further OTM for same probability |
| Theta | Higher daily decay | Lower daily decay | High IV = more daily income |
| Gamma | Lower (flatter delta curve) | Higher (steeper delta curve) | High IV actually reduces gamma risk |
| Vega | High exposure both ways | Low exposure | Sell high IV, profit from contraction |
Vega in Practice: Earnings Season, Market Selloffs, and Fed Days
Understanding vega in theory is one thing. Knowing how it behaves during the events that actually move IV is what matters for your P/L.
Before Earnings Announcements. IV typically starts rising 1-2 weeks before a stock reports earnings. For popular stocks like AAPL or TSLA, IV can increase 30-60% above normal levels in the days leading up to the announcement. If you sold a put two weeks before earnings, your position might show a paper loss from vega expansion even though the stock hasn’t moved against you. This is normal and expected. The key question is whether to hold through earnings or close before.
The answer depends on your vega exposure relative to expected IV crush. If a stock’s IV is at 45% pre-earnings and its post-earnings IV typically drops to 25%, that’s a 20-point IV crush. With a vega of 0.12, that’s $240 per contract in your favor – but only if the stock doesn’t move beyond the expected range. If you have strong conviction the stock will stay within the expected move, holding through earnings can be very profitable. If you’re uncertain, closing before earnings locks in your theta profit and eliminates the binary risk.
During Market-Wide Selloffs. When the broader market drops sharply (think a 3-5% SPX decline in a week), the VIX spikes and IV rises across nearly all stocks simultaneously. This is the worst-case scenario for a portfolio of short puts because you get hit from two directions: delta losses from stock declines AND vega losses from IV expansion. Your portfolio can show a drawdown 2-3x what the stock moves alone would suggest.
This is why position sizing matters more than Greek optimization. Even perfectly managed Greeks can’t protect you from a correlated market selloff if you’re using too much of your capital. Most experienced wheel traders keep 30-50% of their portfolio in cash specifically for these events – both as a buffer against losses and as dry powder to sell puts at the elevated premiums that selloffs create.
Federal Reserve Announcements. Fed days create a unique vega pattern. IV typically builds going into the announcement, then crushes immediately after regardless of the decision. If you sell options 2-3 days before a Fed meeting, you’ll likely see vega work against you as IV builds, then sharply in your favor after the announcement. The net effect is often close to zero on vega, with your actual P/L driven more by delta (did the stock move?) and theta (time passed).
The Vega-Theta Connection: Why Low IV Environments Are Dangerous for Sellers
When IV is low, two bad things happen to options sellers simultaneously. First, theta is reduced because there’s less premium to decay – your daily income drops. Second, vega risk is asymmetric because IV is much more likely to rise than fall further (IV has a natural floor but no ceiling).
Imagine selling a put when IV Rank is at 10. You collect a thin premium. Then any negative catalyst – an earnings miss, a broader market dip, a geopolitical event – sends IV higher. Your position immediately goes underwater from vega expansion, and your theta is too low to recover quickly. You sold cheap insurance at a time when the risk of a claim was actually about to increase.
This is why IV Rank or IV Percentile should be your first filter before opening any new wheel position. If IV Rank is below 20, either skip that stock, move your strike closer to ATM (accepting more delta risk for better premium), or wait for a better entry. The best wheel traders are patient – they’d rather sit in cash for a week than sell cheap options in a low-IV environment.
Portfolio-Level Greeks: Seeing the Full Picture
Looking at Greeks on individual trades is useful. Looking at Greeks across your entire portfolio is essential. Most wheel traders run multiple positions simultaneously, and the combined Greek exposure often reveals risks that are invisible at the single-trade level.
How to Calculate Portfolio Greeks
Portfolio Greeks are additive. You simply sum each Greek across all open positions. Here’s an example portfolio of a wheel trader running five positions:
| Position | Delta | Theta ($/day) | Gamma | Vega ($/1% IV) |
|---|---|---|---|---|
| Short AAPL $210 Put (32 DTE) | -0.25 | +$5 | 0.02 | -$12 |
| Short MSFT $400 Put (28 DTE) | -0.28 | +$7 | 0.02 | -$15 |
| Short AMD $145 Put (18 DTE) | -0.32 | +$6 | 0.04 | -$10 |
| Covered Call: Long 100 SOFI + Short $12 Call (25 DTE) | +0.65 | +$3 | -0.03 | -$5 |
| Covered Call: Long 100 KO + Short $65 Call (35 DTE) | +0.70 | +$2 | -0.01 | -$4 |
| PORTFOLIO TOTAL | +0.50 | +$23/day | 0.04 | -$46 |
What This Portfolio Tells You
Delta of +0.50: The portfolio is net long, equivalent to being long about 50 shares of a stock. The covered calls contribute positive delta (you own shares), while the short puts contribute negative delta. In a broad market selloff, your short puts lose money but your share positions provide some buffer. This is reasonably balanced.
Theta of +$23/day: You’re collecting $23 per day in time decay across all positions. That’s approximately $161/week or $690/month in theta income. This is the engine of the wheel strategy – consistent daily income from time decay across multiple positions.
Gamma of 0.04: Total gamma is moderate. The AMD position at 18 DTE is the highest contributor. If the market drops sharply, that AMD put’s delta will shift the fastest. This position should be monitored more closely than the others.
Vega of -$46: You’re short $46 of vega per 1% IV move. If implied volatility across these stocks rises by 3% (say, during a market scare), your portfolio takes an immediate $138 paper loss from vega alone, independent of any stock movement. During earnings season when multiple stocks report in the same week, this vega exposure compounds.
Hidden Risks Portfolio Greeks Reveal
Sector concentration. Three of the five positions are tech (AAPL, MSFT, AMD). In a tech selloff, these positions are highly correlated – they’ll all move against you at the same time. The portfolio Greeks look moderate in isolation, but the effective risk is higher because the positions aren’t truly diversified.
Earnings overlap. If AAPL and MSFT report earnings in the same week, your vega exposure to tech IV crush/expansion doubles. A pre-earnings IV spike could hit both positions simultaneously, creating a much larger drawdown than the per-trade numbers suggest.
DTE clustering. Four of the five positions expire within two weeks of each other. If the market drops during that window, you face gamma risk on multiple positions at once. Staggering expirations across different weeks reduces this clustering risk.
Greeks Through a Complete Wheel Strategy Cycle
Let’s trace how the Greeks evolve through an entire wheel cycle – from selling a cash-secured put through assignment to selling covered calls – on a stock trading at $100.
Phase 1: Sell Cash-Secured Put ($95 strike, 35 DTE, $2.00 premium)
| Greek | At Entry (35 DTE) | Mid-Trade (18 DTE) | Near Expiration (5 DTE) |
|---|---|---|---|
| Delta | -0.25 | -0.22 (stock held steady) | -0.15 (decaying OTM) |
| Theta | +$4/day | +$8/day | +$12/day |
| Gamma | 0.01 | 0.03 | 0.06 |
| Vega | -$0.11 | -$0.07 | -$0.03 |
| Option Value | $2.00 | $0.95 | $0.20 |
Ideal outcome: Close at 18 DTE for $0.95 (52% profit). You captured $105 in 17 days. Theta did the heavy lifting. Gamma stayed manageable. Vega became irrelevant as the option decayed.
Assignment scenario: Stock drops to $93. Delta jumps to -0.75, option is now worth $3.50 (you’re underwater $1.50). You get assigned at expiration. Your cost basis is $95 – $2.00 premium = $93 per share.
Phase 2: After Assignment, Sell Covered Call ($100 strike, 30 DTE, $1.80 premium)
Now your Greeks profile changes completely. You own 100 shares (delta of +1.00) and you’re short a call.
| Component | Delta | Theta | Gamma | Vega |
|---|---|---|---|---|
| Long 100 Shares at $93 basis | +1.00 | $0 | 0 | $0 |
| Short $100 Call | -0.30 | +$5 | -0.02 | -$0.10 |
| Net Position | +0.70 | +$5/day | -0.02 | -$0.10 |
Notice the shift. During the CSP phase, your net delta was slightly negative (-0.25). Now with the covered call, your net delta is strongly positive (+0.70). You’re net long the stock, which means you benefit from upward moves. Theta is still positive because you’re still a net seller. Gamma is negative and small, meaning delta shifts are in your favor if the stock moves away from the strike.
This is the wheel in action through the Greeks lens. You cycle between slightly short delta (CSP phase) and moderately long delta (CC phase), collecting theta income throughout both phases.
Practical Rules for Managing Greeks in Real Trades
Rule 1: Monitor portfolio delta weekly. If your total delta drifts beyond +/- 2.00 (equivalent to 200 shares of exposure), you may be too directional. Consider closing your most directional position or adding one on the opposite side.
Rule 2: Use theta as your baseline income target. Calculate your total portfolio theta at the start of each week. Multiply by 5 trading days. That’s your expected income if everything stays flat. If your actual P/L significantly exceeds or undercuts this number, the difference is coming from delta (stock movement) or vega (volatility changes).
Rule 3: Respect the gamma zone. When any individual position’s gamma exceeds 0.05, it’s in the danger zone. This typically happens below 10 DTE for near-the-money options. Either close, roll, or accept the assignment risk.
Rule 4: Be aware of vega concentration. If more than 60% of your portfolio vega comes from a single stock or sector, you’re vulnerable to a concentrated IV event. Spread vega exposure across uncorrelated underlyings.
Rule 5: Stagger expirations. Don’t let all your positions expire in the same week. If you run 5 wheel positions, aim for expirations across at least 3 different weeks. This prevents gamma from spiking on your entire portfolio at once.
Rule 6: Sell into high IV, not away from it. When a stock’s IV Rank is above 50, the combined effect of high theta, reduced gamma, and potential vega profit from IV contraction all work in your favor. Low IV environments mean thinner premiums and fewer Greek advantages for sellers.
Rule 7: Decompose your weekly P/L by Greek. When you close a trade, estimate how much profit came from theta (time passed), how much from delta (stock moved in your favor), and how much from vega (IV dropped). This tells you whether you’re genuinely making money from your strategy or just getting lucky on stock direction. A healthy wheel portfolio should derive 60-80% of its profits from theta over time.
Rule 8: Adjust strike selection based on IV environment. In high IV (IV Rank above 50), you can sell further OTM (delta 0.15-0.20) and still collect meaningful premium. In normal IV (IV Rank 25-50), stick to the standard 0.20-0.30 delta range. In low IV (IV Rank below 25), you either move closer to ATM (delta 0.30-0.35) or skip the trade entirely. Adjusting your delta target based on IV ensures you’re collecting adequate premium for the risk in any environment.
Rule 9: Watch for correlated vega events. Before earnings season, check whether multiple stocks in your portfolio report in the same week. If three of your five positions have earnings coming up, your total vega exposure might triple temporarily. Consider closing one or two positions before the earnings cluster to reduce concentration risk.
Rule 10: Use Greek changes as early warning signals. If your portfolio delta has shifted significantly from where it was a week ago even though you didn’t open or close any positions, that tells you the market has moved and your risk profile has changed. A weekly Greek check catches these drift patterns before they become problems.
Common Greek Scenarios and How to Handle Them
Here are the situations wheel traders encounter most often, analyzed through the Greeks.
Scenario 1: Stock Drops Suddenly But You’re Not at the Strike Yet
You sold a $150 put when the stock was at $165. The stock drops to $156 in two days. Your delta has shifted from -0.22 to about -0.38. Theta is still positive but gamma is increasing as you get closer to the strike.
What the Greeks tell you: You’re not in immediate danger (still $6 above the strike), but your position is significantly more sensitive than when you opened it. Each additional $1 drop now costs you about 40% more than it did at entry because delta has increased. If you do nothing and the stock continues falling, the losses accelerate.
Options: If the stock drop was driven by a temporary catalyst and you’re comfortable owning shares at $150, you can hold. Your elevated delta means you’ll also benefit more from any bounce. If the drop signals a fundamental change, consider rolling the put down and out to a lower strike and further expiration to collect additional premium and reset your Greeks to a more comfortable level.
Scenario 2: Your Option Is at 60% Profit But Still Has 20 DTE
You sold a put for $3.00 and it’s now worth $1.20. You’ve made $180 per contract in 15 days. Theta is still working, gamma is low, and vega is neutral.
What the Greeks tell you: You’ve captured the easy money. The remaining $120 of profit requires 20 more days. Your daily theta at this point is perhaps $5-6/day, which means you’re on track, but you’re now holding through the period where gamma will start to increase.
Options: Close for the $180 profit and immediately sell a new put at 30-45 DTE. This resets your Greek profile to the favorable zone – low gamma, reasonable theta, manageable delta. The annualized return of taking the $180 in 15 days and redeploying is almost always better than waiting 20 more days for the remaining $120.
Scenario 3: IV Spikes After You Sold an Option
You sold a put for $2.00 when IV was at the 35th percentile. A week later, market uncertainty causes IV to spike to the 65th percentile. Your option is now worth $2.80 even though the stock barely moved. You’re showing an $80 loss on a position where the stock didn’t move against you.
What the Greeks tell you: This is purely a vega-driven loss. Delta hasn’t changed much, theta is actually higher now (good for you going forward), and gamma is about the same. The paper loss is from IV expansion, not from your trade thesis being wrong.
Options: In most cases, hold. The elevated theta is now working faster to decay the inflated premium. If IV spikes are usually temporary (which they are – IV is mean-reverting), the vega loss will reverse as IV normalizes, and you’ll actually end up more profitable than your original projection because you’re now decaying from a higher premium level. The exception is if the IV spike signals something fundamental (like unexpected bad news about the company), in which case the stock price will likely follow IV lower.
Scenario 4: You’re Assigned and Need to Sell a Covered Call
Your put got assigned at $95. The stock is now at $92. You need to sell a covered call, but you don’t want to cap your upside below your cost basis.
What the Greeks tell you: Your current position is long 100 shares (delta +1.00) with zero theta – time isn’t helping you at all while you hold shares without a call. Every day you wait costs you the theta you could be collecting. However, selling a call at $95 (your cost basis) when the stock is at $92 means the call is OTM with a delta around 0.30-0.35 and reasonable premium.
Options: Sell the $95 or $97.50 call at 30-45 DTE. This immediately turns on theta income and reduces your net delta from +1.00 to about +0.65-0.70. You start earning daily premium while waiting for the stock to recover. If your real cost basis is $93 (after the premium from the put), selling the $95 call means you’d profit $2/share plus the call premium if called away – a solid outcome from a trade that started with assignment.
Scenario 5: Market Selloff Hits All Your Positions
The market drops 4% in a week. All five of your short puts are showing losses. Portfolio delta has swung from +0.50 to -1.20 (the stock declines pushed your put deltas higher). Total vega losses are $200+ from the IV spike. Theta has increased but can’t keep up with the directional and volatility losses.
What the Greeks tell you: Your portfolio has become significantly net short delta (-1.20), meaning further declines will accelerate losses. However, theta is now elevated across all positions (IV spike increased premiums), and IV will eventually mean-revert. The question is whether you can withstand the current drawdown.
Options: This is where pre-trade position sizing saves you. If you had 40% of your portfolio in cash, you can afford to hold through the volatility. You might even sell additional puts at the now-elevated IV levels to collect rich premiums. If you’re fully deployed and the drawdown is threatening your margin, you need to close the weakest position (highest delta, lowest conviction) to free up capital and reduce directional exposure. Never add to losing positions when you’re already at maximum allocation.
Start your free trial of QuantWheel →
Related Articles
- Options Greeks Guide: Delta, Theta, Gamma & Vega Explained
- Introduction to Options Greeks
- Options Delta Explained
- Options Theta Explained: Time Decay
- Options Gamma Explained
- Options Vega Explained
- Implied Volatility Explained
- IV Crush: What It Is and How to Profit
- How Options Are Priced
- Options Risk Management
Risk Disclosure: Options trading involves substantial risk and is not suitable for all investors. Past performance does not guarantee future results. This content is for educational purposes only and should not be considered investment advice. Always do your own research and consider consulting with a financial advisor before making investment decisions. The examples used in this article are for educational purposes only and are not recommendations to buy or sell any security.