This guide covers everything you need to know about delta, from the basic mechanics through advanced applications like portfolio delta management, how delta changes over the life of a trade, and how to use delta to make better decisions when positions move against you.
Author: David Romic – retail options trader and active member in the options trading communities on Reddit (u/thedavidromic).
I share wheel strategy setups, trade management, and lessons learned from real positions.
What Is Options Delta?
Options delta measures how much an option’s price changes when the underlying stock moves $1. It’s expressed as a decimal between 0 and 1.00 for call options and between 0 and -1.00 for put options.
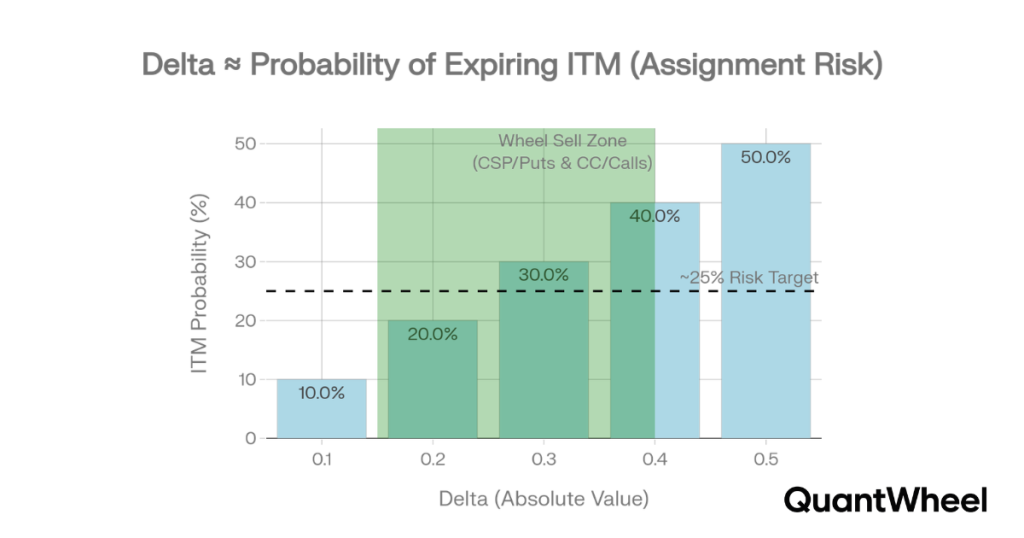
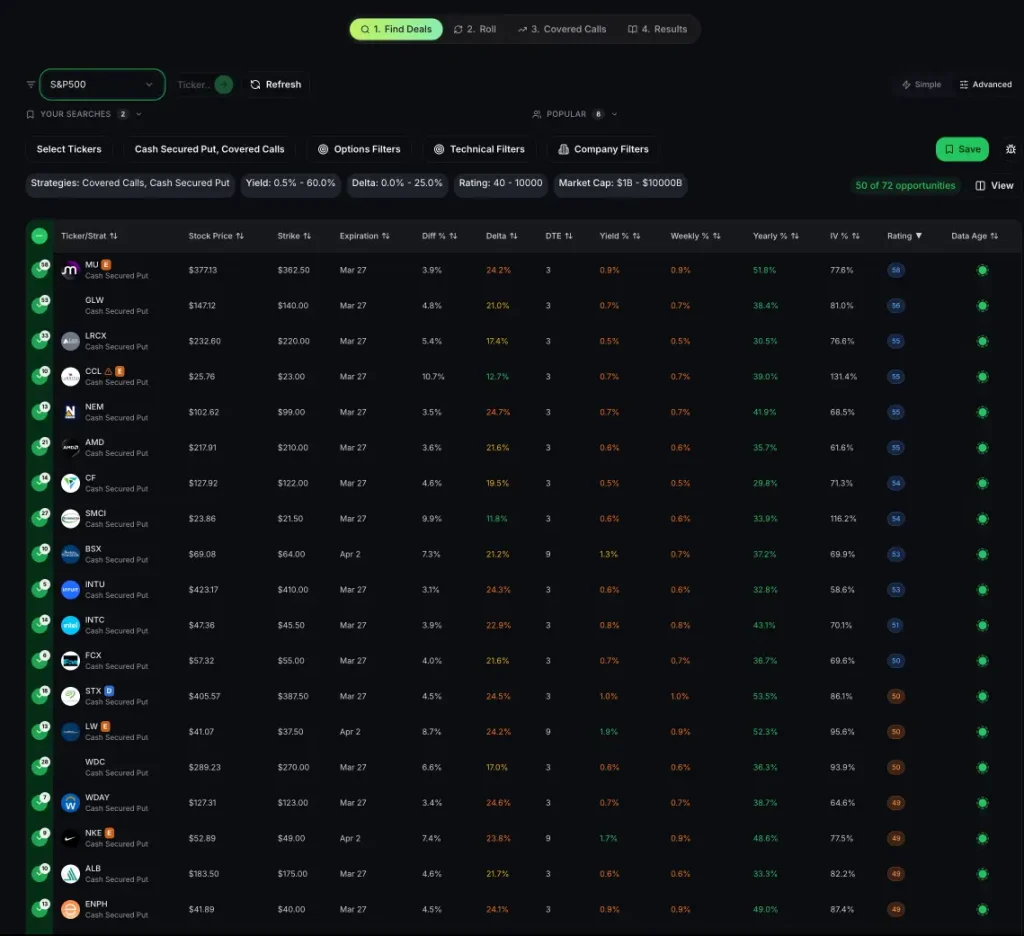
Here’s a chart that helps visualize the delta for option sellers:
On the other side, if you’re buying options delta tells you something different:
If a call option has a delta of 0.50, it means the option’s price will increase by approximately $0.50 (or $50 per contract) when the stock goes up $1.
If the stock goes down $1, the option loses approximately $0.50 in value.
For put options, the logic is inverted.
Conclusion:
When selling calls or puts, delta gives you a rough sense of assignment odds, so lower delta means lower‑risk income and higher absolute delta means richer premium but a higher chance of getting assigned shares or having them called away.
When buying calls or puts, delta shows how strongly your option price will move with the stock in your chosen direction, so higher absolute delta means a bigger, more aggressive directional bet.
Choosing a higher delta gives you a higher chance to end in profit but the option will usually be more expensive.
If you’re looking how to make the whole process of picking the right trade better when taking into account the delta, the best idea is to ask yourself “how much you want to risk?”
Once you’ve got an answer for that, a good approach for a beginner is to set a delta filter (example below: Delta under 25%)
By setting a limit on that delta, you’re creating a system – and that’s an important part when trading options.
How Delta Changes With Moneyness
Delta isn’t the same for every option. It depends primarily on how far the strike price is from the current stock price – what traders call “moneyness.” Understanding this relationship is essential for selecting the right strike.
Delta Across the Options Chain
Here’s what delta looks like across different strikes for a stock trading at $150 with 30 days to expiration:
| Strike Price | Moneyness | Call Delta | Put Delta | Premium (Put) | Assignment Prob. |
|---|---|---|---|---|---|
| $130 | Deep OTM Put | 0.92 | -0.08 | $0.25 | ~8% |
| $135 | OTM Put | 0.85 | -0.15 | $0.60 | ~15% |
| $140 | OTM Put | 0.78 | -0.22 | $1.15 | ~22% |
| $143 | Sweet Spot | 0.72 | -0.28 | $1.65 | ~28% |
| $145 | Slightly OTM | 0.65 | -0.35 | $2.30 | ~35% |
| $150 | ATM | 0.50 | -0.50 | $3.80 | ~50% |
| $155 | ITM Put | 0.35 | -0.65 | $6.20 | ~65% |
The highlighted row at $143 shows the sweet spot most wheel traders target. At -0.28 delta, you’re collecting $1.65 in premium ($165 per contract) with roughly a 28% probability of being assigned. That’s meaningful income relative to the capital tied up, with a comfortable margin of safety below the current stock price.
Notice how the premium increases as you move closer to the current stock price (higher delta). You collect more, but your chance of being assigned increases proportionally. This is the fundamental tradeoff in options selling – there’s no free premium. Every dollar of additional income comes with additional assignment risk.
The Delta Curve
Delta doesn’t increase linearly as you move from OTM to ITM. It follows an S-shaped curve (technically, the cumulative normal distribution function). This means delta changes fastest around the at-the-money strike and slowest at the extremes.
Practically, this means the difference between a 0.10 delta option and a 0.15 delta option is much smaller in dollar terms than the difference between a 0.45 delta option and a 0.50 delta option, even though both are 0.05 delta apart. The closer you are to ATM, the more each delta point matters.
This is important for strike selection because it means moving one strike closer to ATM when you’re already near the money adds disproportionately more risk than moving one strike closer when you’re far OTM. If you’re deciding between the 0.25 and 0.30 delta strike, the risk difference is manageable. If you’re deciding between the 0.45 and 0.50 delta strike, you’re entering a much more sensitive zone.
Delta as Assignment Probability
One of delta’s most practical uses is as a rough estimate of the probability that an option will expire in the money. A put with a delta of -0.25 has approximately a 25% chance of being assigned at expiration. A call with a delta of 0.35 has approximately a 35% chance of being called away.
Why It’s an Approximation, Not Exact
Delta-as-probability is a useful shortcut, but it has important limitations. The actual probability of an option expiring ITM can differ from delta by several percentage points because of volatility skew, interest rates, dividends, and the specific pricing model being used.
Volatility skew is the biggest factor. Most stocks have higher implied volatility for lower strike puts than for higher strike calls (a “skew” toward the downside). This means the market prices in a greater chance of large downward moves, which inflates put premiums and deltas slightly compared to what a symmetric probability distribution would suggest. In practice, a put showing -0.25 delta might have a true probability closer to 22-23% on some stocks.
For practical strike selection, this small difference doesn’t matter much. But it’s why you shouldn’t treat delta as a precise probability calculator. Use it as a guideline – “this option has roughly a 1-in-4 chance of assignment” – not as a guarantee.
Delta Probability by Strike Selection
| Delta (Absolute) | Approx. ITM Probability | What This Means | Expected Outcome Over 10 Trades |
|---|---|---|---|
| 0.10 | ~10% | Very unlikely to be assigned | Assigned on ~1 of 10 trades. Very thin premium each time. |
| 0.15 | ~15% | Low probability | Assigned on ~1-2 of 10. Low but not negligible premium. |
| 0.20 | ~20% | Conservative seller’s choice | Assigned on ~2 of 10. Decent premium, low stress. |
| 0.25-0.30 | ~25-30% | Sweet spot for most sellers | Assigned on ~3 of 10. Good premium, manageable assignments. |
| 0.35-0.40 | ~35-40% | Aggressive seller’s choice | Assigned on ~4 of 10. High premium but frequent assignments. |
| 0.50 | ~50% | Coin flip | Assigned on ~5 of 10. Maximum premium but maximum uncertainty. |
Over the course of a year running the wheel strategy on multiple stocks, these probabilities become very real. If you consistently sell at 0.25 delta, expect to be assigned on roughly one out of every four trades. That means you need to be comfortable owning every stock you sell puts on, at the strike price you select, at all times. If you wouldn’t want to own the shares at assignment, you shouldn’t be selling the put.
Using Delta for Strike Selection in the Wheel Strategy
Delta is the single most useful tool for selecting strike prices when selling options. Here’s how to apply it to both phases of the wheel strategy.
Cash-Secured Puts: The 0.20 to 0.30 Delta Range
When selling cash-secured puts, most experienced wheel traders target a delta between -0.20 and -0.30. Where you fall within this range depends on your goals for that specific trade:
Selling at -0.20 delta is the conservative approach. You’re accepting lower premium in exchange for a lower probability of assignment. This works well when you want to generate income but aren’t eager to own shares at this moment – perhaps the stock has run up recently and you’d prefer a bigger pullback before buying. You’ll collect less per trade, but your win rate will be higher (roughly 80% of trades expire worthless).
Selling at -0.25 delta is the balanced approach and the most popular among wheel traders. You collect meaningful premium with a roughly 75% chance of keeping it all. When you are assigned (about 1 in 4 trades), you’re buying at a decent discount to where the stock was when you sold the put.
Selling at -0.30 delta is the aggressive approach. You collect more premium per trade but get assigned more often (roughly 3 out of 10 trades). This works well if you genuinely want to own the stock and are using puts as a way to get paid while waiting for a pullback.
Covered Calls: The 0.25 to 0.35 Delta Range
When selling covered calls, the delta decision is slightly different because you already own the shares and are deciding how much upside you’re willing to give up in exchange for premium income.
Selling at 0.25 delta gives you a lower premium but a higher probability of keeping your shares. You’re capping your upside at a level the stock has only a ~25% chance of reaching. This works well if you want to hold the stock long-term and use covered calls purely as income enhancement.
Selling at 0.30-0.35 delta gives you higher premium but a greater chance of having your shares called away. This is more appropriate when you’re neutral to slightly bearish on the stock and wouldn’t mind selling at the strike price. It’s also the better choice when your cost basis is below the strike and you’d profit from being called away.
Adjusting Delta Based on Market Conditions
Your target delta shouldn’t be static. Smart wheel traders adjust based on the current environment:
| Market Condition | Suggested CSP Delta | Suggested CC Delta | Reasoning |
|---|---|---|---|
| High IV (IV Rank 50+) | -0.15 to -0.20 | 0.20 to 0.25 | Premiums are rich even at lower delta. Give yourself extra margin of safety since the market expects bigger moves. |
| Normal IV (IV Rank 25-50) | -0.20 to -0.30 | 0.25 to 0.35 | Standard conditions. Use your default delta targets. |
| Low IV (IV Rank below 25) | -0.25 to -0.35 | 0.30 to 0.40 | Premiums are thin. You need to move closer to ATM for adequate premium, or skip the trade entirely. |
| Bullish outlook | -0.30 to -0.35 | 0.20 to 0.25 | Higher delta CSPs because you want to own shares. Lower delta CCs to keep upside potential. |
| Bearish/cautious outlook | -0.15 to -0.20 | 0.35 to 0.40 | Lower delta CSPs for bigger safety margin. Higher delta CCs because you’d welcome selling shares. |
How Delta Changes Over the Life of a Trade
Delta is not a fixed number. It shifts constantly as three things change: the stock price, the time remaining, and implied volatility. Understanding these shifts helps you anticipate what your position will look like tomorrow, next week, and at expiration.
Delta Changes From Stock Movement (Gamma Effect)
When the stock moves, delta changes. The rate of that change is measured by gamma (another Greek). If you sold a put at -0.25 delta and the stock drops $5, your delta might increase to -0.35 or -0.40 depending on how much time is left. Your position is now more sensitive to further stock declines than it was when you opened it.
The practical implication: a position that started as a comfortable -0.25 delta can drift to -0.40 or higher after an adverse stock move. At that point, you need to decide whether to hold (accept the increased risk), roll (move to a lower strike and/or further expiration), or close (take the loss and move on). What you should not do is ignore the change and hope the stock bounces back without adjusting your risk assessment.
Delta Changes From Time Passing
As expiration approaches, delta behaves differently depending on whether your option is ITM, ATM, or OTM:
OTM options: Delta decreases toward zero as time passes (assuming the stock doesn’t move). With less time remaining, there’s less chance for the stock to reach your strike. A put that was -0.25 delta with 30 DTE might be -0.15 delta with 10 DTE if the stock stayed flat. This is good news for sellers – your position is becoming less risky.
ATM options: Delta stays near 0.50 but becomes increasingly unstable. Gamma is highest for ATM options near expiration, so small stock moves create large delta swings. An ATM put might jump from -0.45 to -0.60 delta on a $2 stock move with only 3 days left.
ITM options: Delta increases toward -1.00 (for puts) or +1.00 (for calls) as expiration approaches. The option increasingly behaves like stock ownership because it’s almost certain to be exercised.
Delta Changes From Implied Volatility Shifts
When implied volatility changes, delta shifts even if the stock price and time haven’t changed. Higher IV pushes all OTM deltas closer to 0.50 (more uncertainty about where the stock will end up). Lower IV pushes OTM deltas further from 0.50 (more certainty).
This is why your delta target should account for the IV environment. When you sell a -0.25 delta put in a high-IV environment, the “true” probability might be slightly lower than 25% because elevated IV has inflated the delta. Conversely, in a low-IV environment, a -0.25 delta option might actually have a slightly higher than 25% true probability because the market is pricing in minimal movement.
Delta in Practice: Real Trade Examples
Example 1: CSP Trade Goes Right
You sell a $140 put on a stock at $152 for $1.80 premium. Delta at entry: -0.22. DTE: 35.
Week 1: Stock stays around $151-153. Delta drifts to -0.20 as time passes. Your option is worth $1.35. Unrealized profit: $45.
Week 2: Stock rises to $156. Delta drops to -0.14 because the stock moved further away from your strike AND time passed. Option is worth $0.65. Unrealized profit: $115.
Week 3: Stock still at $155. Delta is now -0.10 with 14 DTE. Option is worth $0.40. Unrealized profit: $140 (78% of max). You close the trade.
Analysis: Delta told the story at every stage. It started at a comfortable -0.22, moved in your favor (lower) as the stock rose and time passed, and signaled a clean exit when it reached -0.10 (very low probability of assignment). Total income: $140 on ~$14,000 in capital over 21 days = 1.0% return, or roughly 17% annualized.
Example 2: CSP Trade Goes Wrong
You sell a $95 put on a stock at $103 for $2.20 premium. Delta at entry: -0.25. DTE: 30.
Week 1: Stock drops to $99. Delta increases to -0.35. Option is now worth $3.40. Unrealized loss: $120. The delta shift tells you your position is significantly more sensitive now.
Week 2: Stock drops to $96. Delta increases to -0.52. Option is worth $5.00. Unrealized loss: $280. You’re now essentially at the money with delta near 0.50. Every $1 further decline costs you almost $50.
Decision point: At this stage, delta is telling you that assignment is roughly a coin flip. Your choices are to close for a $280 loss, roll down and out to a lower strike (collecting additional premium to offset the loss), or hold and accept assignment at $95 with a $92.80 effective cost basis ($95 strike minus $2.20 premium). If you’re comfortable owning shares at $92.80, holding or rolling is reasonable. If you no longer want to own this stock at any price, close the position.
Example 3: Covered Call After Assignment
You were assigned on the $95 put above. Stock is now at $93. Your cost basis: $92.80 ($95 – $2.20 premium). You sell a $97.50 covered call for $1.50 with 30 DTE. Call delta: 0.30.
Your position’s net delta: +1.00 (shares) minus 0.30 (short call) = +0.70. You’re net long but the call reduces your directional exposure. For every $1 the stock rises, your position gains about $0.70 (you gain $1 on shares but the call works $0.30 against you).
Best case: Stock rises above $97.50. Call gets exercised. You sell shares at $97.50, having paid $92.80 effective cost basis. Profit: $4.70/share plus $1.50 call premium = $6.20 total profit per share ($620 per contract). The wheel cycle is complete.
Neutral case: Stock stays at $93. Call expires worthless. You keep the $1.50 premium ($150), lowering your cost basis to $91.30. Sell another call next month.
Portfolio Delta: Managing Total Directional Exposure
When you run multiple wheel positions simultaneously, individual trade deltas combine into a portfolio-level delta that represents your total directional exposure to the market.
Calculating Portfolio Delta
Portfolio delta is the sum of all position deltas. But there’s an important nuance: you need to account for the fact that different stocks have different prices. A -0.25 delta put on a $200 stock represents much more dollar risk than a -0.25 delta put on a $30 stock.
The simplest approach is to look at your portfolio delta in dollar terms. Multiply each position’s delta by the stock price and by 100 (shares per contract):
Dollar delta = Delta x Stock Price x 100
| Position | Delta | Stock Price | Dollar Delta |
|---|---|---|---|
| Short AAPL $215 Put | -0.25 | $228 | -$5,700 |
| Short MSFT $390 Put | -0.28 | $415 | -$11,620 |
| Long 100 KO + Short $65 Call | +0.70 | $62 | +$4,340 |
| PORTFOLIO TOTAL | -$12,980 |
This portfolio has a dollar delta of -$12,980. That means if all three underlying stocks dropped 1% simultaneously, the portfolio would lose approximately $130. If they dropped 5% (a significant market selloff), you’d lose roughly $650. Knowing this number before the selloff happens helps you decide whether your position sizes are appropriate for your account and risk tolerance.
When Portfolio Delta Gets Too Large
As a general guideline, your total dollar delta shouldn’t represent more than 20-30% of your total account value. If you have a $100,000 account, keeping your dollar delta between -$20,000 and -$30,000 (for a net short portfolio) or between +$20,000 and +$30,000 (for a net long portfolio) helps ensure a 5% market move doesn’t devastate your account.
If your portfolio delta has grown too large in one direction, you have several options: close the position with the highest delta contribution, add a position on the opposite side (e.g., sell a covered call if you’re too short delta from puts), or reduce position sizes on new trades until existing positions expire or are closed.
5 Common Delta Mistakes That Cost Options Sellers Money
1. Chasing premium by selling too high a delta. Selling puts at 0.40-0.50 delta because the premium is attractive is a common trap. Yes, you collect more per trade, but you’re assigned roughly half the time. If the stock drops significantly after assignment, you’re underwater on shares you bought at a premium. The higher premium doesn’t compensate for the higher frequency and severity of losses from assignment at poor prices.
2. Ignoring delta drift on open positions. You sold a put at -0.25 delta and checked it at entry. Then you didn’t look at it for two weeks. Meanwhile, the stock dropped 6% and your delta has crept to -0.48. You’re now sitting on a position with twice the risk you originally accepted, and you didn’t even notice. A weekly delta check takes 30 seconds and can save you from unpleasant surprises.
3. Using the same delta in every IV environment. Selling at -0.25 delta when IV is at the 80th percentile is very different from selling at -0.25 delta when IV is at the 15th percentile. In high IV, -0.25 delta collects generous premium and has a comfortable safety margin. In low IV, -0.25 delta collects thin premium that barely justifies the capital requirement. Adjust your target delta based on the IV environment or skip trades when premiums are too thin.
4. Not understanding delta for covered calls. Some wheel traders spend significant effort picking the right delta for their puts but then sell covered calls at whatever strike “feels right.” The delta of your covered call determines your probability of having shares called away, the premium you collect, and your maximum upside. It deserves the same attention as your put delta selection.
5. Confusing option delta with portfolio delta. An individual option at -0.25 delta seems conservative. But five simultaneous positions at -0.25 delta give you a portfolio delta of -1.25, equivalent to being short 125 shares. In a market selloff, all five positions move against you simultaneously. Individual trade delta is about position sizing. Portfolio delta is about survival.
Delta Quick Reference for Wheel Strategy Traders
| Situation | Recommended Delta | Why |
|---|---|---|
| Standard CSP – stock you want to own | -0.25 to -0.30 | Good premium, assignment is acceptable |
| CSP – stock at all-time high | -0.15 to -0.20 | Extra safety margin since pullback risk is elevated |
| CSP – after a major pullback | -0.30 to -0.35 | Stock is already discounted. Higher delta = more premium at an already attractive price. |
| CC – want to keep shares | 0.20 to 0.25 | Low probability of being called away |
| CC – willing to sell shares | 0.30 to 0.40 | Higher premium, happy to sell at the strike |
| CC – cost basis is well below current price | 0.35 to 0.45 | You profit either way. Collect maximum premium. |
| High IV environment | Reduce by 0.05-0.10 | Rich premiums at lower delta. Extra safety margin. |
| Low IV environment | Increase by 0.05-0.10 or skip | Thin premiums need higher delta, or don’t sell at all. |
| Position delta drifted above 0.50 | Close, roll, or accept assignment | Position is more likely to be assigned than not. Make a decision. |
Related Articles
- Options Greeks Guide: Delta, Theta, Gamma & Vega Explained
- Options Greeks in Detail: How They Work Together
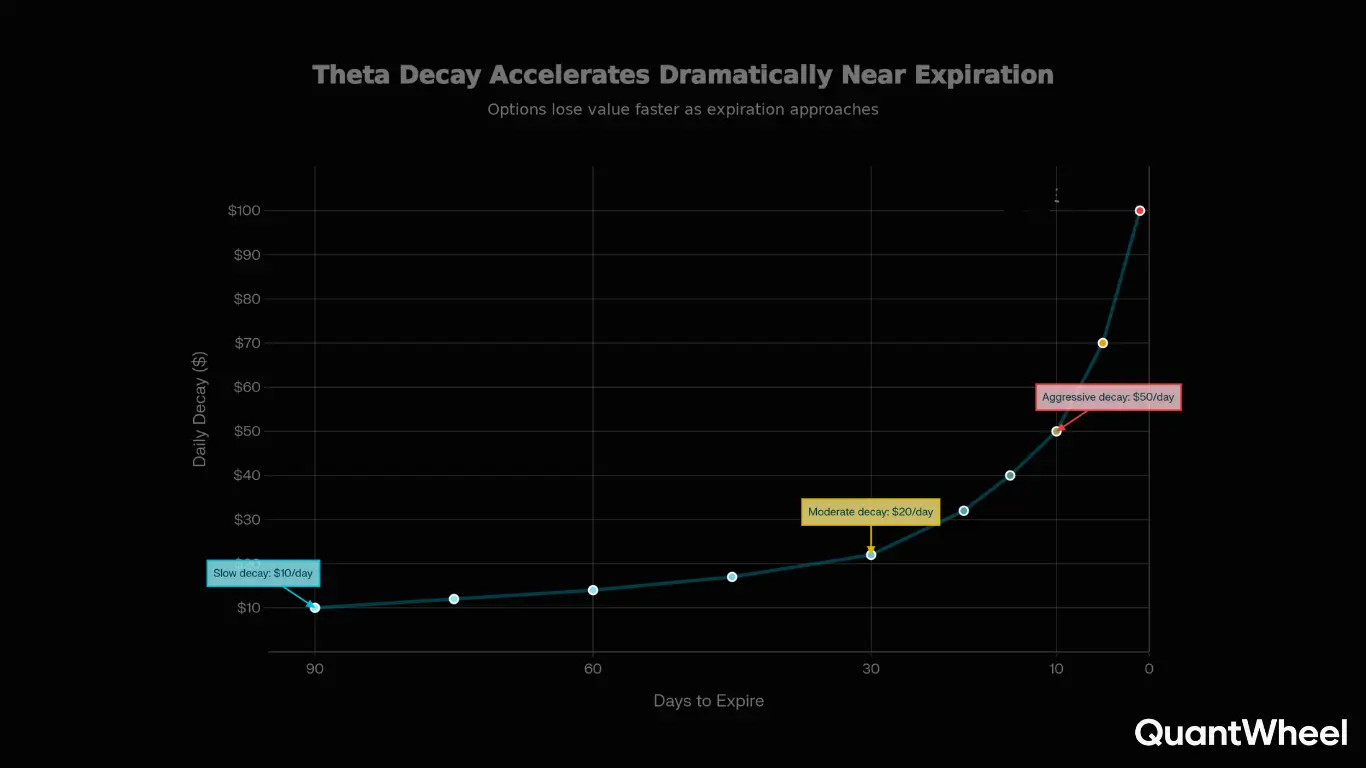
- Theta and Time Decay: How Options Sellers Make Money
- Gamma Explained: Why Options Get Risky Near Expiration
- Vega Explained: How Volatility Affects Your Options
- How to Select the Right Strike for Cash-Secured Puts
- How to Select the Right Strike for Covered Calls
- Implied Volatility Explained for Options Traders
- Position Sizing for Options Traders
Risk Disclosure: Options trading involves substantial risk and is not suitable for all investors. Past performance does not guarantee future results. This content is for educational purposes only and should not be considered investment advice. Always do your own research and consider consulting with a financial advisor before making investment decisions. The examples used in this article are for educational purposes only and are not recommendations to buy or sell any security.