If you have ever looked at two options on the same stock with identical strike prices and expiration dates, only to find that one costs significantly more than the other at different points in time, that’s implied volatility at work.
Author: David Romic – retail options trader and active member in the options trading communities on Reddit (u/thedavidromic).
I share wheel strategy setups, trade management, and lessons learned from real positions.
TLDR: Implied Volatility Explained in 60 Seconds
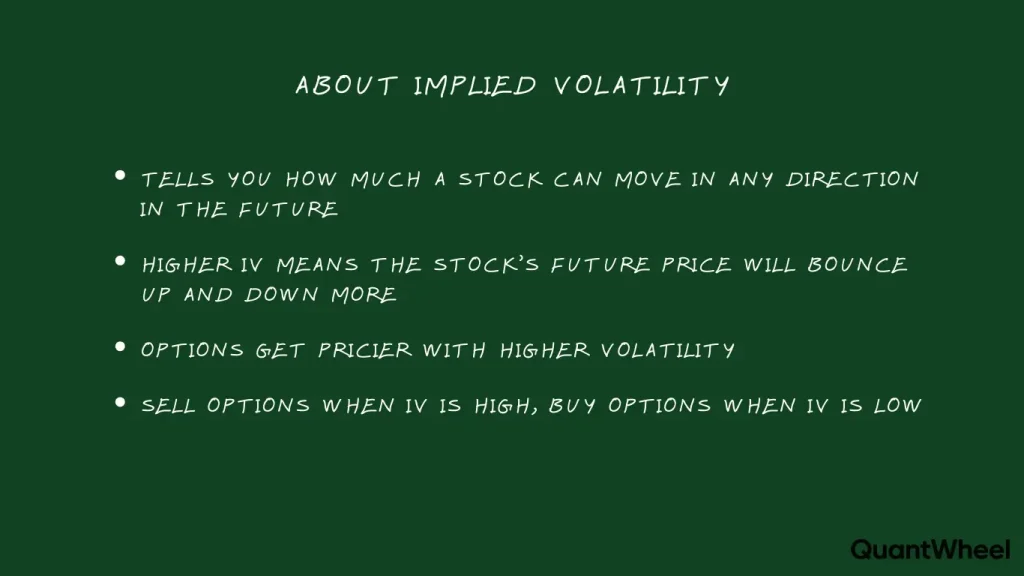
What is implied volatility? It is a number (expressed as a percentage) that tells you how much the market thinks a stock will move over the next year. It comes from option prices — not from the stock itself.
Why does it matter? Because it directly controls how much options cost.
High IV = expensive options = bigger premiums when you sell.
Low IV = cheap options = smaller premiums.Simple example: Imagine Stock ABC trades at $100. If IV is 20%, the market expects the stock to move roughly $20 (up or down) over the next year.
If IV jumps to 50%, the market now expects a $50 move.
That uncertainty makes options way more expensive.The bottom line: If you sell options (cash-secured puts, covered calls, or the wheel strategy), you want to sell when IV is high because you collect more premium.
If you buy options, you want to buy when IV is low because they are cheaper.
High IV also means more risk, so you need to manage your positions carefully.One sentence summary: Implied volatility tells you how scared or calm the market is, and that fear level sets the price of every option you trade.
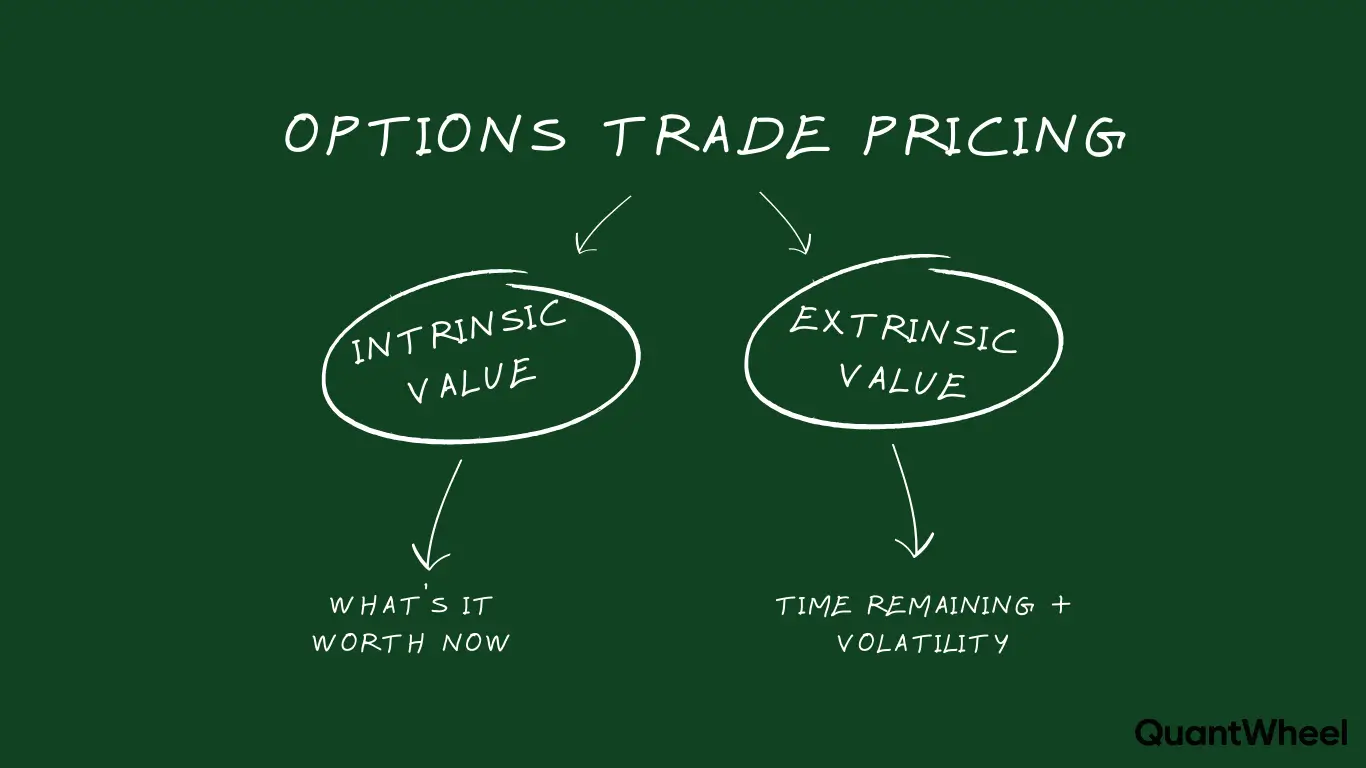
What Is Implied Volatility? The Foundation
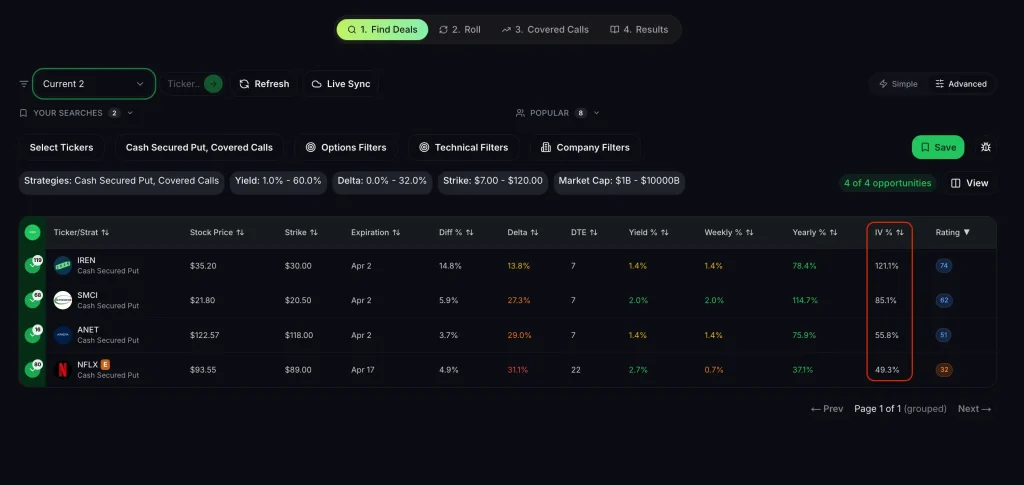
You can see above that the higher IV % is, the better Cash- Secured put opportunities are found.
Find more opportunities like this→
Implied volatility is a forward-looking metric that represents the market’s consensus expectation of how much a stock’s price will fluctuate over a given period.
Unlike historical volatility, which looks backward at what already happened, implied volatility looks forward at what might happen.
Think of it this way: the market has already priced in its expectation about the future. IV simply extracts that expectation from the option’s price tag.
Here is what IV tells you in practical terms:
If a stock is trading at $100 and its options have an implied volatility of 25%, the market is pricing in an expected move of approximately $25 over the next year (one standard deviation). That translates to roughly $7.21 per month or about $1.73 per week.
Useful thing to know:
Expected Move = Stock Price x IV x Square Root of (Days to Expiration / 365)
For a 30-day period on that $100 stock with 25% IV:
$100 x 0.25 x sqrt(30/365) = approximately $7.16
This means the market expects the stock to trade within a range of roughly $92.84 to $107.16 over the next 30 days, about 68% of the time (one standard deviation).
How Implied Volatility Affects Option Prices
Here is where IV becomes directly relevant to your wallet.
Implied volatility is one of the primary inputs in any option pricing model, and its impact on option premiums is significant.
When IV increases, option prices increase — both calls and puts become more expensive. When IV decreases, option prices decrease.
Example:
A stock trades at $100, and you are looking at a $95 put expiring in 30 days.
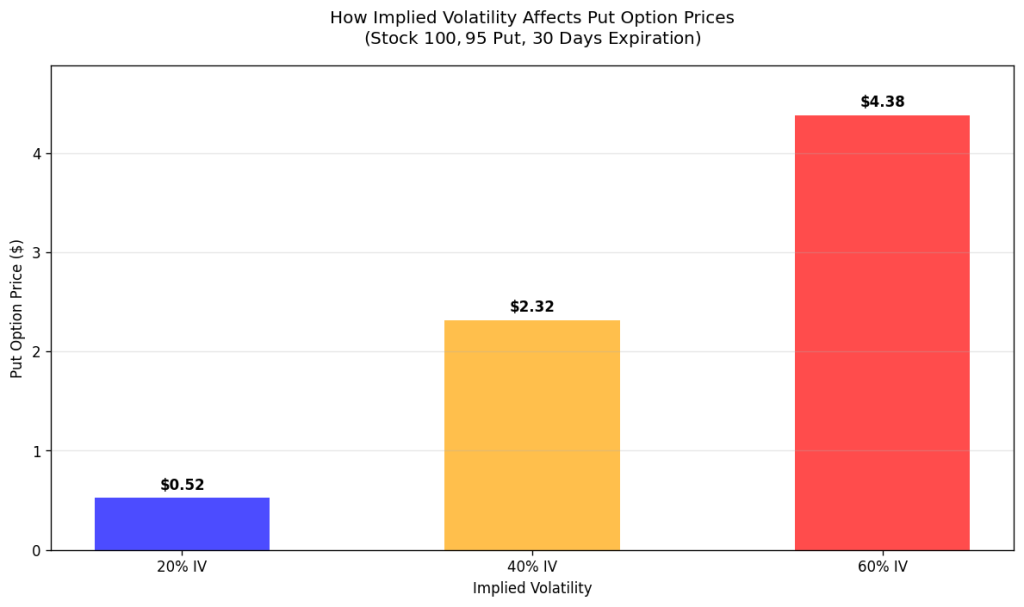
At 20% IV, that put might be worth $0.80. At 40% IV, that same put could be worth $2.50. At 60% IV, it could be worth $4.80.
The strike price did not change. The stock price did not change. The expiration did not change.
Only IV changed, and it nearly quadrupled the price of the option.
For options sellers, this is important.
When you sell a cash-secured put on a stock with elevated IV, you collect significantly more premium than you would on the same stock during a low-IV environment. This is why many wheel strategy traders specifically look for high-IV opportunities — the premium income is simply larger.
But there is a catch.
High IV exists for a reason. The market is pricing in larger expected moves because there is genuine uncertainty.
That means the stock is more likely to make a big move, which could work against your position. Collecting bigger premiums comes with accepting bigger risk. That trade-off is the core of options selling.
Implied Volatility vs. Historical Volatility: Understanding the Difference
One of the most common points of confusion for newer traders is the difference between implied volatility and historical volatility. They measure completely different things.
Historical volatility (HV) is backward-looking. It calculates how much a stock’s price actually moved over a specific past period (typically 20, 30, or 60 trading days).
If a stock bounced around a lot over the last month, its historical volatility will be high. If it traded in a narrow range, HV will be low.
Historical volatility is a fact — it tells you what already happened.
Implied volatility (IV) is forward-looking. It reflects what the market expects to happen in the future.
Because it is derived from option prices, and option prices are set by supply and demand among traders, IV essentially captures the collective fear or confidence of everyone in the market.
When IV is significantly higher than HV, it means the market is pricing in more movement than has actually been occurring.
Some traders interpret this as options being “overpriced” relative to actual price action.
When IV is lower than HV, the market may be underestimating future moves, and options could be considered “underpriced.”
For wheel strategy traders, the IV-to-HV comparison can serve as a useful filter.
If you are looking at a stock where IV is 40% but HV has consistently been around 25%, that stock’s options are pricing in considerably more movement than has historically occurred.
The takeaway:
Screen for wheel strategy trades where IV is significantly higher than HV (e.g., IV/HV > 1.2 or IV rank > 50%) to sell “overpriced” options with fat premiums from market fear, but only on stocks you’d happily own long‑term.
IV Rank and IV Percentile: Putting Implied Volatility in Context
A stock’s raw IV number alone does not tell you whether it is “high” or “low.”
A biotech stock might have a normal IV of 60%, while a utility stock might sit at 15%. Comparing them on raw IV would be meaningless.
IV Rank
IV rank tells you where the current IV sits within the past year’s range. The formula is simple:
IV Rank = (Current IV – 52-Week Low IV) / (52-Week High IV – 52-Week Low IV) x 100
If a stock’s IV ranged between 20% and 60% over the past year, and its current IV is 40%, the IV rank is:
(40 – 20) / (60 – 20) x 100 = 50%
The takeaway:
An IV rank of 50% means implied volatility is right in the middle of its recent range. An IV rank above 50% suggests IV is elevated relative to the past year, making it potentially more attractive for premium sellers. An IV rank below 50% suggests IV is on the lower end.
IV Percentile
IV percentile takes a slightly different approach.
Instead of looking at the range, it calculates the percentage of days over the past year when IV was lower than its current level.
If a stock’s IV percentile is 80%, that means IV was lower than today’s reading on 80% of the trading days over the past year. In other words, today’s IV is higher than it has been 80% of the time.
Both metrics are valuable. IV rank is sensitive to extreme spikes (one day of very high IV can skew the range), while IV percentile provides a more stable picture of where IV typically sits.
Many wheel strategy traders use IV rank or IV percentile as a screening filter. Some traders prefer to sell options when IV rank is above 30-50%, as it indicates premiums are at least moderately elevated relative to the stock’s own history.
What Causes Implied Volatility to Change?
Implied volatility is not static. It moves constantly based on a combination of factors that affect market sentiment and option demand.
Earnings Announcements
Earnings are the single most predictable cause of IV expansion. In the weeks leading up to a company’s quarterly earnings report, IV steadily climbs because nobody knows what the results will be. The uncertainty about revenue, earnings per share, and forward guidance drives demand for options (both calls and puts), which pushes premiums and IV higher.
After the earnings announcement, this uncertainty disappears almost overnight. IV collapses sharply — an event known as “IV crush.” Even if the stock moves in the direction you predicted, the rapid decline in IV can reduce the value of options you purchased, sometimes resulting in a loss despite being right about direction.
For wheel strategy traders, IV crush presents both a risk and an opportunity. Selling a cash-secured put before earnings means you collect elevated premium, but you also take on the risk of a large post-earnings move. Some traders avoid selling into earnings altogether. Others sell puts on stocks they would be happy to own at the strike price, accepting the assignment risk in exchange for the inflated premium.
Market-Wide Fear and Uncertainty
Broad market selloffs tend to increase IV across the board. When the market drops sharply, fear spikes, and traders rush to buy protective puts. This increased demand for options drives up premiums and IV.
The VIX — often called the “fear index” — is actually a measure of implied volatility on S&P 500 options. When the VIX rises, it indicates that the market as a whole expects larger moves. During the 2020 COVID crash, the VIX reached levels above 80, compared to its long-term average in the 15-20 range. That kind of environment made option premiums extraordinarily expensive.
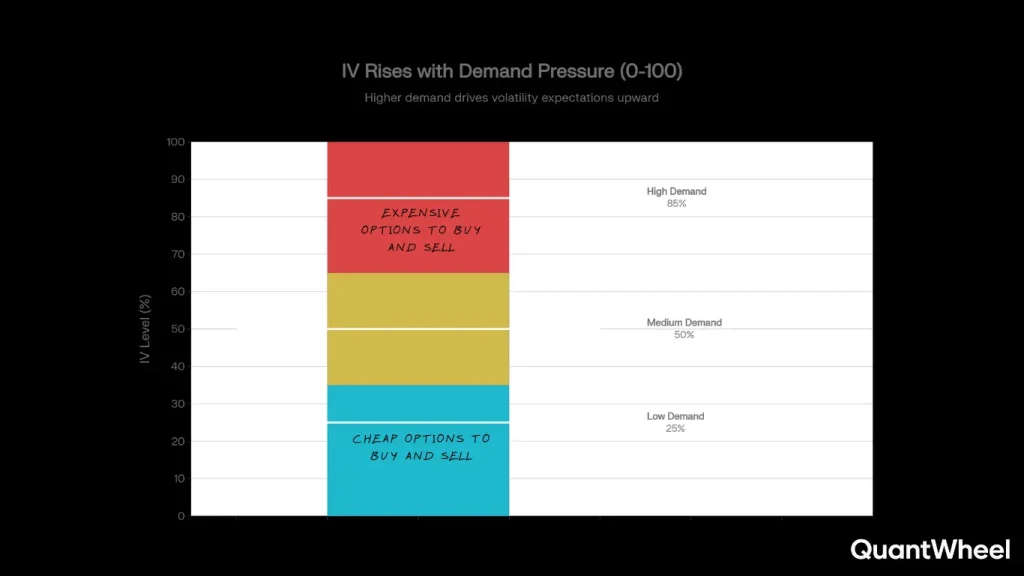
Supply and Demand for Options
At its core, implied volatility is driven by option supply and demand. When more traders want to buy options (creating demand), market makers raise prices, which increases IV. When selling activity dominates, prices drop, and IV falls.
Specific events that drive demand include not just earnings but also FDA announcements (for biotech stocks), merger and acquisition activity, regulatory decisions, geopolitical tensions, and major economic data releases like jobs reports or Federal Reserve announcements.
Time and Volatility Mean Reversion
Implied volatility tends to be mean-reverting. After a spike, IV usually drifts back toward its average over time. After a period of unusually low IV, it often expands. This tendency creates a natural cycle that informed traders can use to their advantage.
Understanding this mean reversion is particularly useful for wheel traders. If you sell a cash-secured put when IV is elevated, and IV subsequently contracts back toward its average, the option loses value faster — which is exactly what you want as a seller.
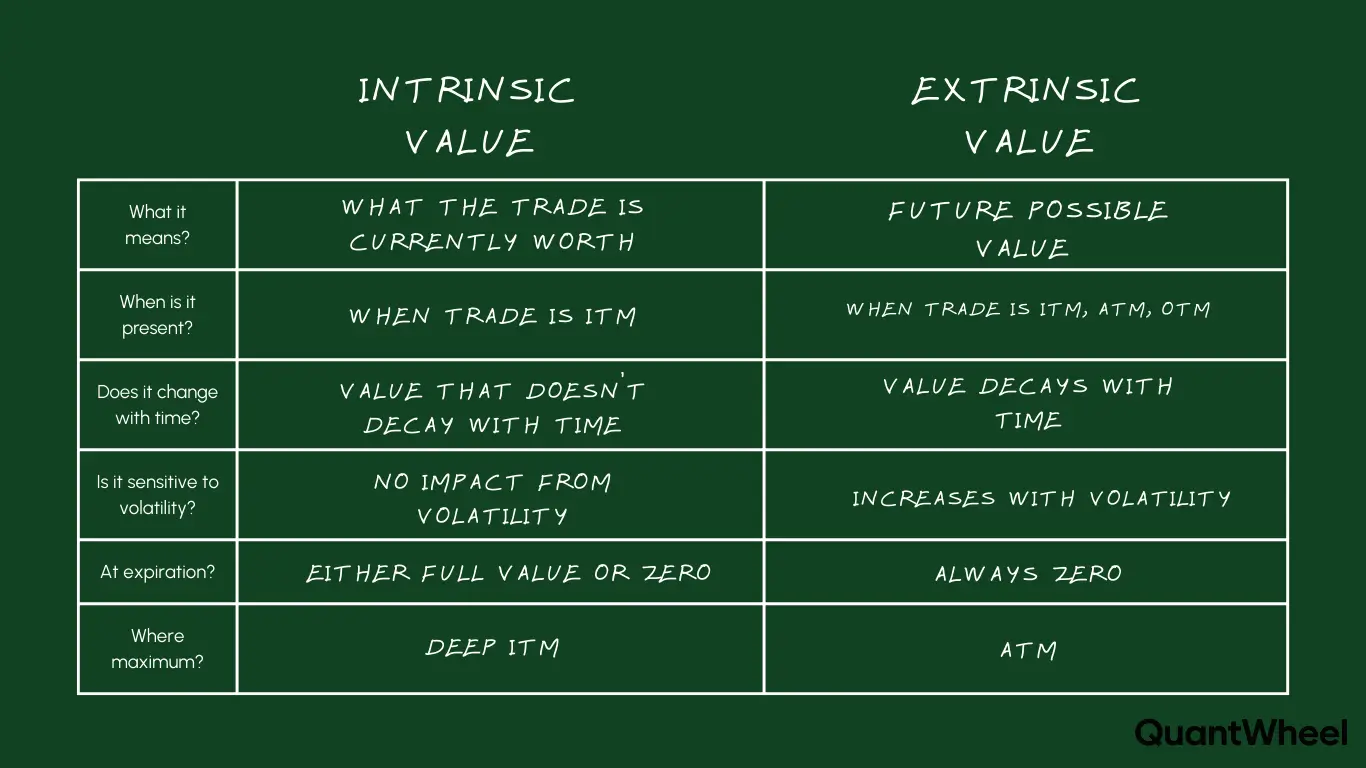
The Greeks and Implied Volatility: Understanding Vega
Options traders use a set of risk metrics called “the Greeks” to understand how different factors affect option prices. The Greek that measures sensitivity to changes in implied volatility is called vega.
Vega tells you how much an option’s price will change for a 1% change in implied volatility. If an option has a vega of 0.15, a 1% increase in IV will increase the option’s price by $0.15, and a 1% decrease in IV will reduce the price by $0.15.
A few important things to know about vega:
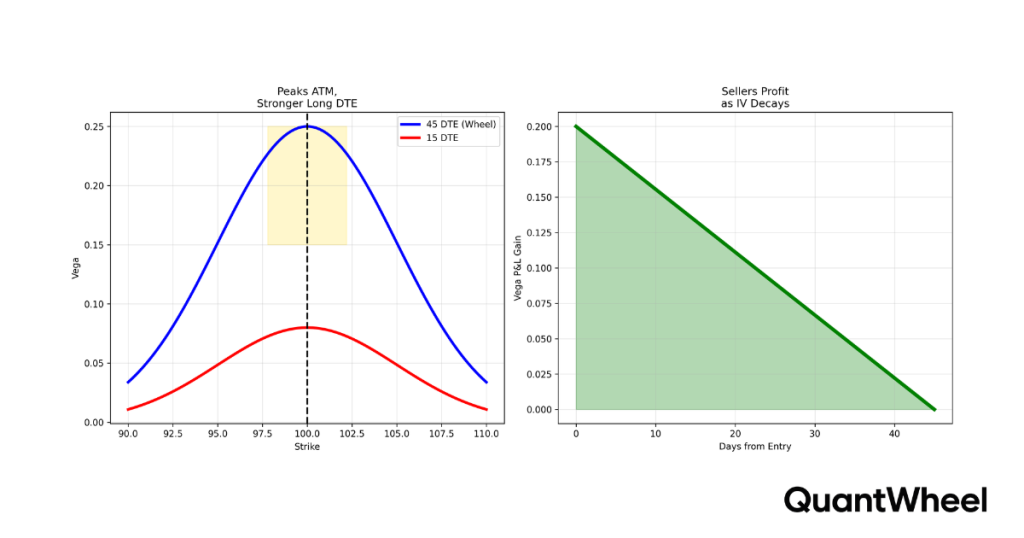
Vega is highest for at-the-money (ATM) options and decreases as options move further in-the-money or out-of-the-money. This means ATM options are most sensitive to changes in IV.
Vega is higher for options with more time until expiration. A 60-day option will have more vega than a 30-day option at the same strike. This is because longer-dated options have more time for volatility to play out, making them more sensitive to IV changes.
For options sellers, vega works in your favor when IV decreases after you sell. If you sell a put with 0.15 vega and IV drops by 5%, the option loses $0.75 in value from the IV decline alone — that is profit in your pocket, separate from any theta decay or directional move.
This is why experienced wheel traders often aim to sell options when IV is elevated. They benefit from both theta decay (time passing) and potential vega profit (IV contracting back toward normal).
Volatility Skew: Why IV Differs Across Strike Prices
If you look at a stock’s option chain, you will notice that implied volatility is not the same for every strike price. This variation is called volatility skew.
In most equity options, out-of-the-money (OTM) puts tend to have higher IV than at-the-money options, while out-of-the-money calls often have lower IV. This creates a “skew” where the left side of the IV curve (lower strikes) is higher than the right side (higher strikes).
This happens because institutional investors and portfolio managers frequently buy OTM puts as insurance against market crashes. This persistent demand for downside protection inflates the IV of lower strike puts. The market essentially charges more for crash insurance, which makes sense — the further down a stock falls, the more catastrophic the damage.
For wheel strategy traders, volatility skew has practical implications. When you sell an OTM cash-secured put, you are selling into relatively higher IV compared to the ATM level. This means you are collecting proportionally more premium for taking on downside risk. Understanding skew helps you evaluate whether the premium you are collecting adequately compensates you for the risk of assignment at that particular strike.
IV Crush: The Volatility Trap That Catches Beginners
IV crush is one of the most important practical concepts for any options trader to understand, yet it catches beginners off guard consistently.
IV crush happens when implied volatility drops sharply and suddenly.
The most common trigger is an earnings announcement, but it can happen after any binary event where uncertainty is resolved.
Here is how it works in practice. Imagine a stock is trading at $100 before earnings. IV has expanded to 60% in anticipation of the report. You buy a $100 call for $5.00, expecting the stock to go up on good earnings. The company reports excellent numbers, and the stock rises to $103.
You might expect your call to be worth more than $5.00 since the stock moved in your favor. But after earnings, IV collapses from 60% to 30%. The massive drop in IV sucks value out of the option. Your $100 call might now be worth only $4.20, despite the stock being $3 higher. You were right about direction but wrong about the volatility trade.
For options sellers, IV crush is a tailwind. If you sold a cash-secured put before earnings and IV collapses afterward, the put loses value quickly from the IV decline, even if the stock does not move much. This is one reason why some aggressive wheel traders deliberately sell puts into elevated pre-earnings IV — they profit from the crush.
However, this comes with a warning. The stock can still make a massive move on earnings. If the company disappoints and the stock drops 15%, IV crush will not save you. The directional loss will overwhelm any benefit from IV contraction. This is why understanding both the opportunity and the risk of IV crush is critical.
How to Use Implied Volatility in the Wheel Strategy
Now let us connect all of this to practical application. If you run the wheel strategy — selling cash-secured puts, getting assigned, selling covered calls, and repeating — implied volatility should be central to your decision-making process at every stage.
Step 1: Screening for High-IV Opportunities
When looking for wheel candidates, IV rank and IV percentile serve as excellent screening criteria. Many traders look for stocks with an IV rank above 30-50% as a minimum threshold, ensuring they are not selling options when premiums are at the low end of the range.
Using a purpose-built screener that filters for IV rank, delta, days to expiration, and premium yield simultaneously can save enormous time compared to manually checking tickers one by one. QuantWheel’s screener, for example, scans 570K+ contracts in seconds, filtering by IV rank alongside fundamentals and yield calculations — something that would take hours manually.
Step 2: Timing Your Cash-Secured Put Entries
When selling cash-secured puts, higher IV means higher premiums. But it also means the market expects larger moves. The key is to find the balance: sell when IV is elevated enough to provide meaningful premium, but on stocks where you are genuinely comfortable owning shares at the strike price if assigned.
Check the IV rank before every new position. If IV rank is below 20%, the premium you collect may not adequately compensate you for the risk of assignment. If IV rank is above 50%, premiums will be juicy, but make sure you understand why IV is elevated (upcoming earnings, sector risk, macro uncertainty).
Step 3: Managing Positions Through IV Changes
Once you have open positions, changes in IV directly affect their value. If IV rises after you sold a put, the option increases in value (bad for you as a seller). If IV falls, the option decreases in value (good for you).
Monitor the IV environment of your positions. If you sold a put and IV spikes due to a market-wide selloff, the option may show an unrealized loss even if the stock has not moved much. Do not panic — if nothing has changed with the underlying company, the elevated IV may be temporary.
Step 4: Selling Covered Calls After Assignment
After getting assigned on a cash-secured put, you own shares and start selling covered calls. IV is just as important at this stage. If IV is still elevated, your covered calls will command higher premiums. If IV has contracted (common after earnings), premiums will be smaller.
Here is where many traders lose track. After multiple assignments across several stocks, with puts being sold, assignments happening, and covered calls layered on top, tracking cost basis and premium collected becomes a serious challenge. Your broker shows your purchase price, but your real cost basis includes the premium you collected from the original cash-secured put. After three or four cycles on the same stock, the math gets complex.
This is exactly why QuantWheel’s Wheel Native Journal exists. It automatically adjusts your cost basis when you get assigned and tracks the full wheel cycle — from the initial cash-secured put through assignment to covered calls and exit — so you always know your real breakeven and total premium collected without maintaining a complex spreadsheet.
Step 5: Using IV to Decide When to Roll
When an option is moving against you, you may consider rolling — closing the current position and opening a new one at a different strike or expiration. IV plays a role here too.
If IV has expanded since you opened the position, the option you are trying to close will be more expensive (working against you). Rolling in a high-IV environment can feel punishing because you are buying back an inflated option. Conversely, if IV has dropped, rolling becomes cheaper.
Understanding whether the IV expansion is temporary (event-driven) or structural (fundamental change in the stock’s risk profile) helps you decide whether to roll, hold, or accept assignment.
Common Implied Volatility Mistakes to Avoid
Understanding implied volatility is one thing. Avoiding the common mistakes associated with it is another. Here are the pitfalls that trip up traders most often.
Confusing IV with Direction
IV does not tell you whether a stock will go up or down. It only tells you about the expected magnitude of the move. A stock with 50% IV is expected to make large moves, but those moves could be in either direction. Traders who see high IV and assume the stock will crash (or rocket higher) are misinterpreting the signal.
Ignoring IV When Entering Trades
Some traders pick options based solely on strike price and expiration without checking IV. This is like shopping without looking at price tags. You might be selling a cash-secured put when IV is at its lowest point in a year, collecting a fraction of the premium you could earn by waiting a few days or weeks for IV to expand.
Chasing High IV Without Understanding the Risk
On the flip side, some traders specifically seek out the highest-IV options they can find, thinking bigger premium automatically means a better trade. But extremely high IV often signals genuine danger — the market is pricing in a large move for a reason. Selling puts on a biotech stock with 120% IV ahead of an FDA decision might look attractive on premium alone, but the potential for a 50% gap down makes the risk-reward far less favorable than it appears.
Not Accounting for IV Crush in Buying Strategies
If you buy options — especially ahead of events like earnings — you need to account for the fact that IV will collapse after the event. Your trade needs the stock to move far enough to overcome both the premium you paid and the value lost to IV contraction. This is a much higher bar than most beginners realize.
Treating All Stocks’ IV the Same
A 30% IV on a stable blue-chip stock is very different from a 30% IV on a volatile biotech. Always contextualize IV relative to the specific stock’s history using IV rank or IV percentile. What is “high” for one stock may be “low” for another.
Implied Volatility and the VIX: The Bigger Picture
No discussion of implied volatility is complete without mentioning the VIX. The CBOE Volatility Index (VIX) is a real-time measure of implied volatility on S&P 500 index options. It represents the market’s expectation of 30-day volatility and is widely used as a barometer of overall market fear.
When the VIX is low (below 15), the market is calm and complacent. Option premiums across the board tend to be lower. When the VIX is elevated (above 25-30), fear is running high, and premiums expand significantly.
For wheel strategy traders, the VIX provides useful context. A rising VIX environment means premiums on individual stock options are likely expanding as well, which creates better entry opportunities for new cash-secured puts. A falling VIX environment suggests premiums are contracting, and you may want to be more selective about new positions.
The VIX also tends to spike sharply and decline gradually. This asymmetric behavior means that selling options during VIX spikes can be especially profitable if the market stabilizes afterward — you sold at inflated premiums, and the subsequent IV contraction accelerates your profits.
Implied Volatility and the Wheel Strategy: A Practical Example
Let us walk through a complete example tying implied volatility concepts to a wheel strategy trade.
You are considering running the wheel on Stock XYZ, which trades at $50. Here is the data you gather:
- Current IV: 35%
- 52-Week IV Range: 20% to 45%
- IV Rank: 60% — meaning IV is in the upper portion of its annual range
- IV Percentile: 72% — meaning IV was lower than today on 72% of trading days last year
- Historical Volatility (30-day): 28%
- Next earnings: 45 days away
The IV rank of 60% tells you premiums are elevated relative to the past year. The fact that IV (35%) is higher than HV (28%) suggests options are pricing in more movement than has recently occurred. Earnings are 45 days out, so IV has not yet expanded to pre-earnings levels.
You decide to sell a $47 cash-secured put expiring in 30 days (before earnings). At 35% IV, the premium is $1.20 per share ($120 per contract). If IV were at the low end of its range (20%), the same put might only be worth $0.45. You are collecting roughly 2.7 times more premium because of the elevated IV environment.
Over the next 30 days, two things can happen in your favor: theta decay erodes the option’s time value day by day, and if IV contracts toward its average, vega decay provides additional profit. If the stock stays above $47 at expiration, you keep the full $1.20 premium.
If the stock drops below $47 and you get assigned, your effective cost basis is $45.80 ($47 strike minus $1.20 premium). You then sell covered calls on your 100 shares, again looking for elevated IV to maximize premium collection.
Start Your Free Trial of QuantWheel
Understanding implied volatility is essential. But applying it across multiple positions, tracking premium collected, monitoring IV rank changes, and managing cost basis through assignments — that is where the real work happens.
QuantWheel was built specifically for wheel strategy traders who take this seriously. It handles the tedious tracking automatically, so you can focus on what matters: finding the right trades at the right IV levels and managing your portfolio systematically.
Start your free trial of QuantWheel →
Risk Disclosure: Options trading involves substantial risk and is not suitable for all investors. Past performance does not guarantee future results. This content is for educational purposes only and should not be considered investment advice. Always do your own research and consider consulting with a financial advisor before making investment decisions.
The examples used in this article are for educational purposes only and are not recommendations to buy or sell any security. All investment decisions should be based on your own analysis and risk tolerance.