You're staring at a screen full of numbers, strike prices, and Greek letters that look like a foreign language. You know there's valuable information in that options chain, but figuring out what actually matters feels overwhelming.
Problem: Figure out which strike price to pick or expiration date because you don't understand what you're looking at. Solution: Find a screener that finds what's worth it and just copy the deal that you like.
Here's how it looks like:
TL;DR: How to Read an Options Chain
An options chain is a table showing all available options contracts for a stock, organized by expiration date and strike price. Here's what matters most:
The basics: Each row represents one contract (controlling 100 shares). Call options let you buy stock at the strike price; put options let you sell at the strike price. Options are grouped by expiration date, with contracts expiring on the same date shown together.
What to look for first: Start with the strike price (the price where the option becomes profitable) and the bid/ask spread (what you'll actually pay). Next, check volume and open interest to ensure the option trades actively enough to enter and exit easily.
Real example: Say Apple (AAPL) trades at $180. Looking at the options chain for options expiring in 30 days, you see a $175 strike call option with a bid of $7.20 and an ask of $7.40. This means you'd pay around $740 to buy one contract (7.40 × 100 shares), and if AAPL stays above $182.40 by expiration ($175 strike + $7.40 paid), you profit.
The Greeks tell the story: Delta (0.68 in this example) means for every $1 AAPL moves up, your option gains about $0.68. Theta (-0.08) means you lose about $8 per day to time decay. These metrics help you predict how your position behaves.
For wheel strategy traders specifically: When selling cash-secured puts, focus on strike prices at or below the current price (out-of-the-money), check the bid price (what you'll collect as premium), and verify the delta is around 0.30 or lower for conservative trades. Volume above 50 and tight bid/ask spreads make for smooth execution.
What Is an Options Chain?
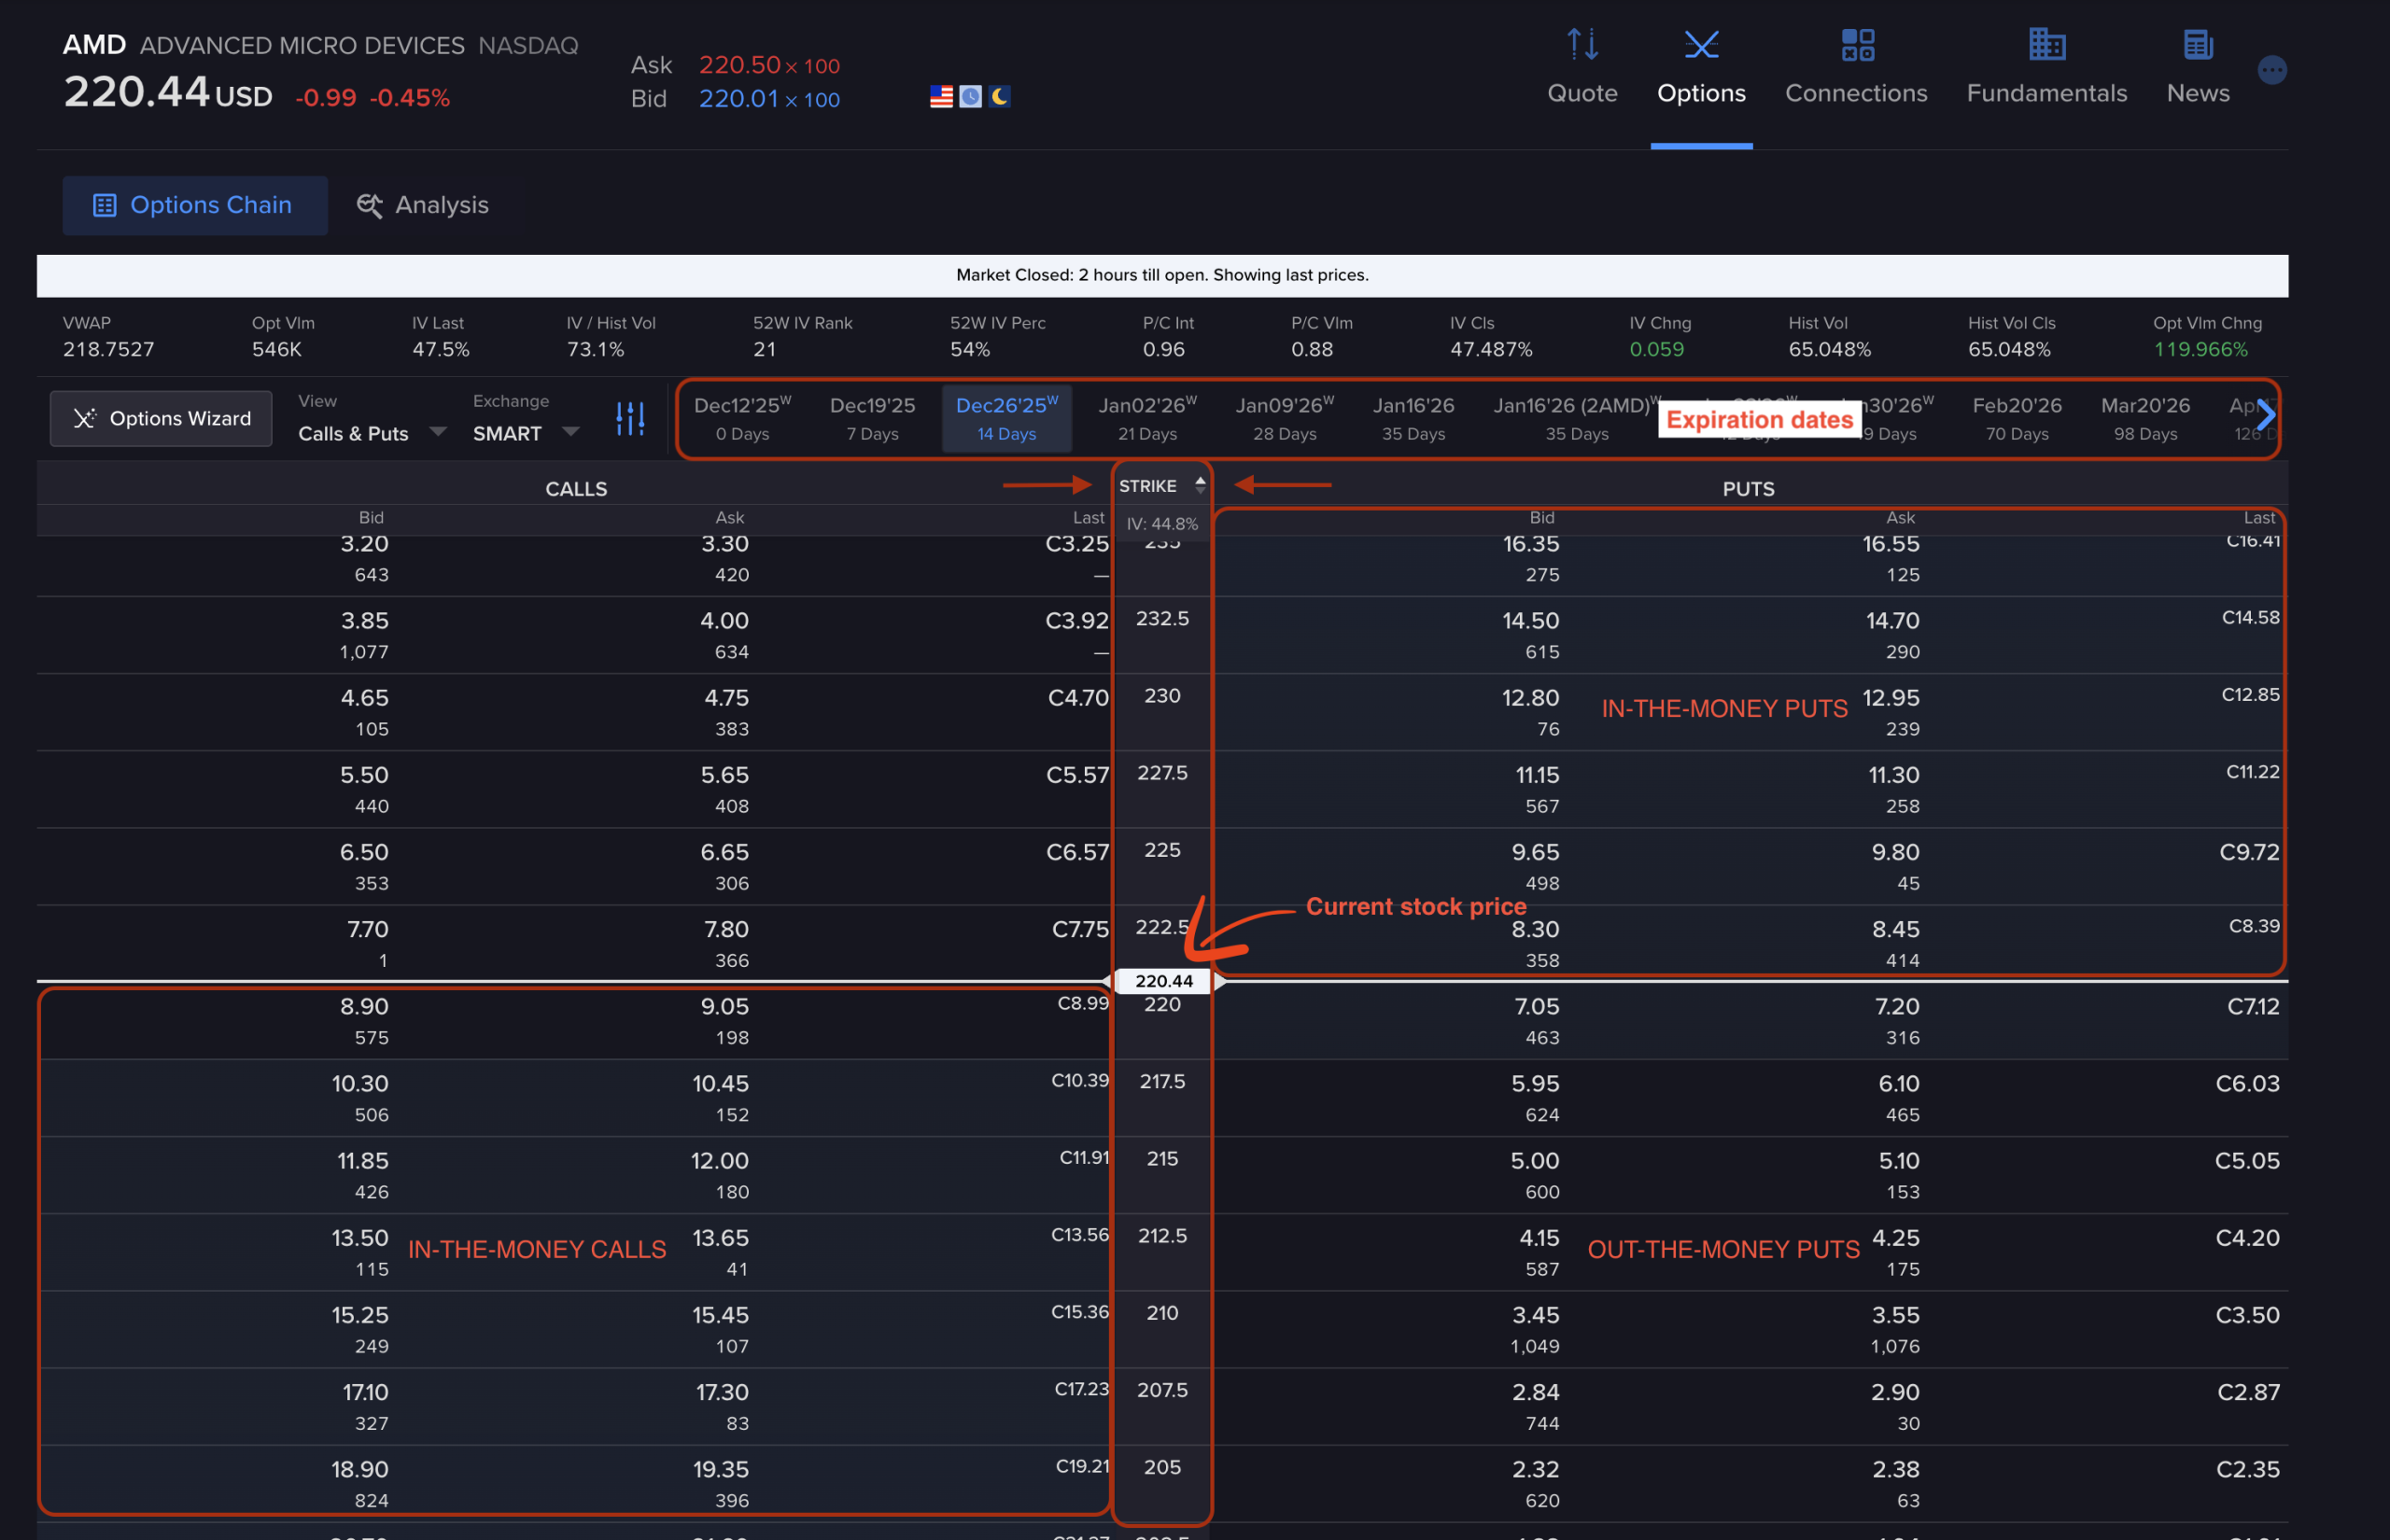
An options chain is a comprehensive table that displays every available options contract for a specific underlying stock or ETF. Think of it as a menu of contracts you can buy or sell, organized by two main factors: strike price and expiration date.
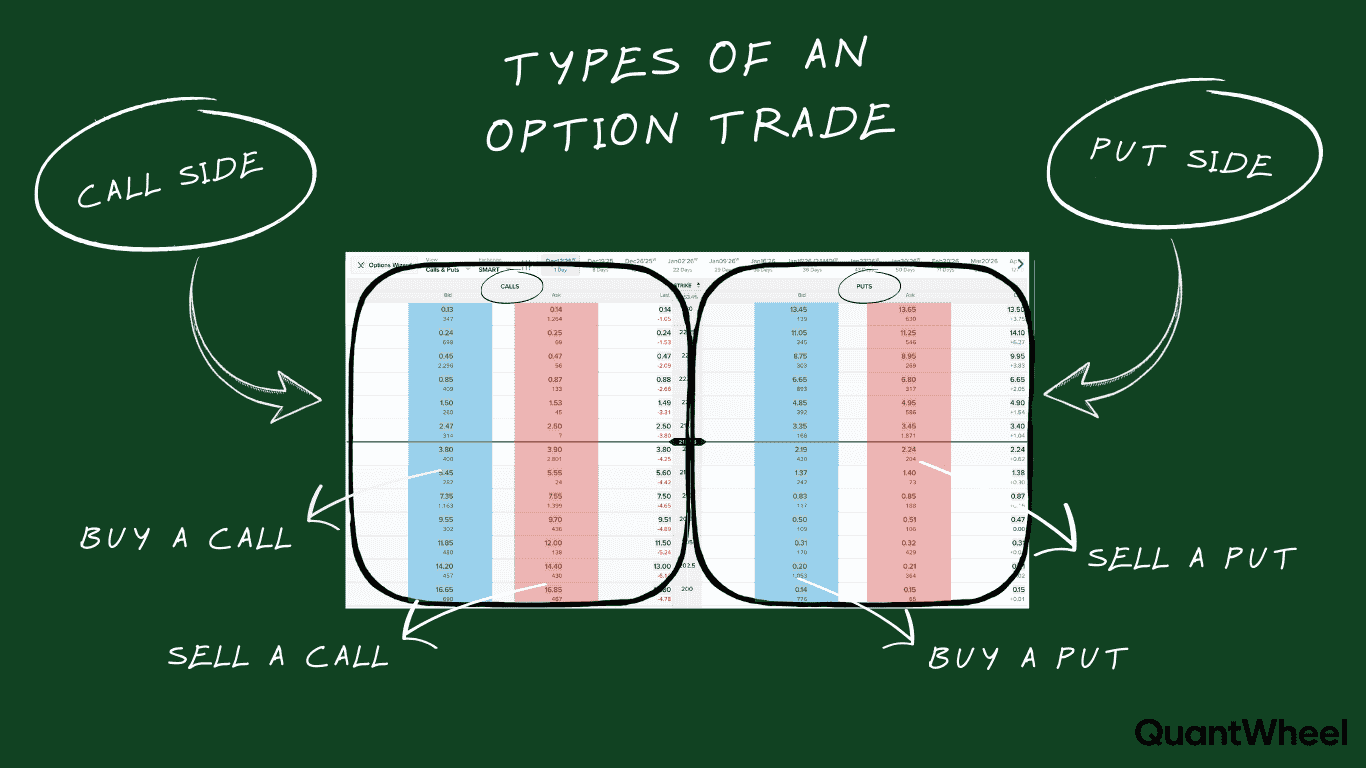
Every options chain splits into two sides. Call options appear on one side (usually the left), giving the buyer the right to purchase 100 shares of stock at the strike price. Put options appear on the other side (usually the right), giving the buyer the right to sell 100 shares at the strike price.
Your broker might display options chains differently, but they all contain the same core information. ThinkorSwim uses one layout, Robinhood uses another, and platforms like QuantWheel organize the data specifically for wheel strategy traders. The underlying data remains the same regardless of presentation.
When you first pull up an options chain, you'll see what looks like information overload. Dozens or even hundreds of rows of data, multiple expiration dates, Greek letters, volume numbers, and constantly updating prices. This complexity intimidates many traders at first, but you don't need to understand every column to make good trading decisions.
The Basic Layout: How Options Chains Are Organized
Options chains organize contracts in a logical structure once you understand the system. Here's how they work from top to bottom.
Expiration date selection comes first. Before you even see the chain, you select which expiration date you're interested in. Options might expire weekly, monthly, or at other intervals depending on the stock. Popular stocks like SPY, AAPL, and TSLA offer weekly expirations, while less liquid stocks might only have monthly options.
Strike prices run vertically down the center. The strike price is the predetermined price at which the option can be exercised. These typically appear in the middle column and run from low to high. For a stock trading at $100, you might see strikes from $80 up to $120 or beyond, usually in $2.50 or $5 increments.
Calls appear on the left, puts on the right. This standard layout makes it easy to scan. If you're looking to buy calls (betting the stock goes up) or sell covered calls, you look left. For puts (betting the stock goes down or selling cash-secured puts), you look right.
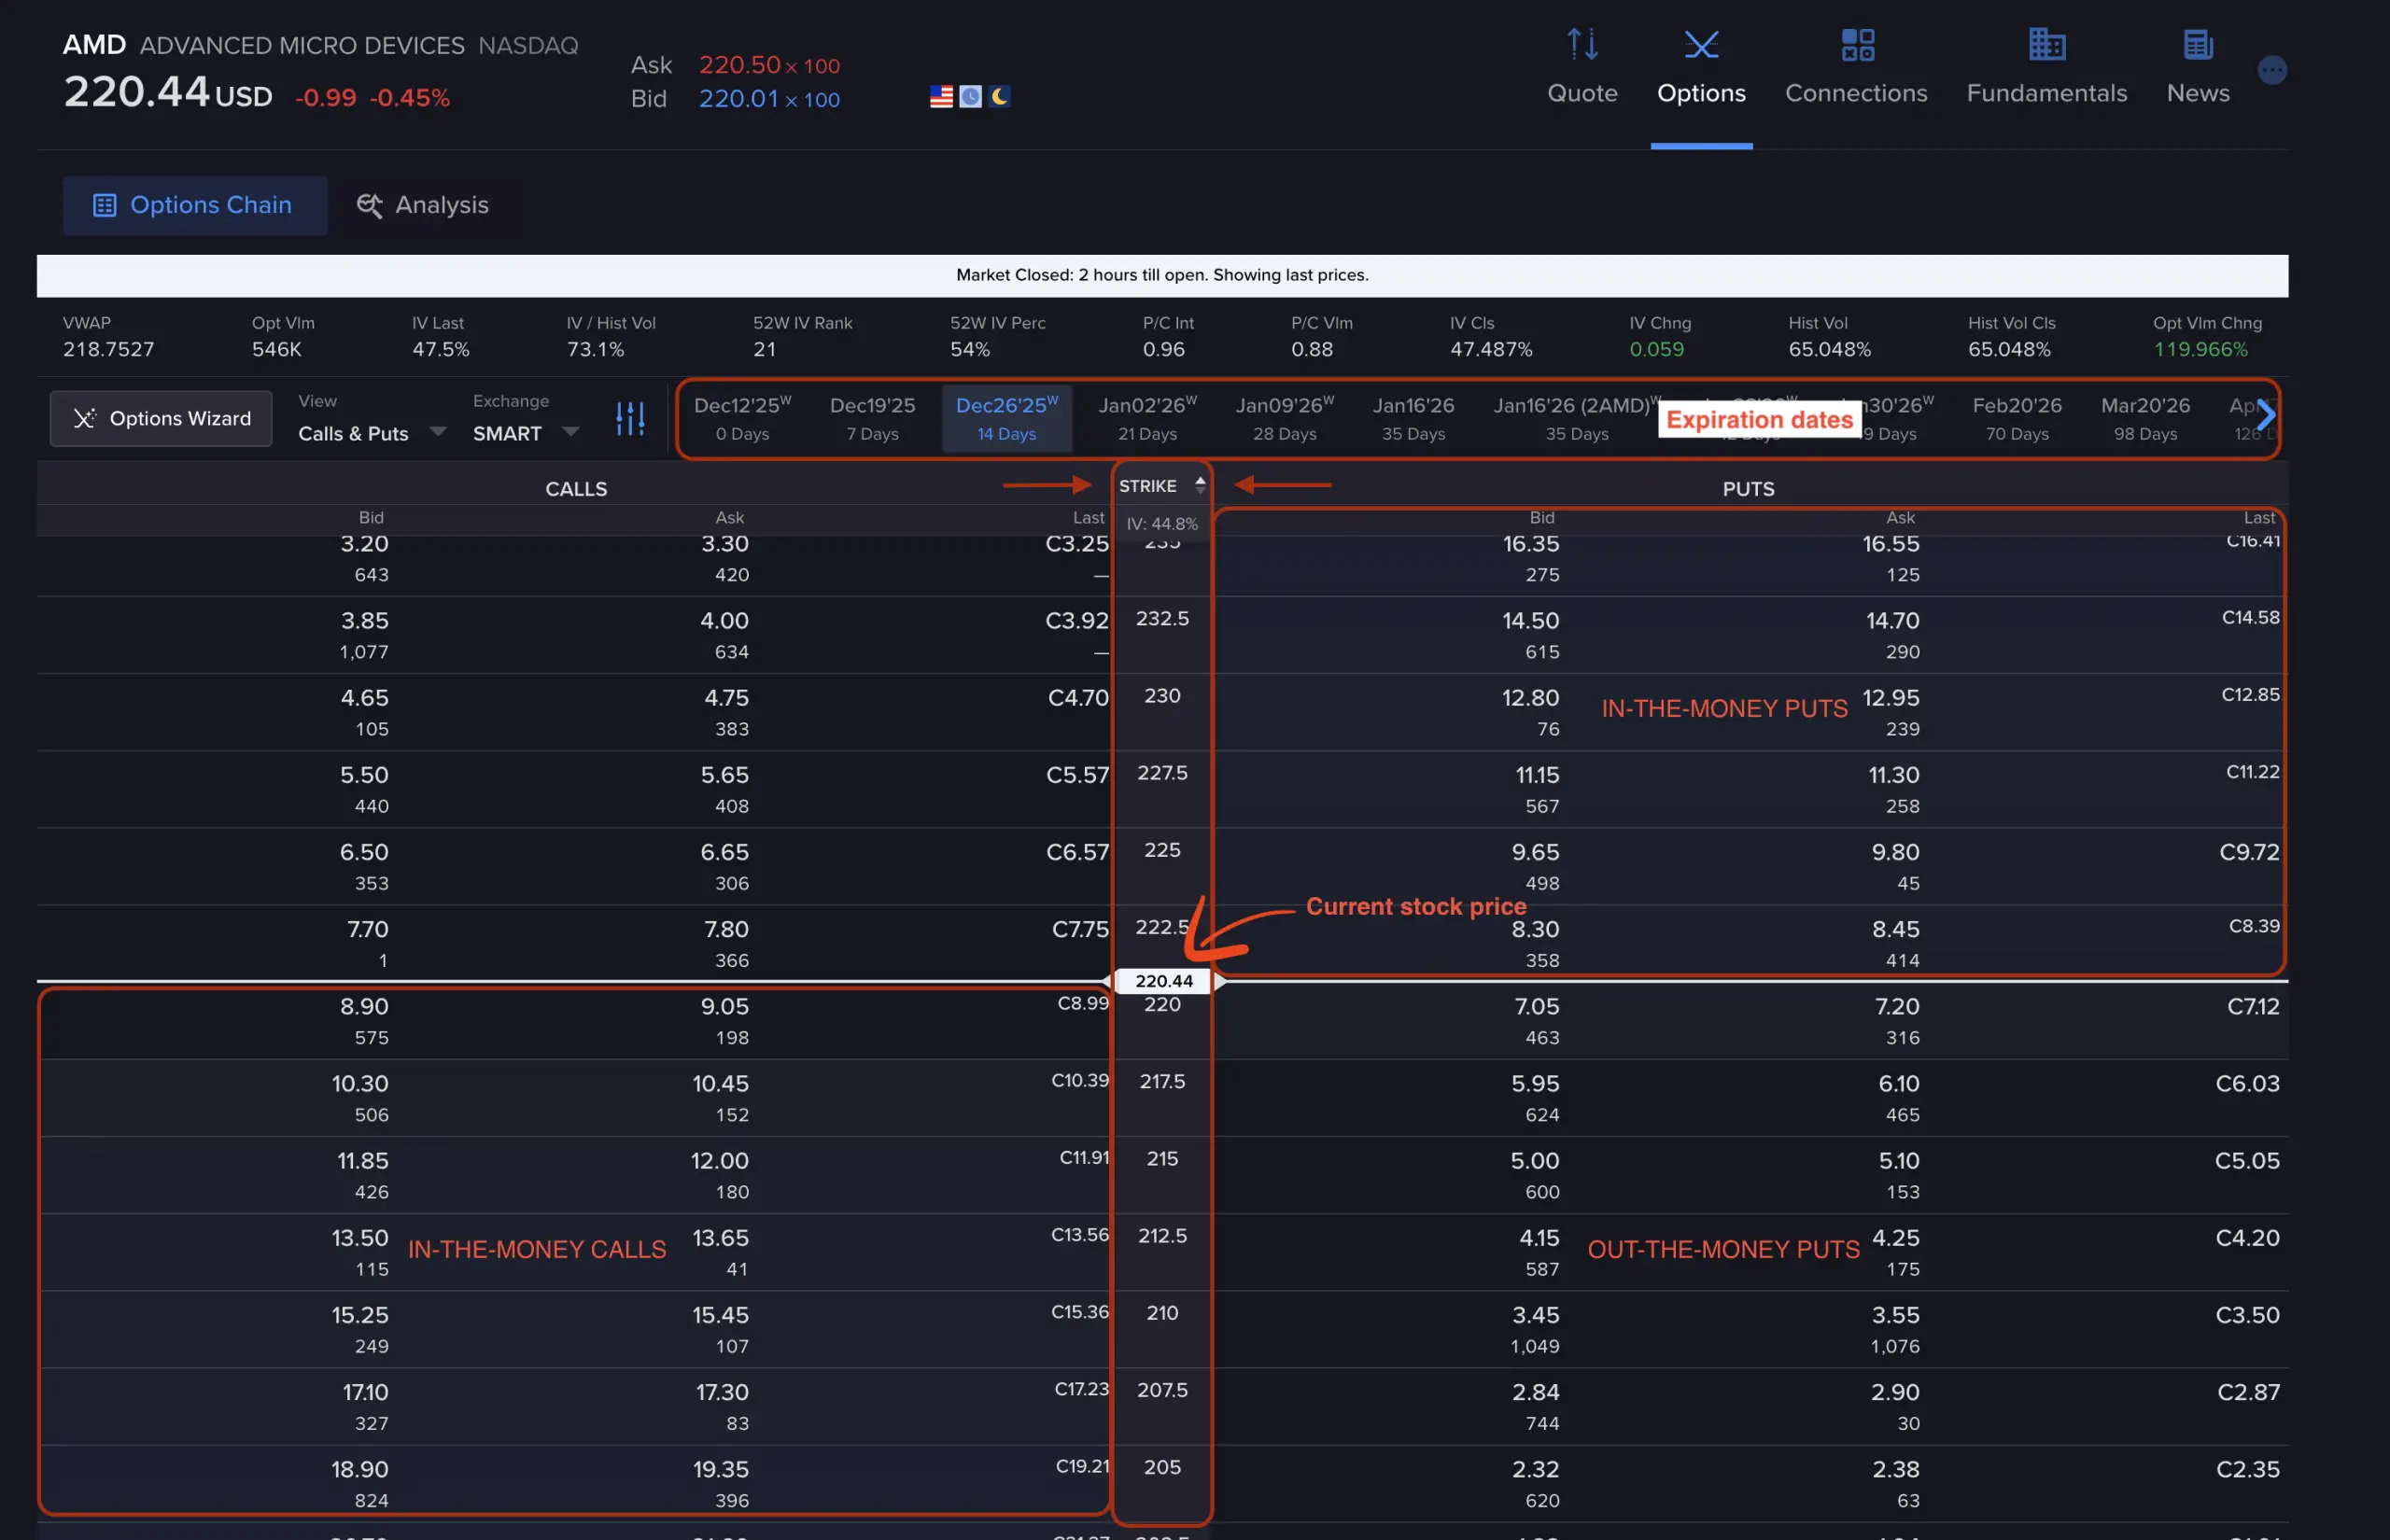
In-the-money vs out-of-the-money creates a dividing line. Options where the strike price would be profitable to exercise immediately are "in-the-money" (ITM). Those that wouldn't be profitable are "out-of-the-money" (OTM). For calls, strikes below the current stock price are ITM; strikes above are OTM. This relationship flips for puts.
The current stock price determines the "at-the-money" strike. This strike price sits closest to the current stock price and typically shows the most volume and open interest. It's the reference point most traders use when scanning the chain.
Critical Columns: What Actually Matters
Not every column in an options chain deserves your attention. Here are the ones that directly impact your trading decisions.
Bid and Ask prices determine what you actually pay. The "Last" price you see is often misleading because it shows the most recent trade, which might have occurred hours ago. The bid is what buyers currently offer to pay. The ask is what sellers currently want to receive. When you buy an option, you pay near the ask price. When you sell, you receive near the bid price. The difference between bid and ask is the spread, and wider spreads cost you money every trade.
Volume shows today's activity. This number tells you how many contracts traded today for that specific strike and expiration. High volume usually correlates with tighter bid/ask spreads and easier order fills. Volume resets to zero at the start of each trading day.
Open interest reveals total existing contracts. Unlike volume, open interest counts all outstanding contracts that haven't been closed or exercised. High open interest indicates an actively traded option where you can enter and exit positions more easily. Open interest updates once daily, after the market closes.
Implied volatility (IV) predicts price movement. This percentage estimates how much the market expects the stock to move. Higher IV means options cost more because traders expect bigger price swings. Lower IV means cheaper options and expectations of calmer price action. For wheel strategy traders, higher IV means better premium collection but potentially more risk.
The Greeks measure different risk factors. These metrics predict how your option's value changes with different market conditions. Delta measures sensitivity to stock price changes. Theta measures time decay (how much value you lose each day). Gamma measures how fast delta changes. Vega measures sensitivity to volatility changes. Learning the Greeks separates casual option buyers from systematic traders.
Understanding Bid, Ask, and Spread
The bid/ask spread impacts your profitability on every single options trade, yet many beginners ignore it completely.
Here's how it works in practice. You're looking at a call option with a bid of $5.20 and an ask of $5.40. If you buy this option, you'll likely pay $5.40 (or very close to it), which costs you $540 for one contract. The market maker immediately profits from the $0.20 spread. If you wanted to sell this option immediately after buying it, you'd receive $5.20, losing $20 instantly due to the spread.
This spread acts as a transaction cost for every trade. Tight spreads (like $0.05 or $0.10 difference) indicate liquid options where market makers compete and volume is high. Wide spreads (like $0.50 or more) signal illiquid options where getting filled at a fair price becomes difficult.
Practical tip: When entering orders, I typically place limit orders between the bid and ask. If the bid is $5.20 and ask is $5.40, I might offer $5.30 to buy. Market makers often split the difference, especially on liquid options. This simple habit saves significant money over time.
For wheel strategy traders, the bid price on cash-secured puts is what you actually collect as premium. If you're comparing two similar strike prices and one has a $0.85 bid while another shows $0.95 bid, that $0.10 difference equals $10 per contract in your pocket. On 10 contracts, that's $100 in additional premium for the same trade structure.
Spreads widen during market volatility, after hours, and on less popular stocks. I avoid trading options with spreads wider than about 5% of the option's price. A $5 option with a $0.50 spread (10% spread) will cost you too much in transaction costs to trade profitably.
Strike Prices: Choosing the Right Level
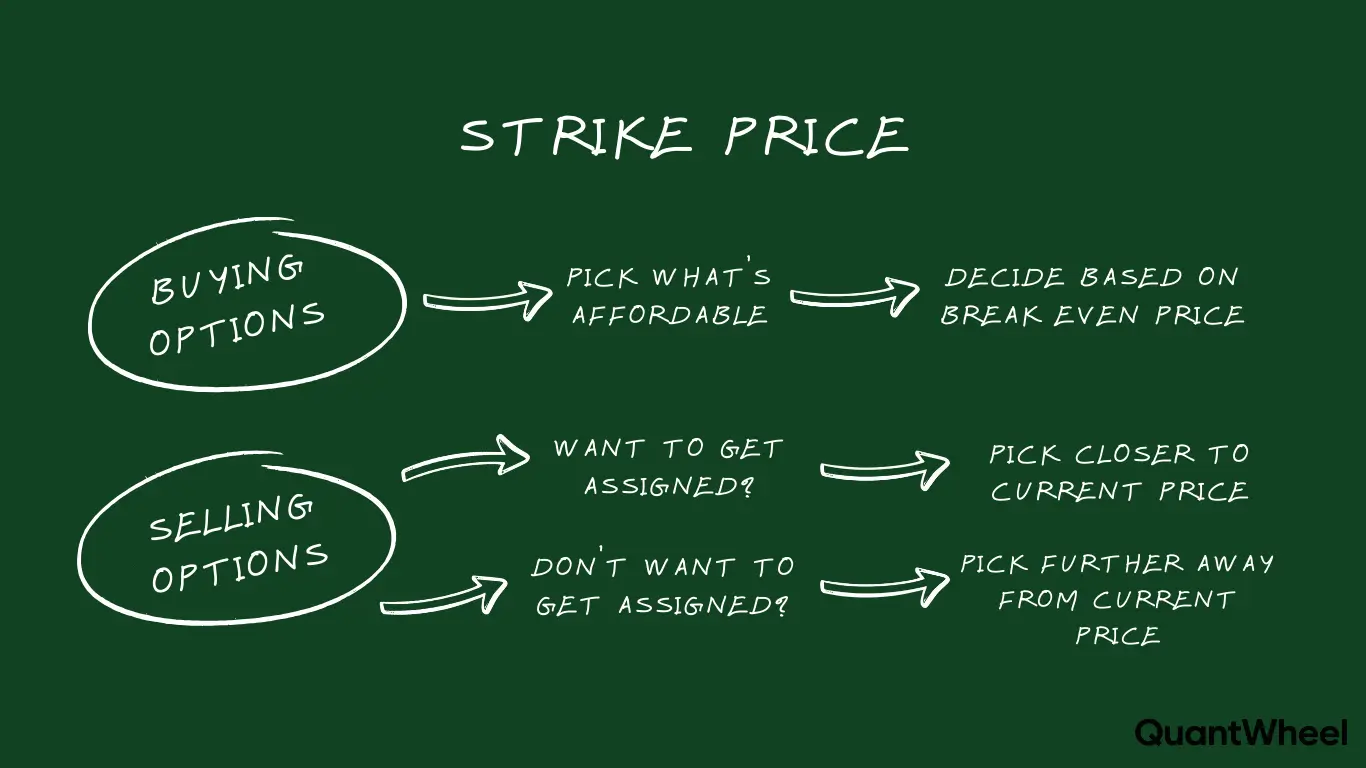
The strike price you select determines your entire options trade outcome. It's the single most important decision in options trading, yet it's often made arbitrarily.
Strike prices create different risk/reward profiles. Lower strike puts (further out-of-the-money) collect less premium but have lower assignment risk. Higher strike puts (closer to the money or in-the-money) collect more premium but increase your chances of getting assigned. The same logic applies inversely to calls.
Delta provides a shortcut for strike selection. The delta value roughly approximates the probability the option expires in-the-money. A put with a 0.30 delta has roughly a 30% chance of being in-the-money at expiration (these are estimates, not guarantees). Many wheel strategy traders target the 0.30 delta level for their cash-secured puts, balancing premium collection with assignment risk.
Strike spacing matters more than you think. On high-priced stocks, strikes might be $5 or $10 apart. Choosing between a $195 strike and a $200 strike on a stock trading at $210 might seem trivial, but that $5 difference significantly changes your premium collected and assignment risk. Always calculate the premium as a percentage of the capital at risk, not just the dollar amount.
Real example from my trading: When NVDA traded at $480, I looked at the 30-day options chain for cash-secured puts. The $460 strike (delta 0.28) offered $8.50 in premium. The $470 strike (delta 0.38) offered $12.20. That extra $3.70 seemed attractive until I realized it came with 10 percentage points higher assignment probability. For my risk tolerance, the $460 strike made more sense even though it paid less premium.
Strike selection connects directly to your strategy. Aggressive traders selling puts at the money collect maximum premium but expect frequent assignments. Conservative traders sell strikes 10-15% out of the money, collect smaller premiums, but rarely get assigned. There's no universally "right" answer - it depends on your goals, account size, and whether you actually want to own the underlying stock.
Expiration Dates: Time Is Money
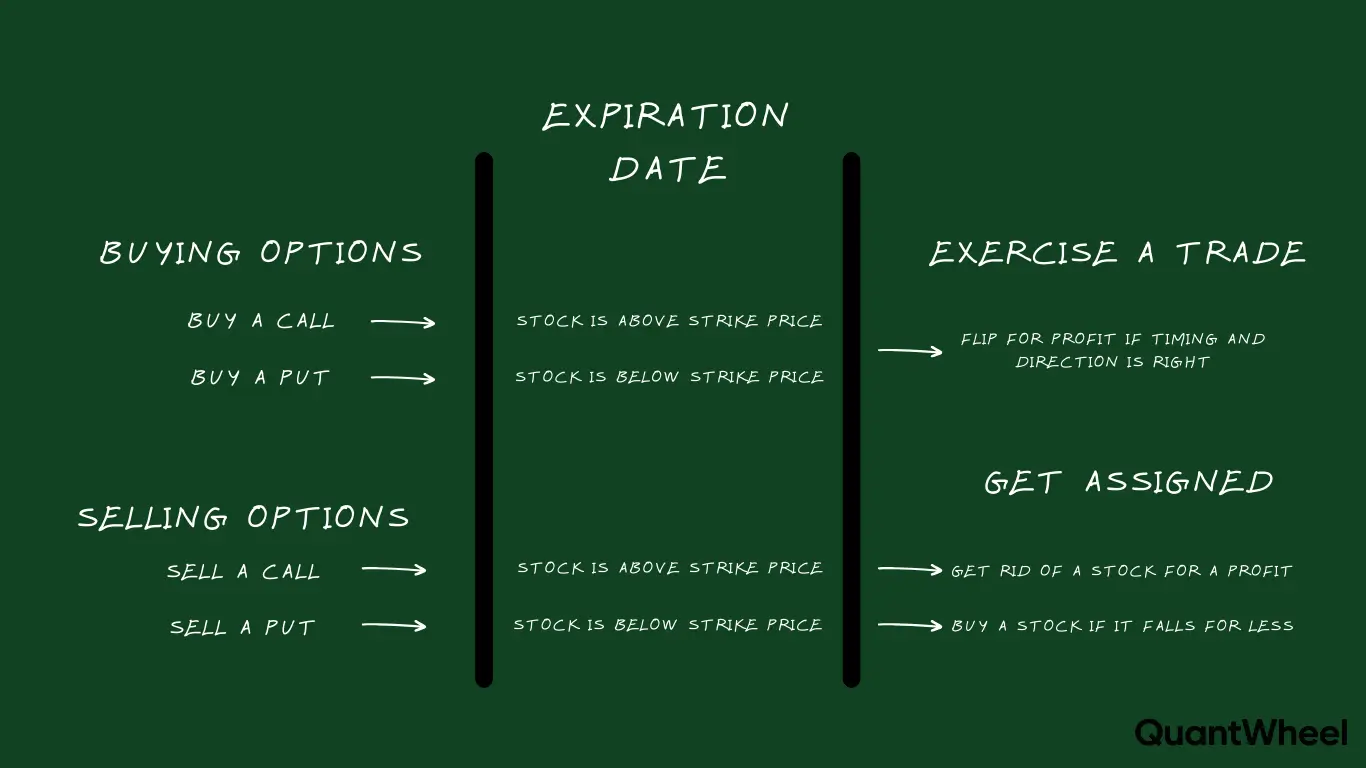
Every option has an expiration date when the contract either gets exercised or expires worthless. This timing decision shapes your entire trade structure.
Options lose value every single day. This time decay (called theta) accelerates as expiration approaches. An option with 60 days until expiration loses value slowly. The same option with 7 days left loses value rapidly. This decay works against option buyers but favors option sellers like wheel strategy traders.
Weekly vs monthly expirations serve different purposes. Weekly options (expiring every Friday) offer faster premium collection and quicker position turnover. Monthly options (expiring the third Friday of each month) offer more premium per contract but tie up your capital longer. I typically prefer 30-45 day expirations for wheel strategy trades, as they hit the sweet spot where theta decay accelerates but I'm not checking positions daily.
Days to expiration (DTE) affects your strike selection. With 7 DTE, even out-of-the-money options can move in-the-money quickly. With 60 DTE, you have more time for the stock to move around while theta decay works in your favor. Your risk tolerance and trading style should guide your DTE selection.
The options chain shows multiple expiration dates. You'll see weekly, monthly, quarterly, and even LEAP options (expirations over a year out) for popular stocks. Each expiration date has its own complete options chain with different strike prices, premiums, and Greeks. Don't get overwhelmed - most active traders focus on 1-3 standard timeframes that match their strategy.
Earnings dates complicate expiration selection. If a stock reports earnings in 15 days, options expiring in 7 days avoid the earnings volatility, while options expiring in 21 days include it. This timing difference dramatically affects implied volatility and premium collected. I personally avoid holding short-dated options through earnings unless I'm specifically seeking that volatility.
Volume and Open Interest: Liquidity Matters
You can find options with attractive premiums that look perfect on paper, but if nobody's trading them, you're stuck.
Volume tells you what happened today. If you see 500 contracts traded today, that indicates active interest in this specific strike and expiration. If you see 2 contracts traded, you're looking at an illiquid option where placing and exiting orders becomes problematic.
Open interest tells you what exists overall. This number shows total contracts currently open. An option with 5,000 open interest has 5,000 contracts held by buyers with corresponding sellers on the other side. High open interest (typically 100+) indicates an established, liquid market. Low open interest (under 25) suggests difficulty entering and exiting at fair prices.
These metrics don't always align. You might see high open interest but low volume, meaning the option traded actively in the past but not today. Or you might see high volume but low open interest, indicating new interest in a previously ignored strike. Generally, I prefer both metrics showing strong numbers.
Practical minimums for trading: I avoid options with open interest below 50 unless I'm trading very small position sizes. For larger positions (10+ contracts), I want open interest above 1,000. Volume should typically exceed at least 10-20% of open interest on an active trading day.
Liquidity directly impacts your profitability. In liquid options, bid/ask spreads stay tight, and orders fill quickly at fair prices. In illiquid options, spreads widen dramatically, and you might sit with unfilled orders while the stock moves against you. The premium saved from choosing a slightly better strike becomes meaningless if you pay an extra $0.30 in spread costs.
For wheel strategy specifically, I've learned that avoiding illiquid options matters more than optimizing every last penny of premium. Taking $0.85 on a liquid option beats chasing $0.95 on an illiquid one where the spread costs you $0.20 to enter and $0.20 to exit.
The Greeks: Delta, Theta, Gamma, Vega Explained
The Greeks intimidate new traders, but they're just measurements that predict how your option behaves. Understanding them transforms you from guessing to knowing.
Delta measures directional risk. A delta of 0.30 means if the stock moves up $1, your option gains approximately $0.30 in value (for calls) or loses $0.30 (for puts). Delta ranges from 0 to 1.00 for calls, and 0 to -1.00 for puts. Higher absolute delta means more sensitivity to stock price movement. For cash-secured puts, I typically target 0.25-0.35 delta, offering decent premium without excessive assignment risk.
Theta measures time decay. This Greek shows how much value your option loses each day, all else equal. A theta of -0.12 means your option loses $0.12 in value ($12 per contract) daily. Theta always works against option buyers and favors option sellers. This is why wheel strategy works - you're on the side collecting theta decay rather than fighting it.
Gamma measures acceleration. It shows how fast your delta changes as the stock price moves. High gamma means delta changes rapidly - your position's directional risk accelerates quickly. Options near expiration with strikes close to the current stock price have the highest gamma, making them particularly risky for unexpected moves.
Vega measures volatility sensitivity. This Greek shows how much your option's value changes when implied volatility moves 1%. A vega of 0.15 means if IV increases 1%, your option gains $0.15 in value (for buyers) or loses $0.15 (for sellers). High vega options are more sensitive to volatility changes. Wheel strategy traders prefer selling high-vega options during volatility spikes, collecting premium that later decays as volatility normalizes.
How I use Greeks in practice: When selling a cash-secured put, I check delta (am I comfortable with this assignment risk?), theta (how much am I collecting from time decay daily?), and vega (is IV elevated enough to justify the trade?). I rarely stress over gamma for positions held longer than a few days. The Greeks aren't predictions - they're estimates assuming everything else stays constant, which never actually happens. But they provide valuable guidance for position selection and risk management.
Putting It All Together: Reading a Real Options Chain
Let's walk through a real example using a stock trading at $150.
You open the options chain and select the expiration date 35 days out. The chain displays strike prices from $130 to $170 in $2.50 increments. You're interested in selling a cash-secured put (the first step in the wheel strategy).
Step 1: Identify appropriate strikes. Since the stock trades at $150, you look at strikes at or below this level. The at-the-money $150 strike shows the highest volume. Strikes at $147.50, $145, and $142.50 are out-of-the-money.
Step 2: Check the bid price. This is what you'll collect. The $145 strike shows a bid of $2.10 and ask of $2.25. You'll collect approximately $210 per contract if filled near the bid.
Step 3: Verify liquidity. Volume shows 245 contracts traded today. Open interest is 1,823. These numbers indicate a liquid, actively traded option where you can enter and exit easily.
Step 4: Review the Greeks. Delta is 0.32 (roughly 32% probability of being in-the-money at expiration). Theta is -0.06 (collecting $6 per day in time decay). Vega is 0.14 (moderate volatility sensitivity). These metrics suggest a balanced risk/reward trade.
Step 5: Calculate your risk. Selling this put obligates you to buy 100 shares at $145 if assigned. Your capital requirement is $14,500 (or less if using margin). Your premium collected is $210, representing a 1.45% return over 35 days (roughly 15% annualized).
Step 6: Compare alternative strikes. The $142.50 strike (delta 0.25) offers $1.60 premium - lower assignment risk but less premium. The $147.50 strike (delta 0.40) offers $2.75 - higher premium but more assignment risk. Based on your risk tolerance, you choose which trade makes sense.
This systematic approach takes 2-3 minutes once you know what to look for. When I started, analyzing one options chain took 20 minutes. Now it's automatic because I focus only on the columns that matter for my strategy.
Common Options Chain Mistakes to Avoid
Every trader makes these mistakes when learning to read options chains. Here's how to avoid them.
Mistake 1: Focusing only on the "Last" price. The last traded price might be hours old and totally irrelevant to current market conditions. Always check bid/ask prices instead. I've seen traders get excited about $5 options that "last traded" at $5, only to find the current ask is $6.50.
Mistake 2: Ignoring the bid/ask spread. Wide spreads eat your profits before you even start. A $0.50 spread on a $2 option costs you 25% in transaction costs. That's impossible to overcome. Always factor spread costs into your expected returns.
Mistake 3: Chasing premium without checking liquidity. A far out-of-the-money put might show an attractive bid price, but with 5 open interest, you'll never fill the order at that price. And if you do, you'll struggle to exit when needed.
Mistake 4: Selecting strikes randomly. Picking the $145 strike "because it feels right" instead of using delta, risk/reward analysis, and your actual strategy goals leads to inconsistent results. Systematic strike selection based on your plan works better than intuition.
Mistake 5: Not understanding in-the-money vs out-of-the-money. Beginners sometimes sell in-the-money puts thinking they're getting "extra" premium, not realizing they're almost guaranteed assignment. Know where your strikes sit relative to the current stock price.
Mistake 6: Trading options expiring too soon. Options expiring in 1-3 days look tempting because they move fast, but gamma risk and rapid theta decay create unpredictable outcomes. Unless you're specifically day trading options, stick with at least 7+ DTE.
For wheel strategy traders specifically, the biggest mistake I see is not checking whether you actually want to own the underlying stock. You're selling a put, which means potential assignment. If you'd hate owning this stock at this price, don't sell the put - regardless of how attractive the premium looks.
How QuantWheel Simplifies Options Chain Analysis
After analyzing thousands of options chains manually, I realized that finding the right options for wheel strategy trades shouldn't require 90 minutes of work. This is exactly why I built QuantWheel specifically for wheel traders.
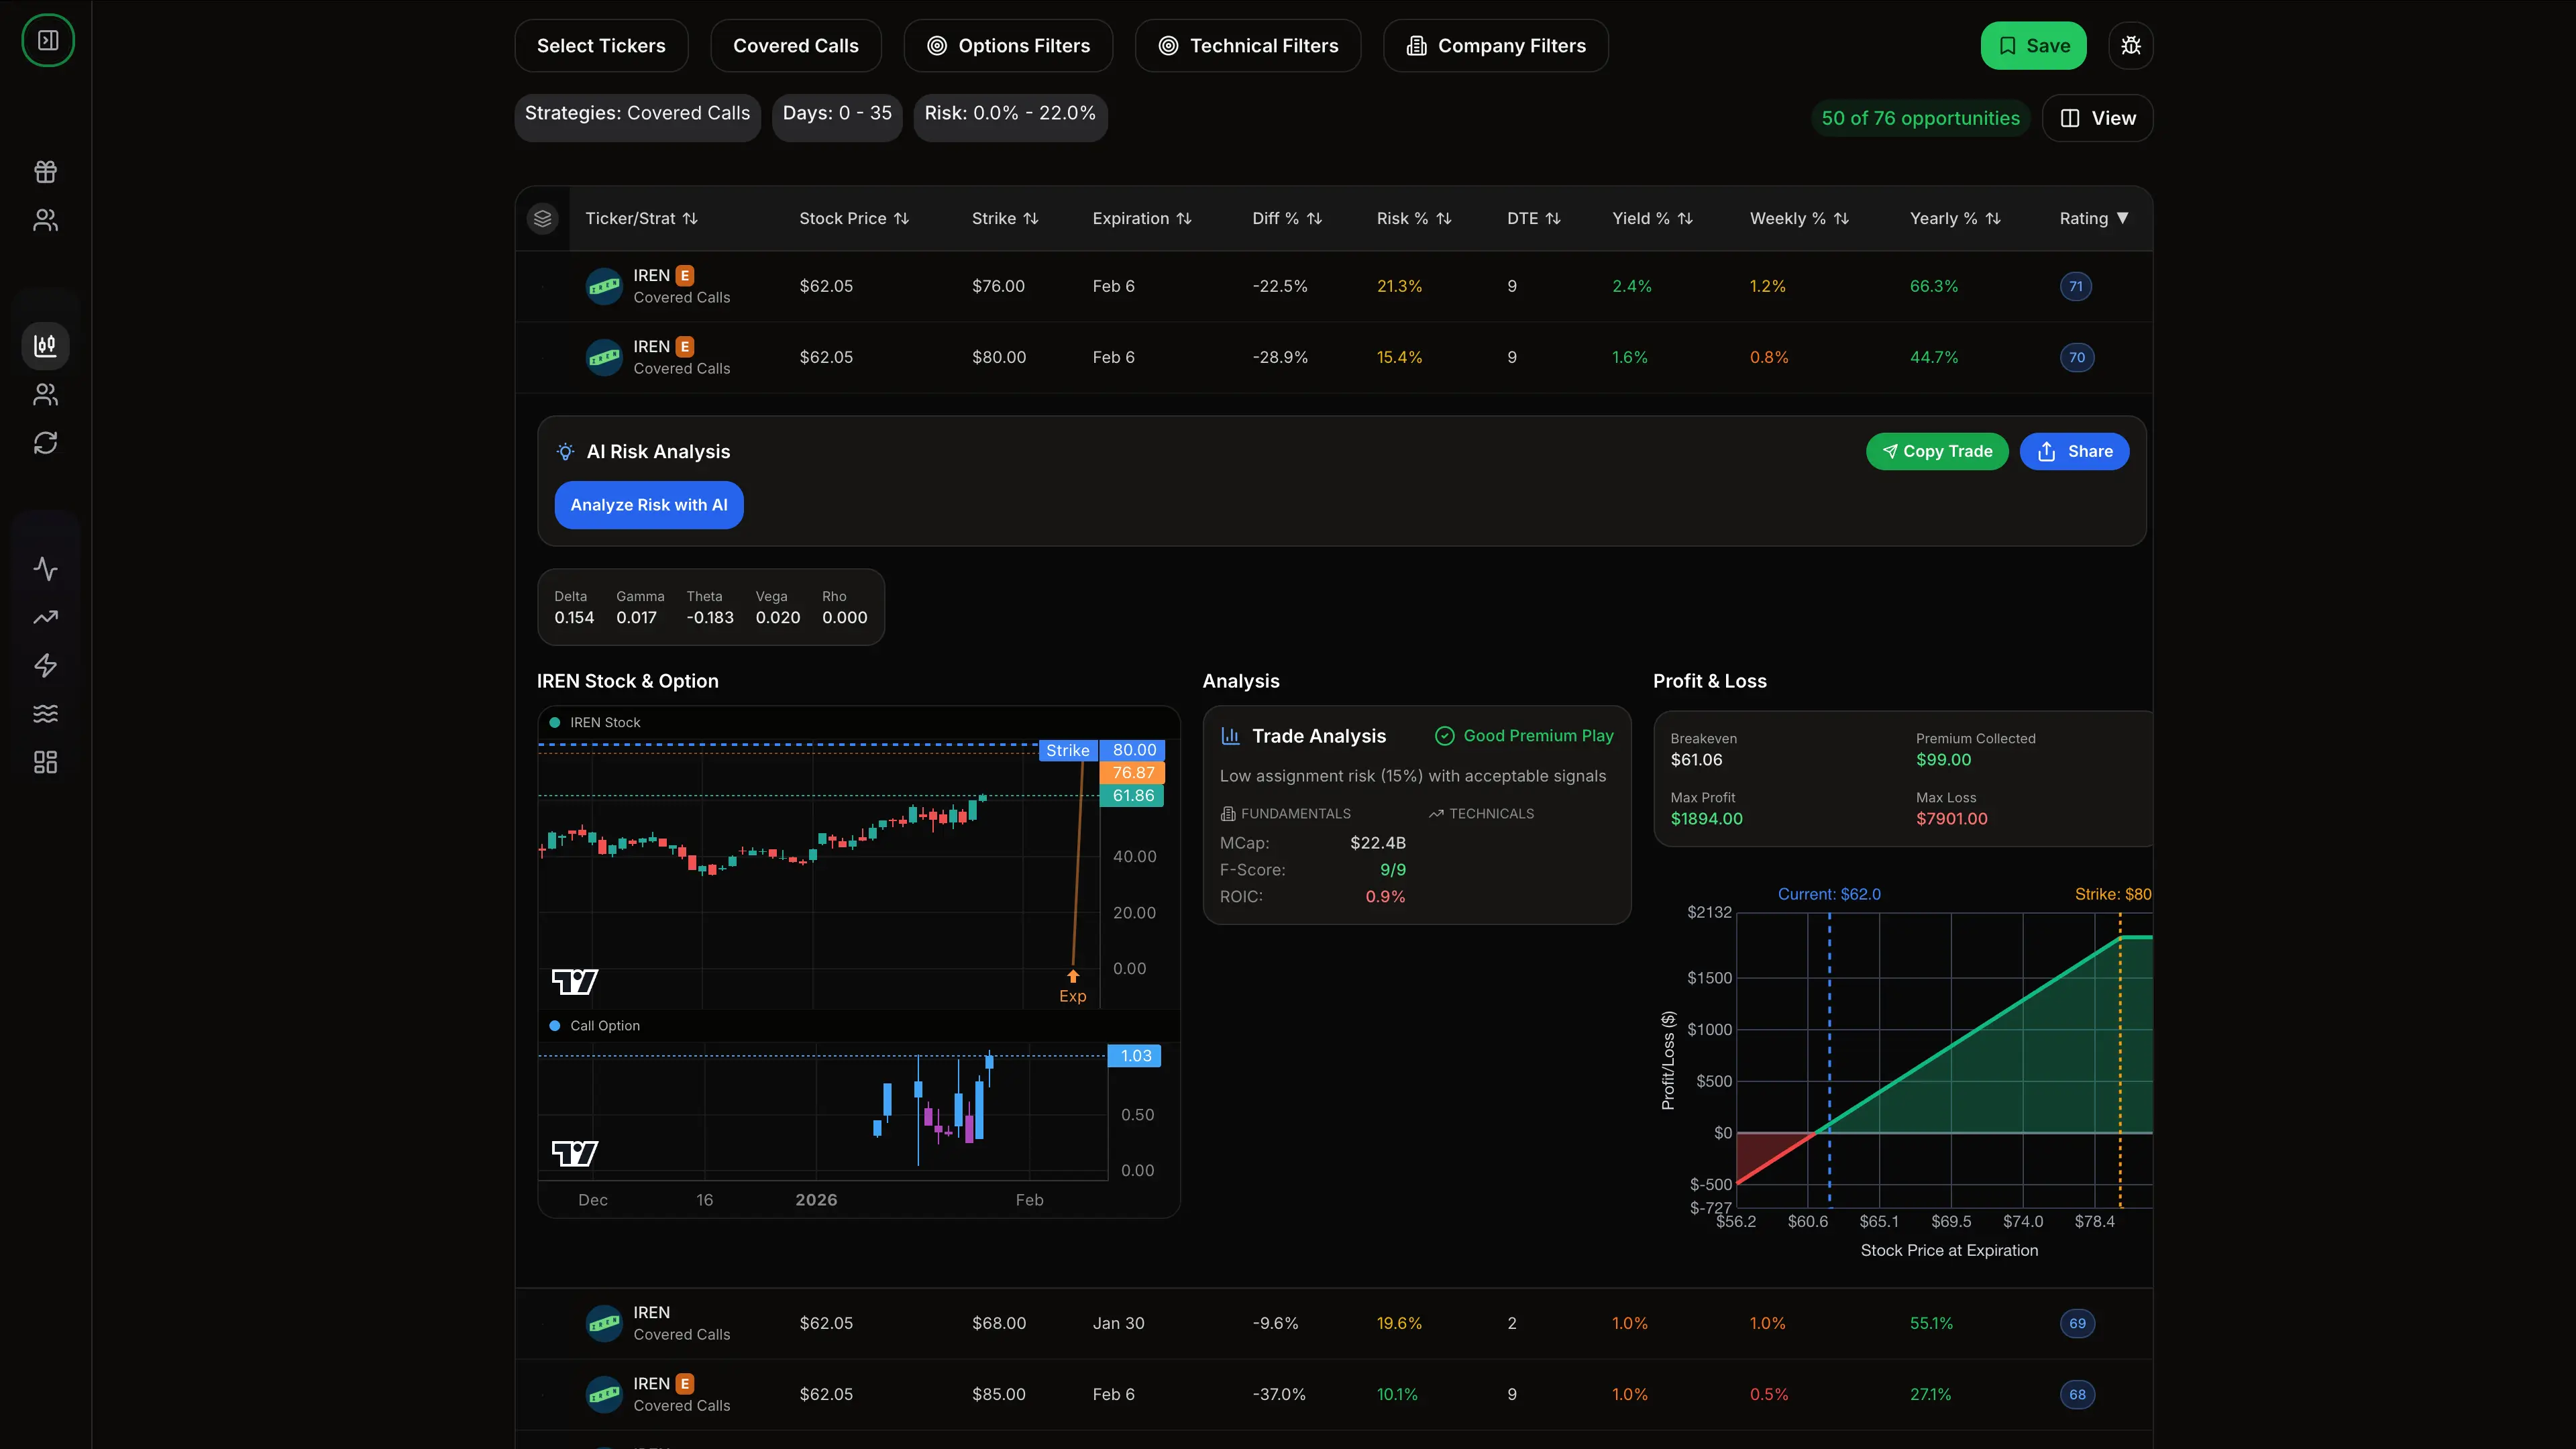
Traditional options chains show you everything, forcing you to filter through hundreds of irrelevant contracts. QuantWheel's screener cuts through this noise. It screens 570,000+ contracts across the entire market in under 5 minutes, filtering specifically for wheel strategy criteria - target delta ranges, minimum open interest, acceptable bid/ask spreads, and yield calculations.
The platform automatically highlights which strikes make sense for your strategy based on the current stock price and your risk parameters. Instead of manually comparing delta values across dozens of strikes, the screener shows you the optimal range immediately. When you get assigned, the cost basis tracking automatically adjusts your real breakeven price - something your broker doesn't show correctly.
The Roll Assistant analyzes every possible roll option when you need to extend a position, calculating the return for each strike and expiration combination. What used to take 45 minutes of manual comparison now takes 30 seconds. The system shows you which rolls optimize for maximum return, minimum time commitment, or lowest risk - depending on your preference.
For traders managing 10+ wheel positions simultaneously, the Wheel Native Journal tracks your full cycles automatically. It knows when you sold the put, when you got assigned, what premium you collected on the covered calls, and your total return when you exit. This cycle tracking would be a nightmare in spreadsheets but happens automatically in QuantWheel.
Risk Disclosure
Options trading involves substantial risk and is not suitable for all investors. Past performance does not guarantee future results. This content is for educational purposes only and should not be considered investment advice. Always do your own research and consider consulting with a financial advisor before making investment decisions.
The examples used in this article are for educational purposes only and are not recommendations to buy or sell any security. All investment decisions should be based on your own analysis and risk tolerance.