
In this article I'll go through how options greeks work in practice, one by one. It's a longer read but it's enough for you to get familiar with each greek.
Author: David Romic - retail options trader and active member in the options trading communities on Reddit (u/thedavidromic). I share wheel strategy setups, trade management, and lessons learned from real positions.
How Options Greeks Work in Practice — Quick and simple framework
Here is everything you need to know about options Greeks in practice, explained simply enough that a 14-year-old could follow along.
Options Greeks are four numbers that tell you how your option trade will behave:
- Delta (Δ): How much money you make or lose when the stock moves $1. If you sell a put with a delta of 0.25, you lose about $25 per contract for every $1 the stock drops. Delta also roughly tells you the chance the option expires in-the-money. A 0.25 delta means roughly a 25% chance of assignment.
- Theta (Θ): How much money the option loses every single day just from time passing. If theta is -$5, the option loses $5 in value each day. When you sell options, this is your daily paycheck. You want theta working for you.
- Vega (ν): How much the option price changes when the market's fear level (implied volatility) moves. Higher fear = more expensive options. If you sell when fear is high and it drops, you win faster.
- Gamma (Γ): How quickly delta changes. Near expiration, gamma gets big, which means small stock moves cause large swings in your position value. This is why the last week before expiration feels chaotic.
Simple Example: You sell a cash-secured put on a $100 stock. You pick the $90 strike with 30 days to expiration and collect $2.00 in premium ($200 per contract).
Your Greeks might look like: Delta = 0.25, Theta = -$4.50, Vega = 0.12, Gamma = 0.03.
This means: you have roughly a 75% chance of keeping the full $200 premium.
Each day that passes, the option loses about $4.50 in value (money flowing to you). If the stock's implied volatility drops 5%, you gain another $60. And delta won't move too wildly because gamma is small at this point.
That is how Greeks work in practice — they are the dashboard that tells you what is happening with your trade at any given moment.
Delta in Practice: More Than Just a Number
Delta is the Greek you will go by most frequently. Technically, delta measures how much an option's price changes for every $1 move in the underlying stock. But in practice, delta serves as a rough probability gauge and a strike selection tool.
Using Delta for Strike Selection
When selling cash-secured puts for the wheel strategy, most experienced traders target the 0.20 to 0.30 delta range. Here is why this range works in practice.
A 0.30 delta put means there is approximately a 30% probability the option finishes in-the-money at expiration. That gives you roughly a 70% chance of keeping your full premium without being assigned. A 0.20 delta put drops that assignment probability to about 20%, giving you 80% odds of keeping the premium — but you collect less money because the strike is further from the current stock price.
The trade-off is straightforward: lower delta means less premium but higher probability of profit. Higher delta means more premium but a greater chance of assignment.
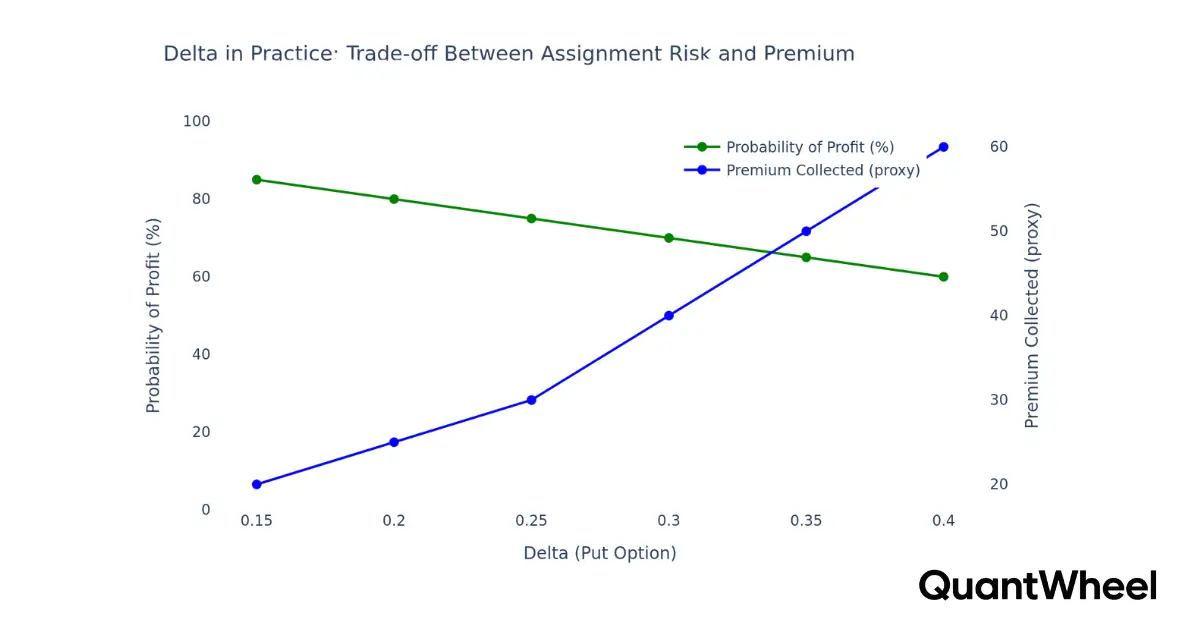
There is no universally correct delta — it depends on whether you actually want to own the stock (in which case a higher delta like 0.35–0.40 makes sense) or whether you primarily want premium income (where 0.15–0.25 might be more appropriate).
Something you won't find elsewhere is that picking these strikes can be optimized based on GEX, future and current stock events and some technical analysis. Knowing when to go more aggressive and when to take a breather is the best skill you can develop as an options trader. Optimizing this process is done with time and experience and by creating a systematic approach to your trading. Create a system inside QuantWheel→
Delta as a Portfolio Exposure Gauge
Beyond individual trades, delta helps you understand your overall portfolio exposure. If you have five cash-secured puts with a combined delta of -1.50, your portfolio behaves roughly like being short 150 shares of stock in terms of directional exposure. If the entire market drops 1%, your positions will lose value as if you held 150 shares of downside exposure.
This portfolio-level delta view is something many individual traders overlook. You might feel like you have five separate, uncorrelated positions, but if they are all on tech stocks and all have similar deltas, you actually have concentrated directional risk. Monitoring total portfolio delta — even roughly — helps you avoid becoming accidentally overleveraged during a market pullback.
How Delta Changes in Real Time
Delta is not static. It shifts every time the stock price moves, every day that passes, and every time implied volatility changes. This is where gamma comes into play (we will cover that later), but it is important to understand from a practical standpoint that the 0.25 delta put you sold on Monday might be a 0.15 delta or a 0.40 delta by Wednesday, depending on what the stock does.
In practice, this means your initial strike selection based on delta is a starting point, not a permanent characterization of your trade. The position needs monitoring, and understanding how delta evolves helps you anticipate when to intervene — whether that means rolling, closing early, or taking assignment.
Theta in Practice: Your Daily Paycheck (With a Catch)
Theta is the Greek that premium sellers think about most, and for good reason — it represents the daily erosion of an option's time value. When you sell an option, theta is working in your favor. Every day that passes, the option becomes worth less, and that value transfer goes from the option buyer to you.
The Non-Linear Nature of Theta Decay
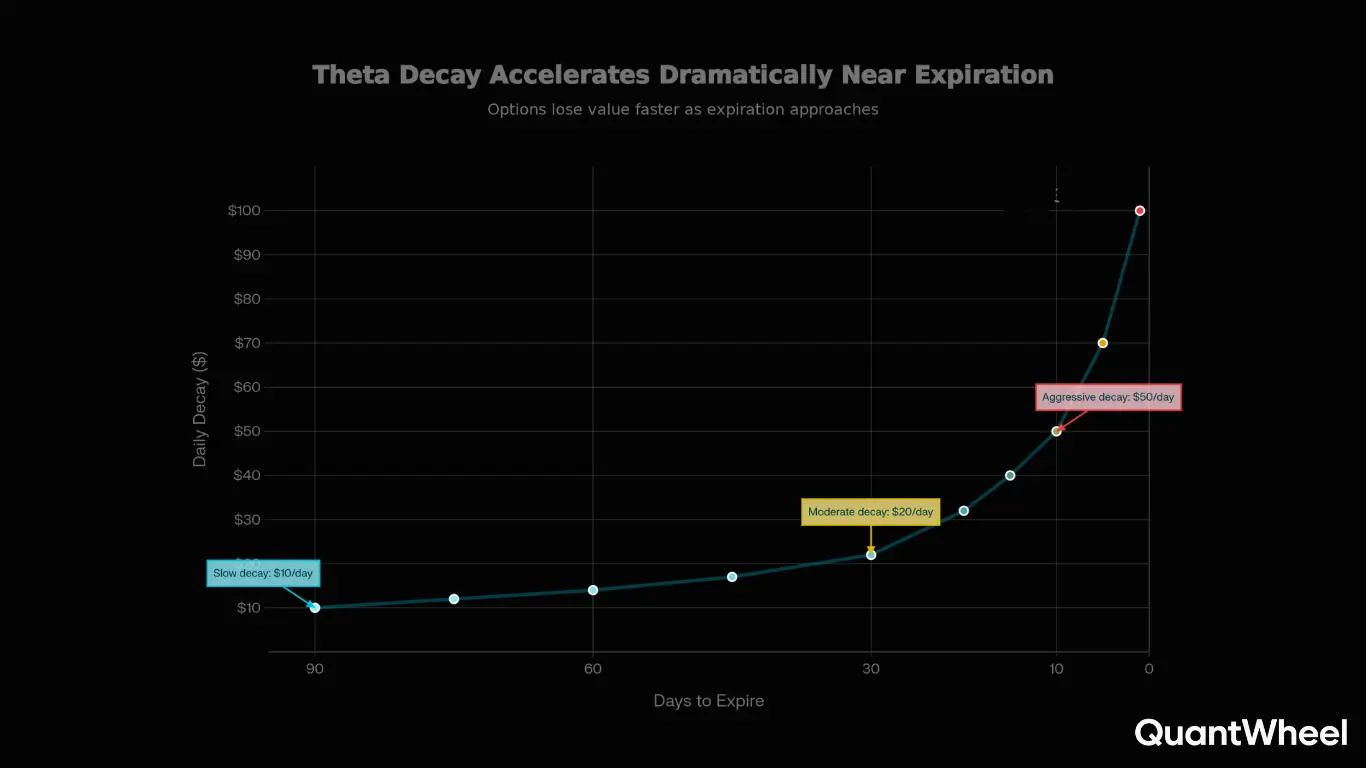
The most important practical insight about theta is that it is not linear. Options do not lose the same amount of value each day. Theta decay follows a curve that accelerates as expiration approaches.
Here is what that actually looks like with a real example.
Consider a $100 stock where you sell a put at the $95 strike:
At 60 days to expiration (DTE), the option might be worth $3.00 and lose about $2 per day in time value. At 30 DTE, the same option (if the stock hasn't moved) might be worth $1.80 and lose $4 per day. At 10 DTE, it could be worth $0.50 and losing $7–$8 per day. At 3 DTE, it might be $0.10 and losing its remaining value rapidly.
This is why many experienced premium sellers target the 30–45 DTE window for selling options. You get into the steepest part of the decay curve without being right at expiration where gamma risk becomes elevated. Selling at 45 DTE and closing at 50–65% profit often captures the most efficient portion of the theta curve.
The 50% Profit Target in Practice
A widely followed practice among theta-focused traders is to close positions at 50% of maximum profit when there are still 21 or more DTE remaining. The reasoning is mathematical: you capture the first 50% of the premium relatively quickly (because of accelerating decay), and the remaining 50% requires you to hold through increasing gamma risk near expiration.
For example, if you sell a put for $2.00, you target closing it when you can buy it back for $1.00 or less. If that happens with 25 days still left to expiration, you take the profit, free up the capital, and potentially sell a new put — compounding your returns without sitting through the riskier final days.
In practice, this means theta is not just a passive income stream. It is also a trade management tool. Knowing your daily theta lets you estimate how long it will take to reach your profit target, and comparing that against the remaining DTE helps you decide whether to hold, close, or roll.
When Theta Works Against You
Theta benefits sellers, but it is not a free lunch. If the stock drops sharply, you can be losing far more from delta movement than you are gaining from theta decay. A position with $5 theta per day does you no good if the stock drops $10 and your delta losses are $250.
In practice, theta is your edge over time, across many trades. On any individual trade, it can be overwhelmed by a large stock move. This is why position sizing, diversification, and having a plan for managing losers matter just as much as understanding the Greeks themselves.
Vega in Practice: Why Volatility Timing Matters
Vega measures how much an option's price changes for each 1% change in implied volatility (IV). If an option has a vega of 0.15, it means the option price increases $0.15 if IV rises 1% and decreases $0.15 if IV falls 1%. For premium sellers, vega represents both an opportunity and a risk.
Selling High IV: The Practical Edge
The most actionable use of vega for wheel strategy traders is timing entries based on implied volatility levels. When IV is elevated — meaning the market is pricing in higher expected movement — option premiums are richer. Selling a cash-secured put during a period of high IV means you collect more premium for the same strike and expiration.
Let's look at a practical example.
Suppose a stock normally has an IV of around 30%, but after an earnings scare or market selloff, its IV spikes to 50%. A 30-delta put that normally costs $1.50 might now cost $2.80. If you sell during the spike and IV subsequently drops back to normal levels, you benefit from two tailwinds: theta decay and IV contraction (vega working in your favor).
This is why many experienced traders use IV rank or IV percentile when selecting which stocks to wheel. IV rank tells you where current IV sits relative to the stock's historical IV range over the past year. An IV rank above 50 means current volatility is in the upper half of its recent range, which generally means you are getting paid above-average premiums.
The Vega Trap: When High IV Is a Warning
Higher IV exists for a reason — the market expects larger moves. Selling a high-IV option means you collect more premium, but the underlying stock is also more likely to make a significant move. In practice, this means you need to distinguish between situations where IV is elevated due to temporary fear (which is an opportunity) versus situations where IV is elevated because the stock genuinely faces a catalyst that could move it sharply (which is a risk).
Earnings announcements are the classic example. IV spikes before earnings because nobody knows which direction the stock will move. After the announcement, IV collapses — this is called IV crush. Some traders specifically sell options before earnings to capture this vega contraction. But the risk is that the stock moves more than the premium you collected, leaving you with a losing trade despite IV crush working in your favor.
In practice, many wheel traders avoid selling options right before earnings unless they are comfortable owning the stock at a significantly lower price. The vega opportunity is real, but so is the binary event risk.
Vega and Duration: A Practical Relationship
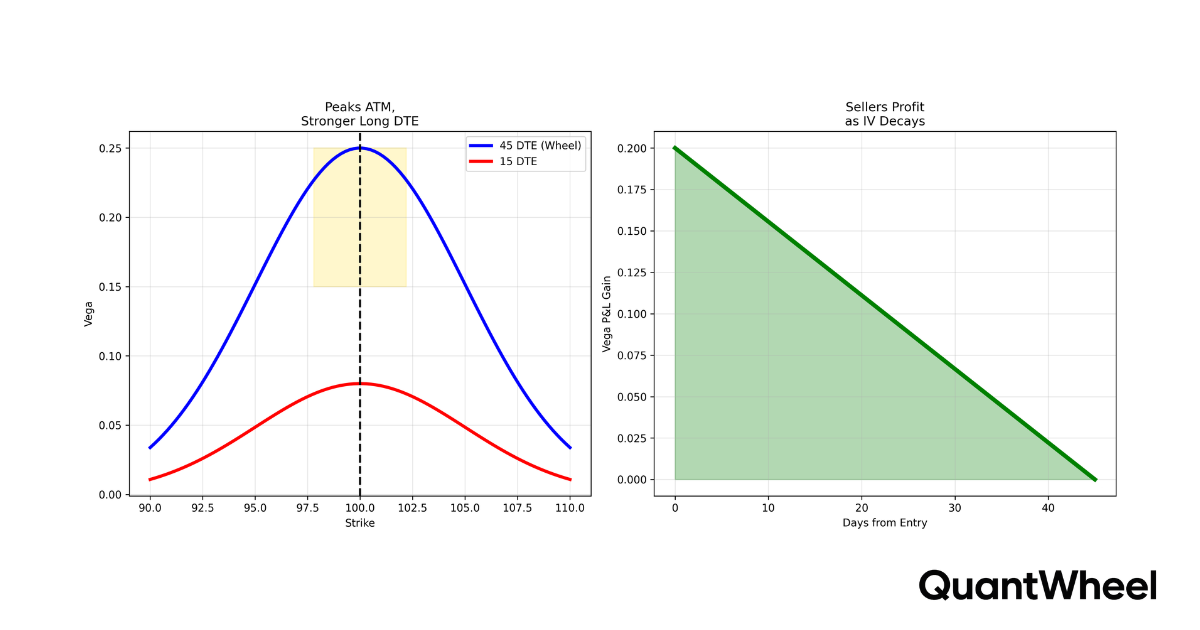
Longer-dated options have higher vega than shorter-dated options. A 60 DTE option might have a vega of 0.18 while a 15 DTE option has a vega of 0.08. This means longer-dated options are more sensitive to changes in implied volatility.
In practice, this creates an interesting dynamic for premium sellers. If you sell a 45 DTE option during high IV and IV contracts quickly, the high vega means you profit faster from the IV drop. But it also means if IV rises further after you sell, the higher vega amplifies your paper loss.
This is one reason why the 30–45 DTE sweet spot works well for premium sellers: you get meaningful vega exposure to benefit from IV contraction, meaningful theta decay to earn daily income, and enough time to manage the position if things go wrong.
How to Use Vega in Your Daily Process
In practice, you do not need to calculate vega manually. What you need is a systematic way to identify when IV is elevated and act on it.
Here is a practical workflow:
First, check IV rank or IV percentile for stocks on your watchlist. Focus on stocks where IV rank is above 50, meaning premiums are richer than usual.
Second, compare the premium you would receive today versus what you typically get — if it is meaningfully higher, that is vega working in your favor.
Third, ask yourself whether the elevated IV is due to a specific event (earnings, FDA decision, etc.) or general market fear. Event-driven IV spikes carry binary risk. Broad market fear often dissipates gradually, which is more favorable for premium sellers.
After managing multiple positions, tracking which ones you entered during high-IV periods versus low-IV periods reveals a pattern: high-IV entries tend to be more profitable. This is not a guaranteed relationship, but it is a meaningful statistical edge.
Gamma in Practice: The Greek That Bites Near Expiration
Gamma measures how fast delta changes for each $1 move in the stock price. If gamma is 0.05, it means delta changes by 0.05 for each $1 the stock moves. This might sound small, but in practice, gamma is the Greek responsible for the most dramatic position swings — particularly near expiration.
Why Gamma Accelerates Near Expiration
The practical reality of gamma is that it is low and manageable for most of the option's life, then spikes sharply in the final 7–10 days before expiration. This is because as expiration approaches, small stock moves increasingly determine whether the option finishes in-the-money or out-of-the-money.
Here is a concrete example.
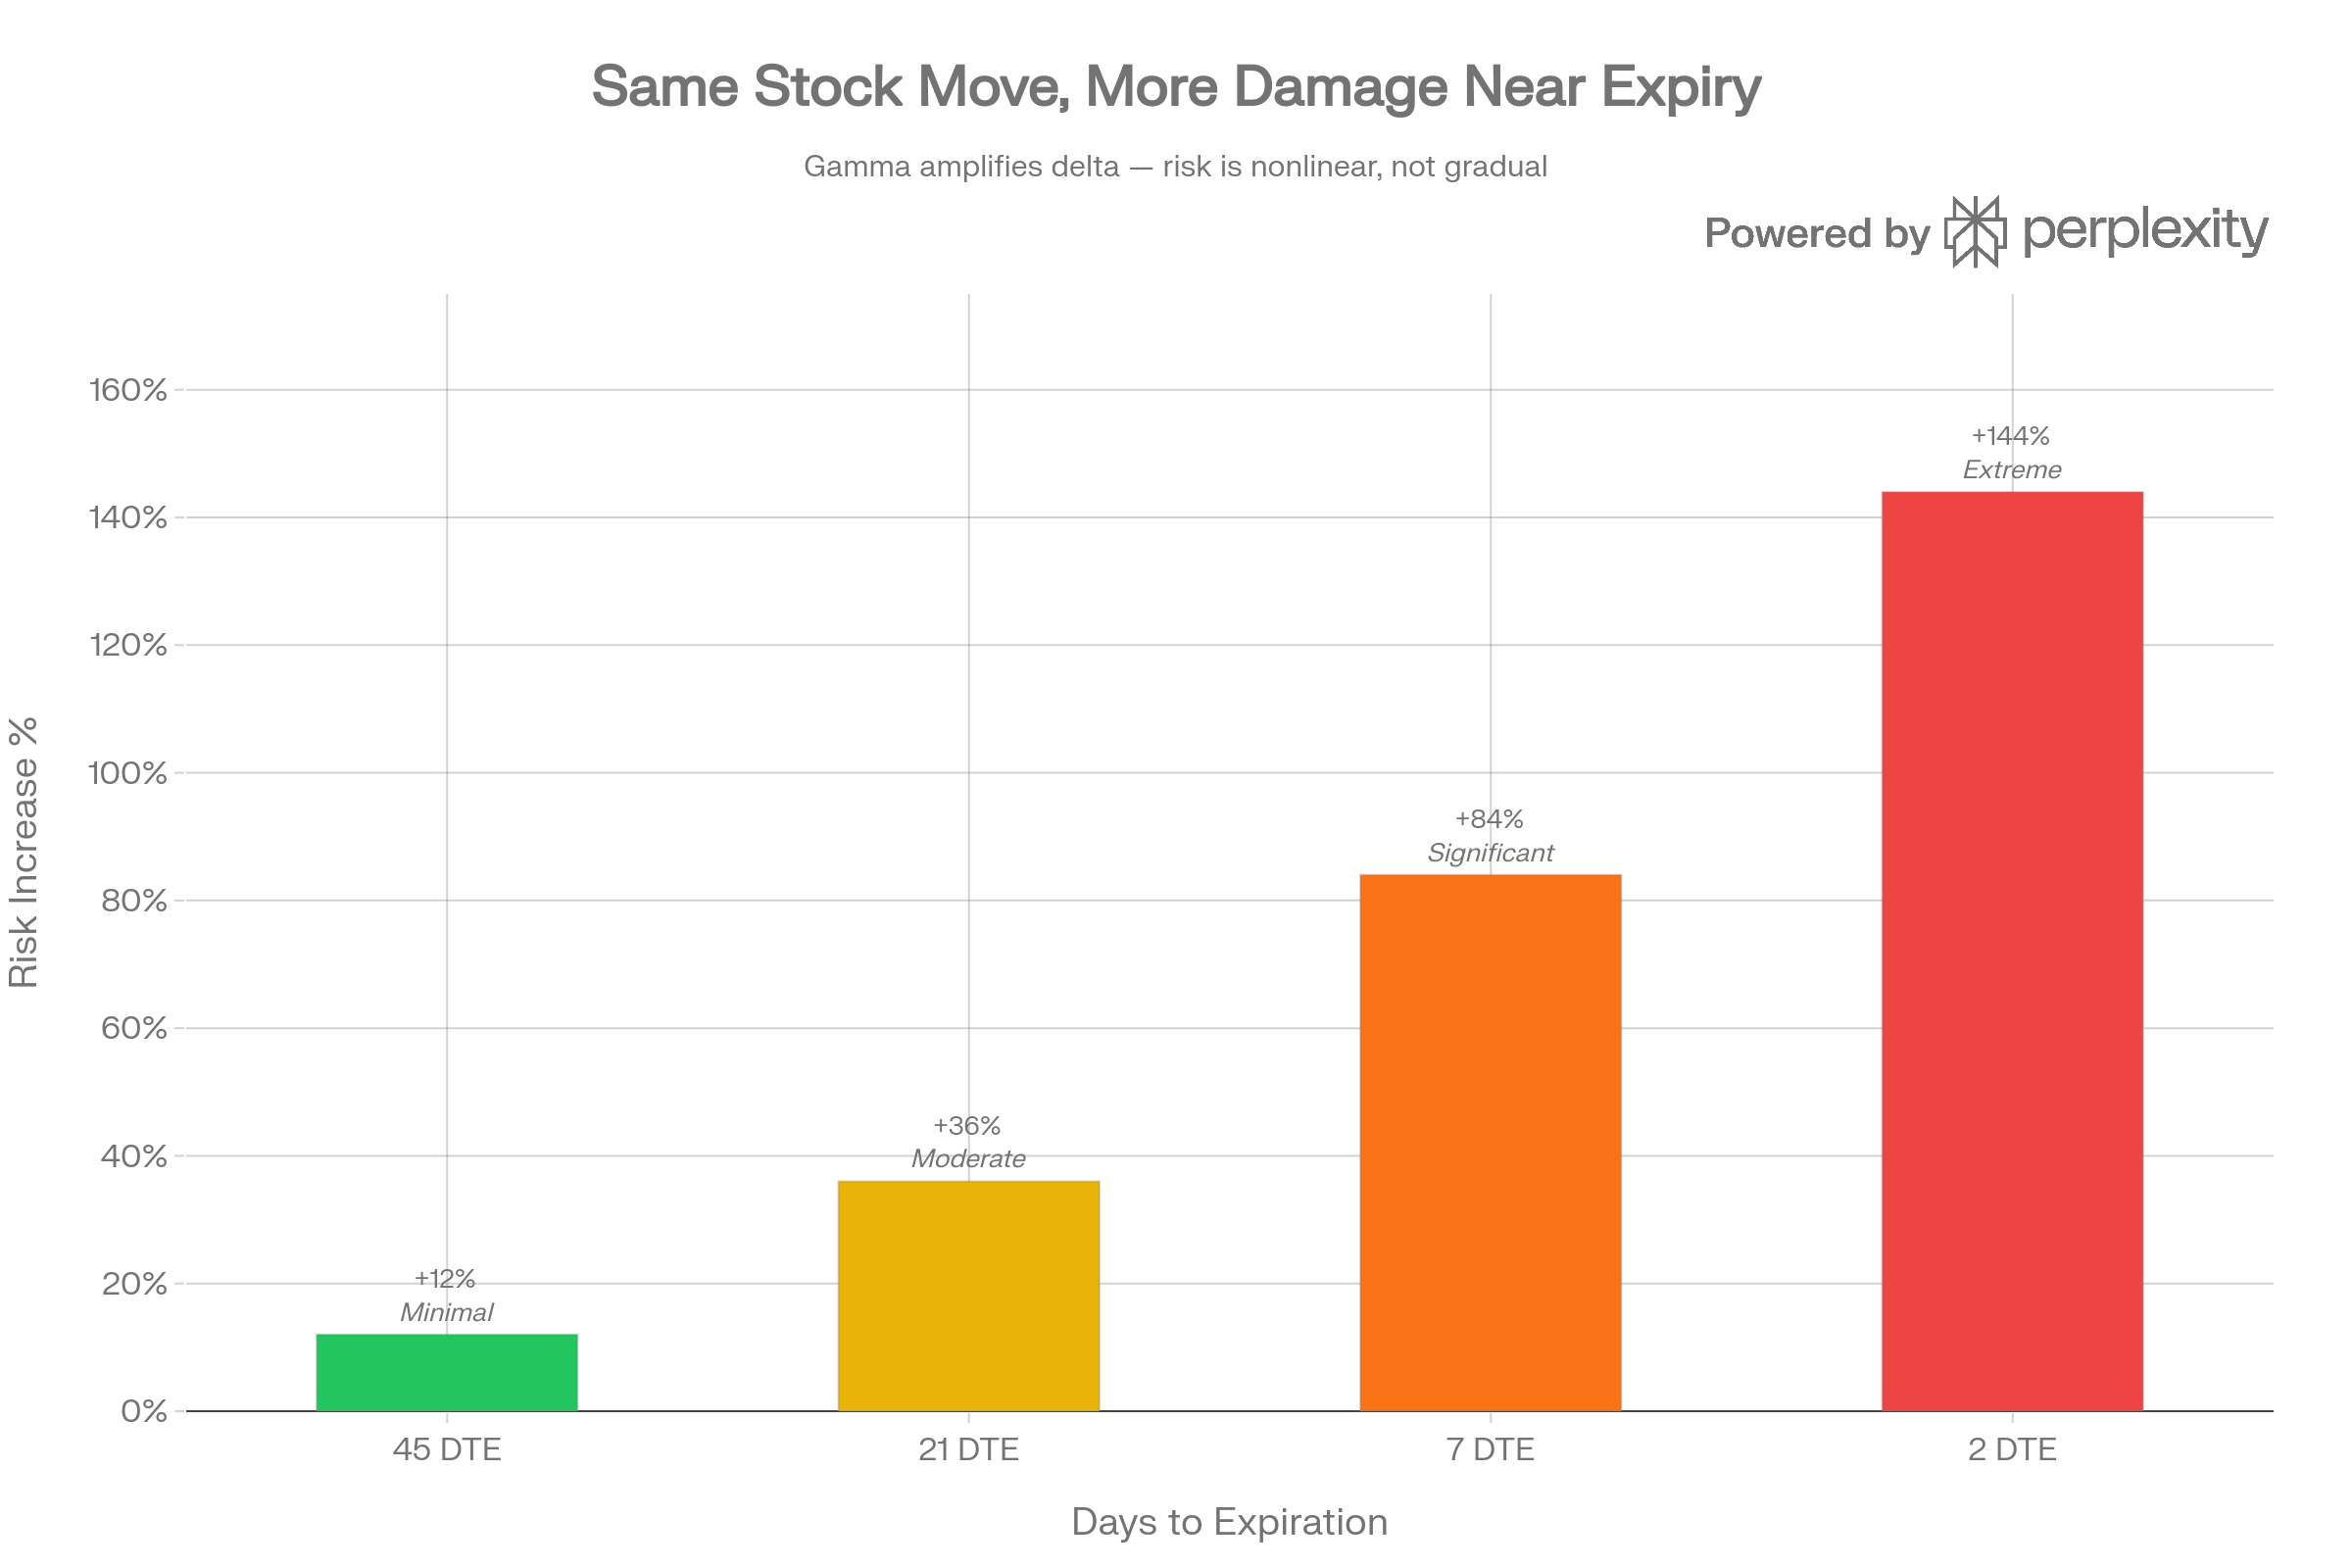
You sold a $50 strike put with 30 DTE when the stock was at $55. At that point, delta was 0.15 and gamma was 0.02. The stock could move $2 in either direction and your delta would barely change — your position was stable and predictable.
Now fast-forward to 3 DTE with the stock at $51. Delta might be 0.40 and gamma could be 0.15. If the stock drops just $1 to $50, delta jumps to 0.55. Another $1 drop to $49 pushes delta to 0.70. Within a $2 move, your position went from somewhat directional to heavily directional. The P&L swings during these final days can be jarring if you are not expecting them.
The Practical Impact: Why Many Traders Close Early
This gamma acceleration is the primary reason many experienced premium sellers close positions before expiration rather than holding to the last day. Closing at 50–65% profit with 10–20 DTE remaining lets you capture most of the theta decay while avoiding the period where gamma makes your position unpredictable.
Think of it this way: holding through the last week to collect the final 20–30% of premium exposes you to the highest gamma risk of the entire trade. The math often favors closing early and redeploying that capital into a new trade where gamma is low and theta decay is efficient.
Gamma and Pin Risk
Another practical gamma consideration is pin risk — what happens when the stock is very close to your strike price near expiration. If you sold the $50 put and the stock is at $50.10 on expiration day, gamma is extremely high. A tiny move below $50 flips the option from out-of-the-money to in-the-money, resulting in assignment.
Some traders monitor gamma as an explicit signal. When gamma on a position rises above a certain threshold (some use 0.10 as a guideline), they consider that a flag to close the position or roll it to a later expiration. This replaces the high-gamma, short-DTE trade with a low-gamma, longer-DTE trade — essentially resetting the risk profile.
Gamma for the Wheel Trader
For wheel strategy traders specifically, gamma has a nuanced role. If you are truly willing to own the stock at your strike price (which is the philosophical foundation of the wheel), then gamma risk near expiration is less threatening — you accept assignment as part of the plan. But even wheel traders benefit from understanding gamma because it affects your cost basis.
If gamma causes your put to go deep in-the-money during the final days, you might be assigned on a stock that is now trading well below your strike. While your collected premium reduces your cost basis, the unrealized loss can be larger than you anticipated. Understanding gamma helps you recognize when a defensive roll might be worthwhile versus when taking assignment is the better move.
How the Greeks Interact: The Practical Reality
In textbooks, each Greek gets its own clean chapter. In practice, they work simultaneously and often in conflicting directions. Understanding these interactions is what separates traders who understand theory from traders who use Greeks effectively.
Theta vs. Delta: The Daily Battle
Every day you hold a short option, you are in a tug-of-war between theta (working for you) and delta (working for or against you depending on stock direction). On quiet days when the stock barely moves, theta wins — your position becomes more profitable simply from time passing. On volatile days when the stock drops, delta can overwhelm theta and push the position into a loss.
In practice, this means you should think about your theta as a "daily budget." If theta is earning you $5 per day, you can absorb a small adverse stock move. But if the stock drops $3 and your delta generates $75 in losses, theta's $5 contribution is negligible. The key insight is that theta gives you an edge over many trades and many days — but on any single day, delta is usually the dominant force.
Vega vs. Theta: The Volatility Headwind
Sometimes theta and vega work together. When IV drops while time passes, both Greeks contribute to your position becoming more profitable. This is the premium seller's dream scenario — the option loses value from time decay and from volatility contraction simultaneously.
But sometimes they conflict. If IV rises after you sell, vega increases the option's value while theta is trying to decrease it. During these periods, your position might not decay as expected — or might even increase in value despite time passing. This is frustrating but temporary. As long as you have time and the position is manageable, theta eventually dominates vega because time decay is certain while volatility changes are not.
Gamma and Vega: The Near-Expiration Problem
Near expiration, something interesting happens: gamma increases while vega decreases. Short-dated options are very sensitive to stock price moves (high gamma) but barely sensitive to IV changes (low vega). This means that in the final days, your position is almost entirely about where the stock goes relative to your strike. Volatility environment becomes largely irrelevant.
In practice, this dynamic reinforces the logic of closing positions before the final week. During the 30–45 DTE window, your position has meaningful vega (so you benefit from IV contraction), manageable gamma (so stock moves don't wildly change your delta), and accelerating theta (so time decay is working efficiently). Near expiration, you lose the vega benefit and gain gamma risk — a worse trade-off for most premium sellers.
Putting It All Together: A Practical Workflow
Now that you understand each Greek individually and how they interact, here is a practical workflow for using them in real trading.
Before Opening a Trade
Step 1 — Check IV environment. Use IV rank or IV percentile to determine if premiums are above average. You want vega working in your favor from the start.
Step 2 — Select delta for strike price. Choose your desired probability of profit and premium level. For cash-secured puts, many experienced wheel traders use the 0.20–0.30 delta range, adjusting higher when they want to own the stock and lower when they primarily want income.
Step 3 — Check theta for expected daily decay. Verify that the daily theta income justifies the capital commitment. If you are tying up $5,000 in cash to earn $3 per day in theta, that may or may not meet your return requirements.
Step 4 — Confirm gamma is manageable. At 30–45 DTE, gamma should be low. If you are selling a shorter-dated option (under 14 DTE), acknowledge that gamma risk is elevated and size accordingly.
While Managing the Trade
Monitor delta changes. If delta increases significantly (moving toward in-the-money), evaluate whether to roll, close, or hold. If it decreases (moving further out-of-the-money), you are winning — consider whether you have hit your profit target.
Track theta decay against your target. If you are targeting 50% profit and theta is accumulating daily, estimate when you will reach your goal. If the trade is ahead of schedule due to a favorable stock move or IV contraction, consider closing early.
Watch for vega events. Earnings announcements, economic data releases, or market-wide fear spikes can change IV dramatically. If an event is approaching that could spike IV, decide whether to close before or hold through.
Assess gamma as expiration approaches. As DTE decreases below 14, gamma rises. If the stock is near your strike price and gamma is high, the position becomes a coin flip. Most of the time, closing and redeploying into a new trade with better risk characteristics is the higher-EV decision.
After Closing or Expiring
Review how the Greeks played out in the actual trade. Did you enter during high IV and benefit from vega contraction? Did theta accumulate as expected? Did gamma cause any unexpected P&L swings? This post-trade review is how you improve over time.
Tracking these details across dozens of trades reveals patterns. Maybe you consistently do better on 0.20 delta trades versus 0.30 delta trades. Maybe your highest-return trades all share an IV rank above 60 at entry. These are the kinds of insights that turn Greek knowledge from theory into a measurable edge.
After managing 15 or more wheel positions simultaneously, keeping track of how each Greek influenced each trade becomes practically impossible with spreadsheets. This is the exact problem that QuantWheel's Wheel Native Journal solves — it tracks your full wheel cycle from CSP to assignment to covered call, including entry IV, daily theta accrual, and delta changes. You get the post-trade analysis without the manual tracking nightmare.
Common Mistakes When Using Greeks in Practice
Understanding the theory is one thing. Avoiding the practical pitfalls is another. Here are the mistakes that trip up real traders most often.
Mistake 1: Treating Delta as a Precise Probability
Delta approximates the probability of finishing in-the-money, but it is not exact. It is influenced by the assumption of a log-normal distribution of stock prices, which does not perfectly describe reality (stocks have fat tails — large moves happen more often than the model predicts). Use delta as a rough guideline for strike selection, not as a precise forecast.
Mistake 2: Ignoring Theta's Non-Linear Curve
Traders who sell options at 60 DTE and expect smooth, linear decay are often disappointed. In the first 20 days, very little time value erodes. The real decay kicks in around 30–45 DTE and accelerates from there. If you sell too early and expect a fast profit, you may be waiting longer than you think.
Mistake 3: Chasing the Highest Vega Premium
Selling the highest-IV option available sounds great until the stock drops 20% in a week. Elevated IV is often elevated for a reason. The practical approach is to sell options with above-average IV (IV rank above 50) on quality stocks you would not mind owning, rather than seeking the absolute highest IV regardless of the underlying company's fundamentals.
Mistake 4: Holding Through High Gamma
Refusing to close a winning position in the final days before expiration because you want the last $20 of premium is a common and expensive mistake. The gamma risk in the final 3–5 days can easily wipe out more than the remaining premium. Closing at 50–65% profit with 10+ DTE remaining and redeploying the capital is almost always the better practical approach.
Mistake 5: Not Monitoring Greeks at the Portfolio Level
Individual trade Greeks matter, but portfolio-level Greeks matter more for risk management. If you have ten cash-secured puts with a combined portfolio delta of -5.0, you are behaving like someone short 500 shares of stock. A broad market decline hits all of them simultaneously. Monitoring aggregate delta, total theta income, and sector concentration helps you avoid being caught off-guard by correlated moves.
How Greeks Apply to the Full Wheel Cycle
The wheel strategy has multiple phases, and Greeks play different roles in each.
Phase 1: Selling Cash-Secured Puts
Delta is your primary strike selection tool. Theta is your income driver. Vega determines whether premiums are rich or lean. You are using all four Greeks actively in this phase to choose which trades to enter and how much capital to allocate.
Phase 2: Managing the Put Position
Theta is accruing daily. Delta tells you if the stock is moving toward your strike. Gamma becomes important as expiration nears. Vega might save you (if IV drops) or hurt you (if IV spikes). This is the active management phase where Greeks guide your roll-or-hold decisions.
Phase 3: Assignment and Covered Call Writing
After assignment, you own the stock and begin writing covered calls. Delta now measures upside participation — a 0.30 delta covered call means you give up roughly 30% of the stock's upside potential in exchange for premium income. Theta works the same way but now in your favor on the call side. Vega again determines how much premium you collect.
What changes after assignment is that cost basis tracking becomes critical. Your real cost basis is the strike price minus all premiums collected (CSP premium and subsequent CC premiums). Brokers typically do not show this adjusted cost basis, which means you need to track it yourself or use a platform that handles it automatically.
This is where many traders lose track of their actual performance. You might be "down" on the stock based on your broker's cost basis, but "up" when you account for all the premium you have collected. QuantWheel automatically adjusts your cost basis through the entire wheel cycle — from the initial put sale through assignment through covered calls and exit — so you always know your real breakeven price.
Phase 4: Exit or Repeat
When the covered call gets assigned (stock called away), or you close the position, the wheel cycle completes. At this point, reviewing the Greeks across the entire cycle helps you learn. Did your initial delta-based strike selection lead to a desirable outcome? Did theta accumulate as projected? Did vega conditions at entry contribute to the overall profitability?
These insights, tracked systematically over dozens of wheel cycles, are what transform options Greeks from academic concepts into a genuine trading edge.
Greeks and Position Sizing: The Overlooked Connection
One area where Greeks provide enormous practical value — but which many traders overlook — is position sizing. Instead of allocating the same dollar amount to every trade, you can use Greeks to size positions based on risk.
For example, if your risk tolerance allows a maximum daily portfolio loss of $500 from delta movement, and you know that a 2% market drop is your "bad day" scenario, you can work backward from your total portfolio delta to determine how many positions you can carry simultaneously.
Here is the math: if the average stock on your watchlist is $100, a 2% drop means $2 per share. If each of your 0.25 delta puts loses $0.25 for every $1 the stock drops, a $2 move means each contract contributes roughly $50 in losses ($0.50 × 100 shares). To stay under your $500 daily loss budget, you can carry about 10 contracts — but this changes based on delta, the stock's price, and your expectations for market conditions.
This kind of risk-budgeting approach turns Greeks into a portfolio management framework, not just trade-selection metrics.
Greeks in Different Market Environments
How you weight each Greek in your decision-making should shift based on the broader market environment.
Low Volatility Markets
When VIX is below 15 and individual stock IVs are compressed, premiums are lean. Theta income per day is lower, and vega provides limited upside because IV is already low and is unlikely to drop much further. In this environment, some traders move to shorter-duration trades (14–21 DTE) to increase their annualized theta return, accepting higher gamma risk. Others widen out their delta to 0.30–0.40 to collect more premium per trade.
High Volatility Markets
When VIX spikes above 25 and fear dominates, premiums are rich. This is where vega creates the most opportunity — if you sell options during the panic and IV subsequently normalizes, you benefit enormously from IV contraction on top of theta decay. The practical challenge is that high-volatility environments are when stocks are most likely to make large adverse moves. Position sizing becomes more conservative, and delta selection often shifts lower (0.15–0.20) to give the position more room.
Choppy, Range-Bound Markets
Range-bound markets are ideal for premium sellers. Theta accumulates day after day, delta moves wash out as the stock oscillates, and IV tends to grind lower over time. In these environments, you can be more aggressive with position count and allocation because the risk of a large directional move is lower.
Recognizing which environment you are in and adjusting your Greek-based strategy accordingly is what separates mechanical premium selling from thoughtful, adaptive portfolio management.
Building a Greeks-Based Checklist for Every Trade
To make Greeks practical in your daily process, consider building a simple pre-trade checklist:
Delta: Is my strike at the desired probability of profit? Am I comfortable owning this stock at this strike price? Does my total portfolio delta remain within my risk budget after adding this trade?
Theta: Does the daily theta income justify the capital committed? Am I in the 30–45 DTE sweet spot for efficient decay? What is my expected holding period to reach a 50% profit target?
Vega: Is IV rank above 50, meaning premiums are above average? Is there a known binary event (earnings, FDA decision) within the option's duration? Am I prepared for IV to increase further after entry?
Gamma: Is gamma low enough that I will not face wild delta swings in the near term? If I am selling shorter-duration options, am I sizing smaller to account for higher gamma?
Running through this checklist takes less than a minute per trade once it becomes habit. Over time, it prevents the most common Greek-related mistakes and ensures you are entering trades with a clear understanding of the risk-reward dynamics.
Final Thoughts: From Theory to Edge
Options Greeks are not abstract mathematical constructs — they are the dashboard for your options portfolio. Delta tells you where your risk is. Theta tells you how you are earning income. Vega tells you whether conditions favor sellers. And gamma tells you when to pay extra attention.
The traders who use Greeks most effectively are not the ones who can recite the formulas. They are the ones who check delta before selecting a strike, monitor theta against their profit targets, time entries based on vega opportunities, and close positions before gamma creates unpredictable swings.
Turning that Greek awareness into a repeatable system — tracking entries, exits, and outcomes across dozens of wheel cycles — is what transforms knowledge into measurable results. If you are tracking your positions manually and struggling to see how Greeks influence your actual performance, it might be time for a tool that was built specifically for this purpose.
Risk Disclosure: Options trading involves substantial risk and is not suitable for all investors. Past performance does not guarantee future results. This content is for educational purposes only and should not be considered investment advice. Always do your own research and consider consulting with a financial advisor before making investment decisions.
The examples used in this article are for educational purposes only and are not recommendations to buy or sell any security. All investment decisions should be based on your own analysis and risk tolerance.