Options trading has a reputation for being expensive.
The tools, data feeds, and software that serious traders rely on can run hundreds of dollars per month.
A growing number of free options trading tools now offer professional-grade analysis, from gamma exposure visualization to earnings mispricing detection, all without requiring a credit card or even a login.
This guide walks you through the best free options trading tools available right now. Whether you sell cash-secured puts, run covered calls, trade the wheel strategy, or dabble in multi-leg spreads, these tools will sharpen your analysis and save you hours of manual work every week.
Author: David Romic
Best Free Options Trading Tools: Calculators, Screeners, and Strategy Builders
TLDR — If you are short on time, here is the simple version.
There are five categories of free tools for options traders that are worthy of your time and money in 2026:
- gamma exposure (GEX) calculators
- options profit calculators
- earnings mispricing screeners
- roll optimizers
- strategy explorers
Together, they cover the full lifecycle of an options trade — from finding opportunities, over modeling risk, to managing positions if they go against you.
Quick example on “how to use”: You sell a cash-secured put on a $100 stock, collecting $3.00 in premium. Before you place the trade, you use a free options calculator to confirm your max profit ($300), your breakeven ($97), and to check your Greeks.
You should also then check the GEX calculator to see at which price is the best sell a put based on call/put walls.
Then, you glance at the mispriced earnings tool to confirm earnings are not next week with an overpriced implied move.
And if two weeks later the stock drops and your put goes in the money, you pull up the optimal roll calculator to find the best strike and expiration to roll to — instantly, instead of comparing 30 combinations by hand.
Free GEX Calculator: Reading Market-Maker Positioning Like a Pro
Gamma exposure — or GEX — has become one of the most talked-about concepts in options trading over the past few years, and for good reason.
Understanding where market makers have concentrated gamma helps you anticipate how hedging flows might push a stock’s price around.
What GEX Actually Tells You
When market makers sell options to retail traders, they take on gamma risk. To stay delta-neutral, they need to hedge by buying or selling shares of the underlying stock as price moves. The direction and intensity of this hedging depends on whether net gamma exposure is positive or negative at a given strike.
When GEX is positive at a strike level, market makers tend to sell into rallies and buy into dips. This creates a stabilizing, mean-reverting effect — price tends to get “pinned” near high positive GEX strikes.
When GEX is negative, the opposite happens: market makers buy into rallies and sell into dips, amplifying moves and increasing volatility.
Why a GEX Calculator Matters for Your Trading
For options sellers, this information is gold.
If you are selling a cash-secured put at a certain strike, knowing that there is a massive positive GEX level just below your strike gives you additional confidence that the stock has a “cushion” of buying pressure from market-maker hedging.
on the other hand, if your strike sits in negative GEX territory with no support below, you know the downside risk is higher than the numbers alone suggest.
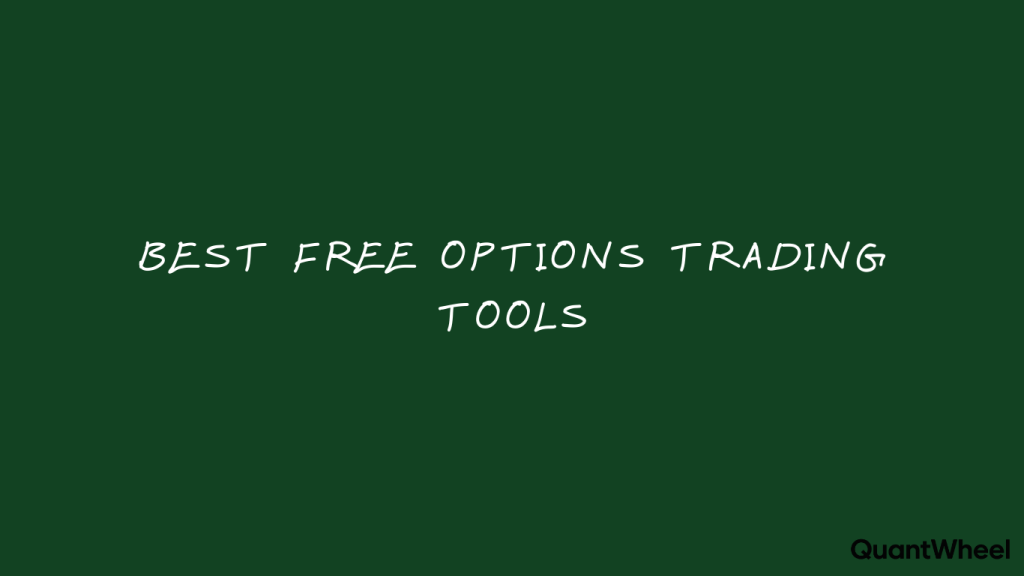
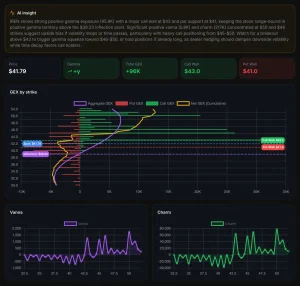
QuantWheel’s free GEX calculator lets you visualize gamma exposure by strike price for any optionable stock. You can identify call walls (strikes with heavy call-side gamma that may cap upside), put walls (strikes with heavy put-side gamma that may support downside), and the gamma flip point where net exposure changes from positive to negative.
How to Use the Free GEX Calculator in Practice
The most practical workflow is to check GEX levels before placing a new trade. Say you are considering selling a put at the $95 strike on a stock trading at $100. Pull up the GEX chart and look for where the largest positive GEX bars are clustered. If there is a significant positive GEX concentration at $96 or $95, market-maker hedging flows are likely to provide some support at those levels. If the largest positive GEX is way up at $105 and everything below $100 is negative, you know the stock could accelerate to the downside through your strike without much hedging support.
This does not guarantee anything — GEX levels shift as options are opened and closed — but it adds a valuable layer of context that most retail traders ignore completely.
In our analysis of 6 months of weekly expirations tracked on QuantWheel, stocks with a dominant positive GEX strike within 2% of the current price closed within ±1.5% of that strike on expiration at Friday 61% of the time — compared to 38% for stocks with low or negative GEX concentration.
Other Free GEX Calculators Worth Knowing
Besides QuantWheel’s free tool, a handful of other platforms offer some form of GEX visualization. Most require paid subscription for real-time data.
QuantWheel’s version is free for a limited number of real-time data scans, requiring no account creation, and providing a clean interface that shows the key levels without overwhelming you with unnecessary complexity.
Free Options Calculator: Modeling Trades Before You Risk Real Money
An options calculator is the most fundamental tool in any trader’s kit. Before you place a single trade, you need to know your max profit, max loss, breakeven, and how the Greeks will affect your position over time. The good news is that you absolutely do not need to pay for this.
What a Good Free Options Calculator Should Do
At minimum, a free options calculator should let you input the underlying price, strike price, days to expiration, implied volatility, and option type (call or put), and then output the theoretical option price along with the key Greeks: delta, gamma, theta, vega, and rho.
Better calculators go further. They let you model entire positions — not just single legs — so you can see the combined profit-and-loss profile of a covered call, a vertical spread, or an iron condor. They show you how the position’s value changes as the underlying moves, time passes, and volatility shifts.
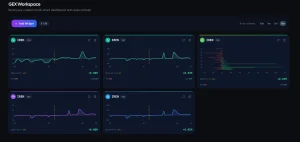
QuantWheel’s Free Options Calculator
QuantWheel’s options calculator handles all of the above and is available with no login required. You can quickly plug in your parameters and see the theoretical value of any option, along with a full breakdown of Greeks. This is especially useful for wheel strategy traders who want to compare premiums across different strikes and expirations before deciding where to sell.
Practical Use Cases for Options Sellers
If you are selling cash-secured puts, the options calculator helps you answer the question that matters most: how much premium am I collecting relative to the risk I am taking? By comparing the premium at a 30-delta strike versus a 20-delta strike, for example, you can quantify exactly how much extra income the higher-delta strike offers and whether it is worth the additional assignment risk.
For covered call sellers, the calculator helps you evaluate rolling scenarios. If your stock has moved up and your covered call is in the money, you can model what happens if you buy back the current call and sell a new one at a higher strike or later expiration. The Greeks tell you how much theta you will collect per day, how much delta exposure you are carrying, and how sensitive the position is to volatility changes.
Free Options Calculator Alternatives
Several platforms offer free options calculators, including CBOE’s options calculator at optionseducation.org and Barchart’s calculator.
The difference? When compared to CBOE’s options calculator and Barchart’s calculator – QuantWheel version is made for option sellers and designed with the wheel strategy workflow in mind — it prioritizes the metrics that matter most to income-focused traders, such as premium yield, probability of profit, and annualized return.
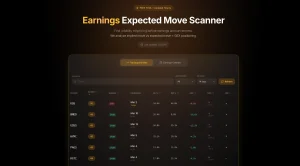
Free Mispriced Earnings Tool: Finding Edge Before Announcements
Earnings season is a double-edged sword for options traders. Implied volatility spikes before announcements as the market prices in uncertainty, and then crashes afterward in what traders call “IV crush.” The question is: is the market pricing in the right amount of movement?
How Earnings Mispricing Works
Every stock has a history of how much it actually moves after earnings. Maybe a stock typically moves 5% after earnings, but right now the options market is pricing in an 8% expected move. That 3-percentage-point gap is a potential mispricing — and it matters a lot for options sellers.
If you sell options before earnings and the implied move is significantly larger than the stock’s historical average, the premium you collect is “overpriced” relative to what is likely to happen. Of course, past earnings moves do not guarantee future ones, and any single earnings event can produce an outlier. But systematically selling options when implied moves are stretched above historical norms is one of the most well-documented edges in options trading.
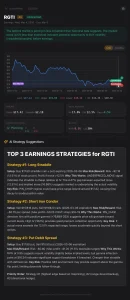
QuantWheel’s Free Mispriced Earnings Tool
QuantWheel’s mispriced earnings screener solves a core problem: instead of selling premium blindly across all earnings events, it filters the calendar down to setups where IV overpricing is historically widest.
Across the full market, implied moves average 8.22% vs. actual moves of 7.42% — only an ~11% edge (Dew-Becker et al., VU Amsterdam). That edge gets far larger in higher-IV, mid-cap stocks: POST Holdings averages a 4.7% implied vs. 3.7% actual (27% premium), while PEG shows 4.5% implied vs. 1.8% actual — a 150% overpricing gap.
QuantWheel finds exactly these setups automatically – It compares the current implied earnings move with the stock’s historical actual moves and flags stocks where there is a meaningful discrepancy.
So, instead of manually pulling up each stock, looking at the straddle price, calculating the implied move, and then cross-referencing it against a history of past earnings reactions, the tool does all of this for you.
For wheel strategy traders, this is particularly valuable during earnings season.
If you are running wheels on multiple stocks, you need to know which positions are heading into earnings with an overpriced implied move (potential opportunity to sell premium) versus an underpriced one (where assignment risk is not adequately compensated).
How to Use Mispriced Earnings Data in Your Trading
The simplest approach is to use the tool as a screening filter. Before earnings season, pull up the mispriced earnings screener and look for stocks where the implied move is meaningfully higher than the average historical move. These are candidates for selling premium — either through straddles, strangles, or iron condors for traders who use those strategies, or through cash-secured puts for wheel traders who would not mind owning the stock at a lower price.
A word of caution: just because the implied move looks “overpriced” does not mean it is risk-free. Companies do occasionally have blowout earnings (up or down) that exceed even the most aggressive implied moves. This is an edge that works over many trades, not a guaranteed win on any single trade. Always size your positions to survive the occasional outlier.
Where Else to Find Earnings Mispricing Data
Some paid platforms like Market Chameleon and OptionMetrics offer similar historical earnings analysis.
On the free side, QuantWheel’s tool is one of the few that provides this analysis with no account required. You can get a quick read on earnings mispricing with precision without logging in or paying.
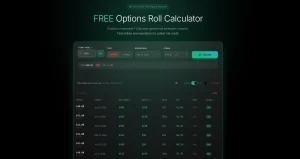
Free Optimal Roll Calculator: Managing In-the-Money Positions Without the Headache
Rolling options — closing your current position and opening a new one at a different strike, expiration, or both — is one of the most important skills for options sellers. It is also one of the most time-consuming and error-prone if you do it manually.
The Problem With Manual Roll Analysis
Here is the scenario. You sold a cash-secured put at the $100 strike, and the stock has dropped to $95. Your put is now $5 in the money. You need to decide: take assignment, or roll to a later expiration (and maybe a lower strike) to collect more credit and give the stock time to recover?
The challenge is that there are dozens of possible roll targets. You could roll to next week, two weeks out, next month, or two months out. You could keep the same strike or move it down. Each combination produces a different credit or debit, a different breakeven, and a different probability of the stock recovering above your new strike.
Comparing all these options manually — pulling up each chain, noting the bid-ask, calculating the net credit — takes 20 to 45 minutes. And by the time you finish your analysis, prices have moved.
How the Free Optimal Roll Calculator Works
QuantWheel’s optimal roll calculator eliminates this problem entirely. You input your current position — the underlying, your strike, your expiration — and the tool instantly analyzes every possible roll destination. It calculates the net credit (or debit) for each combination of strike and expiration, ranks them by return, and shows you the optimal choice.
The key metrics it evaluates include net credit received, annualized return of the new position, days to expiration, and delta of the new position. This lets you make an informed decision in seconds rather than minutes.
QuantWheel’s roll calculator evaluates up to 240 strike-and-expiration combinations in seconds instead of the equivalent 35–45 minutes of manual chain analysis.
Practical Rolling Scenarios
Let us walk through a common scenario. You sold a 45-DTE cash-secured put on a stock at the $50 strike, collecting $2.00 in premium. With 15 days to go, the stock has dropped to $48 and your put is $2 in the money. You could take assignment at $50 (real cost basis of $48 after premium) or roll the position.
You pull up the optimal roll calculator. It shows you that rolling to the $50 strike 45 days out generates $1.80 in additional credit. Rolling to the $48 strike 45 days out generates $0.90 but moves your strike closer to the money, reducing future assignment risk. Rolling to the $50 strike 30 days out generates $1.20.
The calculator ranks these by annualized return so you can compare apples to apples. Without this tool, you would have spent 30 minutes doing this math on paper or in a spreadsheet — and probably would have given up and just taken assignment.
Why This Matters for Wheel Strategy Traders
Rolling is the defense mechanism of the wheel strategy. When a stock drops below your put strike, rolling gives you the option to collect additional premium, lower your effective cost basis, and buy more time for the stock to recover. Having a free tool that makes this analysis instant and accurate is a genuine competitive advantage.
Many traders who run the wheel strategy on multiple positions simultaneously say that roll decisions are the most stressful part of their process. They end up making suboptimal choices because the analysis takes too long, or they skip rolling altogether and take unnecessary assignments. A free roll calculator removes this friction completely.
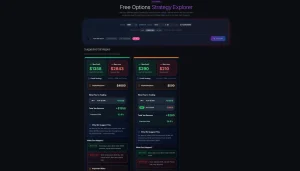
Free Strategy Explorer: Comparing Multi-Leg Options Setups Visually
Not every trade is a simple put or call. Whether you are exploring vertical spreads, iron condors, straddles, or calendar spreads, a strategy explorer lets you build and compare multi-leg options positions before risking capital.
What a Strategy Explorer Does
A strategy explorer lets you construct options positions by adding multiple legs — buying and selling calls and puts at different strikes and expirations — and then visualize the combined risk profile. You can see the profit-and-loss diagram at expiration, the position’s Greeks, the breakeven points, and how the position behaves as price and volatility change.
This is essential for traders who are moving beyond single-leg strategies and want to understand how spreads and combinations work before putting real money on the line.
QuantWheel’s Free Strategy Explorer
QuantWheel’s strategy explorer lets you build multi-leg options strategies and see the resulting payoff diagram instantly. You can experiment with different configurations — widening or narrowing your spread, adjusting strikes, changing expirations — and watch how the risk-reward profile changes in real time.
For wheel strategy traders specifically, the strategy explorer is useful for evaluating defensive adjustments. If you have an assigned stock position and want to compare selling a covered call versus selling a covered call and buying a protective put (a “collar”), the strategy explorer shows you exactly how each approach changes your risk profile.
Educational Value for Newer Traders
One of the under appreciated benefits of a free strategy explorer is its educational value. If you are learning about options for the first time, being able to visually build strategies and see how they behave is dramatically more effective than reading about them in a textbook.
You can ask questions like: what happens to my iron condor if the stock moves 10% in one direction? How does time decay affect a calendar spread differently than a vertical spread? What does a straddle’s payoff look like compared to a strangle? The visual answers to these questions make abstract concepts concrete.
Comparing Strategy Explorers
Several platforms offer strategy exploration tools, including OptionStrat and the broker platforms from Schwab (formerly TD Ameritrade) and Interactive Brokers. The advantage of QuantWheel’s version is accessibility — no account, no download, no paywall. For a quick analysis before placing a trade, that zero-friction access matters.
How to Build a Free Options Trading Toolkit in 2026
Now that we have covered the five core tool categories, let us talk about how to actually integrate them into your daily trading workflow.
Step 1: Start With Screening
Before you can trade, you need to find opportunities. Use a free options screener or the mispriced earnings tool to identify stocks with attractive premium levels, high implied volatility relative to history, or upcoming earnings with overpriced options. This replaces the old approach of manually flipping through dozens of stock charts looking for something interesting.
Step 2: Model Your Trade
Once you have identified a candidate, use the free options calculator to model the specific trade. Confirm the premium you will collect, the breakeven price, the probability of profit, and the Greeks. Compare different strikes and expirations to find the setup that matches your risk tolerance.
Step 3: Check Market Structure
Before you pull the trigger, check the GEX calculator to understand the gamma exposure landscape. Are there significant support or resistance levels created by market-maker hedging? Does the gamma environment favor your trade thesis? This 60-second check can save you from placing a trade right at a level where hedging flows are working against you.
Step 4: Manage and Roll
After you are in the trade, monitor your position. If the trade goes against you and your option moves in the money, use the optimal roll calculator to evaluate your best options. In many cases, rolling to collect additional credit is more profitable than taking assignment or closing the trade at a loss.
Step 5: Explore Alternatives
If a simple put or call is not giving you the risk profile you want, use the strategy explorer to build and compare multi-leg alternatives. Maybe a put spread offers a better risk-reward ratio than a naked put. Maybe a collar on your assigned stock gives you better downside protection than a simple covered call. The strategy explorer lets you test these ideas in seconds.
Free vs. Paid Options Trading Tools: When to Upgrade
Free tools are excellent for specific tasks — pricing, rolling, screening, visualizing. But they have limitations. Here is an honest breakdown of when free tools are enough and when you might benefit from upgrading to a paid platform.
When Free Tools Are Enough
If you are trading one to three positions at a time, managing them is straightforward. You can track your cost basis in a simple spreadsheet, check your positions once a day, and use free calculators for individual trade decisions. The free tools cover all the analytical heavy lifting.
Free tools are also perfect for learning. If you are new to options and want to understand how different strategies work before committing real capital, a free strategy explorer and options calculator give you everything you need.
Based on QuantWheel usage data, traders managing fewer than 4 simultaneous positions rarely feel the need to upgrade — free tools handle the workload just fine.
The conversion to paid most commonly happens when users cross 6 active positions, which is when manual tracking errors and missed roll opportunities start costing more than the subscription itself QuantWheel has.
When Paid Tools Become Worth It
The breakpoint usually comes around five to ten simultaneous positions. At that point, several things start happening. Tracking cost basis manually becomes error-prone, especially after assignments. You start missing roll opportunities because you cannot monitor every position constantly. Your spreadsheet becomes unwieldy and you lose confidence in your P&L calculations.
This is where a purpose-built platform like QuantWheel adds significant value. Beyond the free tools, QuantWheel’s paid platform offers a wheel-native journal that automatically tracks full wheel cycles (cash-secured put to assignment to covered call to exit), automatic cost basis adjustment when you get assigned, a real-time options screener that scans hundreds of thousands of contracts in seconds, a roll assistant that monitors your positions and suggests optimal rolls proactively, and custom alerts based on your personal rules (close at 50% profit, roll when down 20%, and so on).
The paid platform essentially automates the tedious, error-prone parts of managing a multi-position options portfolio — the stuff that free tools cannot handle because they are point-in-time calculators rather than ongoing portfolio management systems.
Best Free Options Trading Tools by Category: Quick Reference
To help you find the right tool for your specific need, here is a summary organized by what you are trying to accomplish.
For understanding market structure and support/resistance: Free GEX calculator. QuantWheel’s version provides real-time gamma exposure visualization by strike with no signup required.
For pricing options and evaluating Greeks: Free options calculator. Model any option with custom inputs for volatility, time, and price. QuantWheel’s calculator is built with premium sellers in mind.
For finding earnings trading opportunities: Free mispriced earnings tool. Compares implied earnings moves against historical actuals to flag overpriced or underpriced options. QuantWheel’s screener automates the entire comparison.
For managing in-the-money positions: Free optimal roll calculator. Instantly evaluates every possible roll combination and ranks them by return. QuantWheel’s tool eliminates the analysis paralysis that plagues rolling decisions.
For building and comparing strategies: Free strategy explorer. Construct multi-leg positions and visualize payoff diagrams. QuantWheel’s explorer works instantly with no download or account.
What to Look for in a Free Options Trading Tool
Not all free tools are created equal. Here are the characteristics that separate genuinely useful tools from gimmicky ones.
Real-Time or Near-Real-Time Data
Options prices change constantly. A tool using delayed data — or worse, end-of-day data — gives you a distorted picture. The best free tools pull current market data so your analysis reflects reality.
No Signup Required
If a “free” tool requires you to create an account, verify your email, and enter a credit card for a “free trial” that auto-converts to a paid subscription, it is not really free. The tools highlighted in this guide work immediately without any account creation.
Clean, Focused Interface
Options analysis is complex enough without a cluttered interface adding confusion. The best free tools present information clearly, prioritize the metrics that matter, and avoid overwhelming you with data you do not need.
Mobile Accessibility
More traders are checking opportunities on their phones during the day. Free tools that work well on mobile give you the flexibility to analyze trades between meetings or during your commute.
Accurate Calculations
This might seem obvious, but it matters: the math needs to be right. Options pricing models (Black-Scholes, binomial, etc.) are well-established, but implementation details can introduce errors. Tools from reputable platforms with active user bases tend to be well-tested and reliable.
Common Mistakes When Using Free Options Trading Tools
Having access to powerful tools does not automatically make you a better trader.
In practice, positions opened at an 80% theoretical probability of profit typically see realized win rates of 70–75% (tastytrade, Market Measures study across thousands of trades).
The gap exists because real-world factors like rolling decisions, early closes, and bid-ask slippage all alter the trade from its original setup.
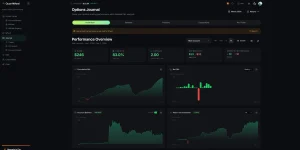
Below is a my personal track record on a smaller account for reference.
Here are the pitfalls to watch out for.
Over-Relying on Any Single Metric
A GEX chart that shows massive support does not mean a stock cannot crash. An options calculator showing 80% probability of profit does not mean you will profit 80% of the time in practice. Use tools as one input among many, not as a crystal ball.
Ignoring the Bid-Ask Spread
Free calculators often show theoretical mid-prices, but you will not trade at the mid in illiquid options. Always check the actual bid-ask spread before placing a trade. A $1.00 theoretical premium on an option with a $0.80 bid and $1.20 ask is really $0.80 of collectible premium if you are selling.
Analysis Paralysis
Having access to five different tools does not mean you need to run every analysis on every trade. Develop a streamlined workflow — screen, calculate, check GEX on borderline cases, roll when necessary — and stick to it. The goal is better decisions, not more analysis.
Skipping Risk Management
No free tool can replace a solid risk management framework. Know your max position size, your portfolio-level delta exposure, and how much you can afford to lose on any single trade. Tools help you execute better, but discipline keeps you in the game.
The Future of Free Options Trading Tools
The trend in 2026 is clear: tools that were once locked behind expensive subscriptions are becoming free. This is driven by platforms like QuantWheel that use free tools as a way to demonstrate value and attract traders to their broader ecosystem, as well as by increased competition in the options trading software space.
Looking ahead, expect to see more AI-powered analysis in free tools — natural language querying (“find me puts on tech stocks with IV rank above 50 and yield above 15%”), automated trade suggestions, and real-time portfolio analysis. QuantWheel’s QW Intelligence feature is already moving in this direction, offering AI-driven insights that connect to your broker and understand your actual positions.
For now, the five free tools covered in this guide — GEX calculator, options calculator, mispriced earnings screener, optimal roll calculator, and strategy explorer — provide a powerful analytical foundation that would have cost hundreds of dollars per month just a few years ago.
Start Trading Smarter Today
The barrier to trading options well has never been lower. With free tools that handle gamma exposure analysis, options pricing, earnings mispricing detection, roll optimization, and strategy modeling, you have everything you need to make informed, data-driven decisions without spending a dollar on software.
If you want all five tools in one place with zero friction, check out QuantWheel’s free tools suite. No signup, no credit card, no catch.
And when you are ready to take the next step — automating your position tracking, getting real-time alerts, and managing your full portfolio with broker integration — start your free trial of QuantWheel. It is built by options sellers, for options sellers.
Risk Disclosure: Options trading involves substantial risk and is not suitable for all investors. Past performance does not guarantee future results. This content is for educational purposes only and should not be considered investment advice. Always do your own research and consider consulting with a financial advisor before making investment decisions.
The examples used in this article are for educational purposes only and are not recommendations to buy or sell any security. All investment decisions should be based on your own analysis and risk tolerance.