Selling covered calls generates income from stocks you already own. But calculating your actual returns? That's where most traders get tripped up.
You collect premium upfront, your stock price moves, maybe you get assigned—and suddenly the math gets complicated. Your broker shows one number, your spreadsheet shows another, and you're not sure which one reflects your real profit.
Here's the truth: calculating covered call returns accurately matters. Not just for tracking performance, but for making smart decisions about which strikes to sell, when to roll, and whether this strategy actually beats buy-and-hold for your portfolio.
Start your free trial of QuantWheel to automate return tracking and cost basis calculations.
TLDR: Calculating Covered Call Returns (Everything You Need to Know)
The Simple Formula: Total Return = (Premium Income + Capital Gains - Capital Losses) ÷ Initial Investment × 100
Real Example: You own 100 shares of stock at $50 per share ($5,000 investment). You sell a covered call and collect $150 premium. The stock stays flat at $50 until expiration.
- Premium collected: $150
- Capital gains: $0 (stock unchanged)
- Initial investment: $5,000
- Return: ($150 + $0) ÷ $5,000 × 100 = 3% total return
If this happened over 30 days, that's approximately 36% annualized (though rarely repeatable monthly).
Important: Always use your TRUE cost basis. If you got assigned shares from a cash-secured put at $50 but collected $2 premium on that put, your real cost is $48/share—not the $50 your broker shows.
Understanding the Components of Covered Call Returns
Before calculating your total return, you need to understand the three components that determine profitability.
Component 1: Premium Income (The Guaranteed Part)
When you sell a covered call, you receive a premium immediately. This is yours to keep regardless of what happens to the stock price.
Example: Sell 1 covered call on 100 shares, collect $2.50/share = $250 premium income.
This premium is the "income" part of income investing with covered calls. It's the only guaranteed component of your return—everything else depends on stock price movement.
Component 2: Capital Gains (Or Losses)
Your shares can increase or decrease in value while the covered call is active. This unrealized gain or loss affects your total return calculation.
Three scenarios:
- Stock stays flat: No capital gains or losses to factor in
- Stock rises (below your strike): Unrealized gains increase total return
- Stock falls: Unrealized losses reduce total return (but premium provides cushion)
The key: Your capital gains are capped at your strike price if you get assigned. If you sold a $55 call and the stock reaches $60, you only benefit up to $55.
Component 3: Opportunity Cost (The Hidden Factor)
Many traders forget about opportunity cost. If you sell a covered call at $55 and the stock runs to $65, you "lost" $10/share in potential gains.
This isn't a realized loss on your tax return, but it's a real economic cost. You gave up upside potential in exchange for that premium. Whether this trade-off makes sense depends on your goals and the premium collected.
The Complete Covered Call Return Formula
Here's the formula that accounts for everything:
Total Return % = [(Premium Income + Capital Gains - Capital Losses) ÷ Cost Basis] × 100
Or broken down step-by-step:
- Calculate premium income (price per contract × 100 shares)
- Calculate capital gains/losses (current stock price - your cost basis) × 100 shares
- Add premium + capital gains, subtract capital losses
- Divide by your total cost basis (what you paid for 100 shares)
- Multiply by 100 to convert to percentage
Worked Example: Simple Scenario
- You own 100 shares of XYZ at $50/share (cost basis: $5,000)
- You sell 1 covered call at $55 strike for $2.00/share premium ($200 total)
- Stock stays at $50 at expiration (no capital gains/losses)
- Call expires worthless
Calculation:
- Premium income: $200
- Capital gains: $0
- Total profit: $200
- Total return: $200 ÷ $5,000 × 100 = 4% return
Worked Example: Stock Rises (Below Strike)
- Same setup: 100 shares at $50, sell $55 call for $200 premium
- Stock rises to $53 at expiration
- Call expires worthless (stock below $55 strike)
Calculation:
- Premium income: $200
- Capital gains: ($53 - $50) × 100 shares = $300 unrealized gain
- Total return: ($200 + $300) ÷ $5,000 × 100 = 10% return
You keep both the premium and the stock appreciation. This is the ideal scenario for covered call sellers.
Worked Example: Assignment (Stock Above Strike)
- Same setup: 100 shares at $50, sell $55 call for $200 premium
- Stock rises to $58 at expiration
- Your shares get assigned (called away) at $55
Calculation:
- Premium income: $200
- Capital gains: ($55 - $50) × 100 shares = $500 (capped at strike)
- Total return: ($200 + $500) ÷ $5,000 × 100 = 14% return
Even though the stock reached $58, you only benefit up to your $55 strike price. You "missed" $3/share in additional gains, but you still made a solid 14% return.
Worked Example: Stock Declines
- Same setup: 100 shares at $50, sell $55 call for $200 premium
- Stock falls to $47 at expiration
- Call expires worthless
Calculation:
- Premium income: $200
- Capital loss: ($47 - $50) × 100 shares = -$300 unrealized loss
- Net return: ($200 - $300) ÷ $5,000 × 100 = -2% return
The $200 premium cushioned your loss. Without the covered call, you'd be down $300 (-6% return). The premium reduced your loss by 4 percentage points.
Calculating Annualized Returns: Why Time Matters
A 5% return sounds different when it takes 30 days versus 365 days. Annualizing helps you compare covered call returns to other investments fairly.
The Annualization Formula
Annualized Return = (1 + Total Return)^(365 ÷ Days Held) - 1
Or the simpler approximation: Approximate Annualized Return = (Total Return ÷ Days Held) × 365
Example: 3% Monthly Returns
If you make 3% in 30 days:
- Simple annualization: (3% ÷ 30) × 365 = 36.5% annualized
- Precise calculation: (1.03)^(365÷30) - 1 = 42.6% annualized (with compounding)
The Repeatability Problem
Here's the reality check: achieving consistent monthly returns is difficult. Market volatility changes, stock prices drift, implied volatility compresses.
A more honest approach:
- Calculate your actual returns over 12 months
- Compare to buy-and-hold of the same stocks
- Account for the time you spent managing positions
Many traders find their actual annualized returns are 8-15% with covered calls—solid, but not the 30-40% that simplistic monthly annualization suggests.
Adjusting for Cost Basis in the Wheel Strategy
Here's where most traders make mistakes: calculating covered call returns without accounting for premiums collected earlier in the wheel cycle.
The Wheel Strategy Cost Basis Problem
The wheel strategy involves:
- Sell cash-secured put, collect premium
- Get assigned shares
- Sell covered calls on those shares
- Eventually exit or get assigned again
Your broker shows the wrong cost basis after step 2. This breaks your return calculations.
Example:
- Sell $50 cash-secured put, collect $2.00 premium ($200)
- Get assigned 100 shares at $50
- Broker shows cost basis: $50/share ($5,000 total)
- Real cost basis: $48/share ($4,800 total, after the $200 put premium)
When you sell a covered call for $150 premium on these shares, your return isn't $150 ÷ $5,000 = 3%. It's actually $150 ÷ $4,800 = 3.125%.
Small difference here, but it compounds across multiple cycles and positions.
Tracking Adjusted Cost Basis Manually
If you're using spreadsheets, here's what you need to track:
- Initial put strike price
- Put premium collected
- Adjusted cost basis (strike - premium)
- Each covered call premium collected
- Any rolling premiums
- Final exit price
This becomes a nightmare with 10+ positions running through different stages of the wheel. You forget to update something, miscalculate somewhere, and your returns tracking becomes unreliable.
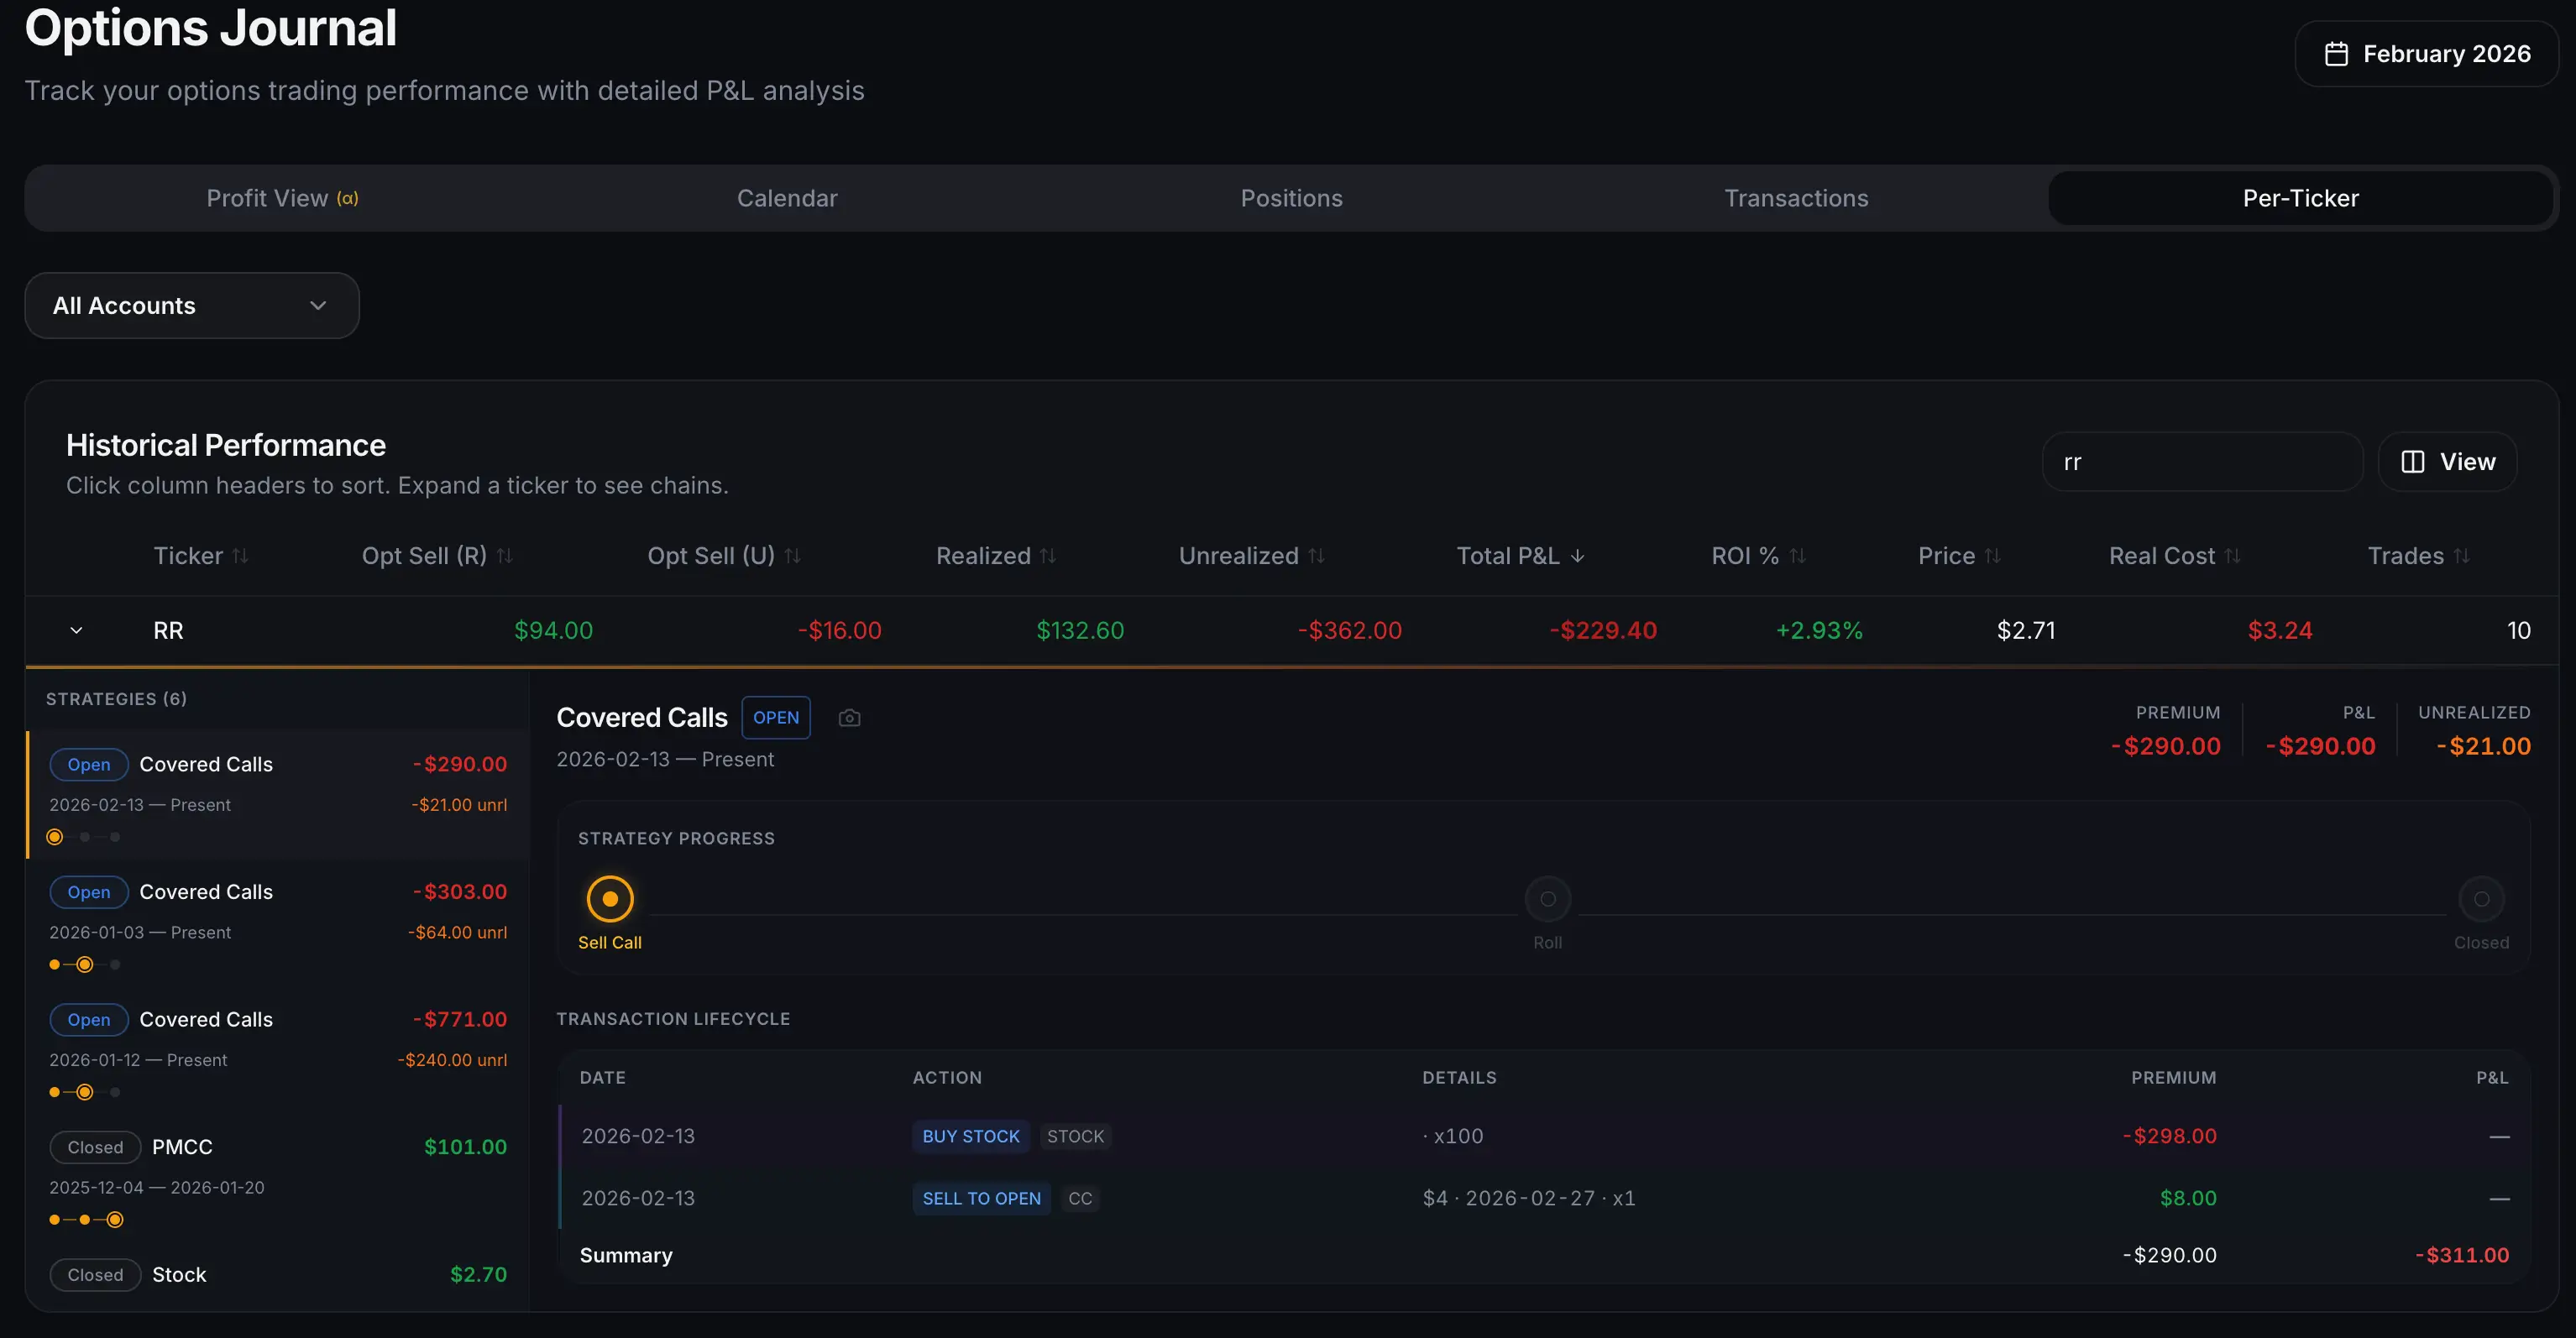
How Professional Traders Handle This
Professional wheel traders use platforms that automatically adjust cost basis through every stage:
- Initial put premium? Tracked and applied to cost basis.
- Assigned? Cost basis automatically adjusted.
- Covered call premium? Added to total return calculation.
- Rolled the call? New premium tracked, adjusted cost basis calculated.
- Final assignment or exit? Complete return calculated automatically.
This is exactly why QuantWheel exists. The platform automatically tracks your true cost basis through complete wheel cycles—from cash-secured put through assignment through covered calls to final exit. No manual spreadsheet updates, no calculation errors, no forgotten premiums.
Start your free trial of QuantWheel to see automatic cost basis tracking in action.
Keep track of trades inside QuantWheel →
Common Return Calculation Mistakes (And How to Avoid Them)
Mistake 1: Ignoring Dividends
If your stock pays dividends while you hold shares, that's income you should include in your return calculation.
Corrected formula: Total Return = (Premium + Capital Gains + Dividends) ÷ Cost Basis × 100
Example: $200 premium + $50 dividend = $250 total income to factor in.
Mistake 2: Using Wrong Time Period for Annualization
Count actual calendar days, not trading days. If you sell a 30-day call, use 30 days in your annualization formula, not 21 trading days.
Mistake 3: Forgetting About Assignment Risk Impact
When calculating expected returns before entering a trade, many traders assume calls will expire worthless. But assignment happens, especially with in-the-money calls.
Always calculate both scenarios:
- Return if call expires worthless (keep premium + shares)
- Return if assigned (premium + capital gains up to strike)
Mistake 4: Not Accounting for Trading Costs
Commissions and fees reduce returns. If you paid $1.30 in total fees on a $200 premium trade, your net premium is $198.70.
Most brokers now offer $0 commissions on stock trades, but options contracts may still have per-contract fees ($0.50-$0.65/contract is common).
Mistake 5: Comparing to Wrong Benchmarks
Don't compare covered call returns to cash or bonds if you're holding growth stocks. Compare to buy-and-hold of the same stocks—that's your real opportunity cost.
Calculating Returns on Rolled Positions
Rolling a covered call adds complexity to return calculations. Here's how to handle it correctly.
What is Rolling?
Rolling means closing your current covered call (buy to close) and simultaneously opening a new one (sell to open), typically at a later expiration or different strike.
How to Calculate Returns on Rolls
Track each leg separately:
- Original call premium collected: $200
- Cost to close position: -$300 (debit)
- Premium from new call: $250
- Net premium from roll: $200 - $300 + $250 = $150 total
Your return calculation uses the NET premium across all rolls, not just the initial premium.
Example: Rolling for Credit
- Sell $55 call expiring Feb 16 for $200
- Feb 16: Stock at $56, call is ITM
- Buy to close Feb 16 call: -$180 (small loss since near expiration)
- Sell Mar 15 $57 call: $240
- Net premium: $200 - $180 + $240 = $260 total
Your return calculation uses $260, and your time period extends to Mar 15.
Example: Rolling for Debit
Sometimes you roll at a net debit to avoid assignment:
- Original $55 call: $200 collected
- Buy to close: -$450 (stock ran up significantly)
- Sell new $60 call: $300
- Net premium: $200 - $450 + $300 = $50 total
You're still profitable overall ($50 net credit), but far less than the original $200 suggested.
Using Covered Call Calculators vs Manual Math
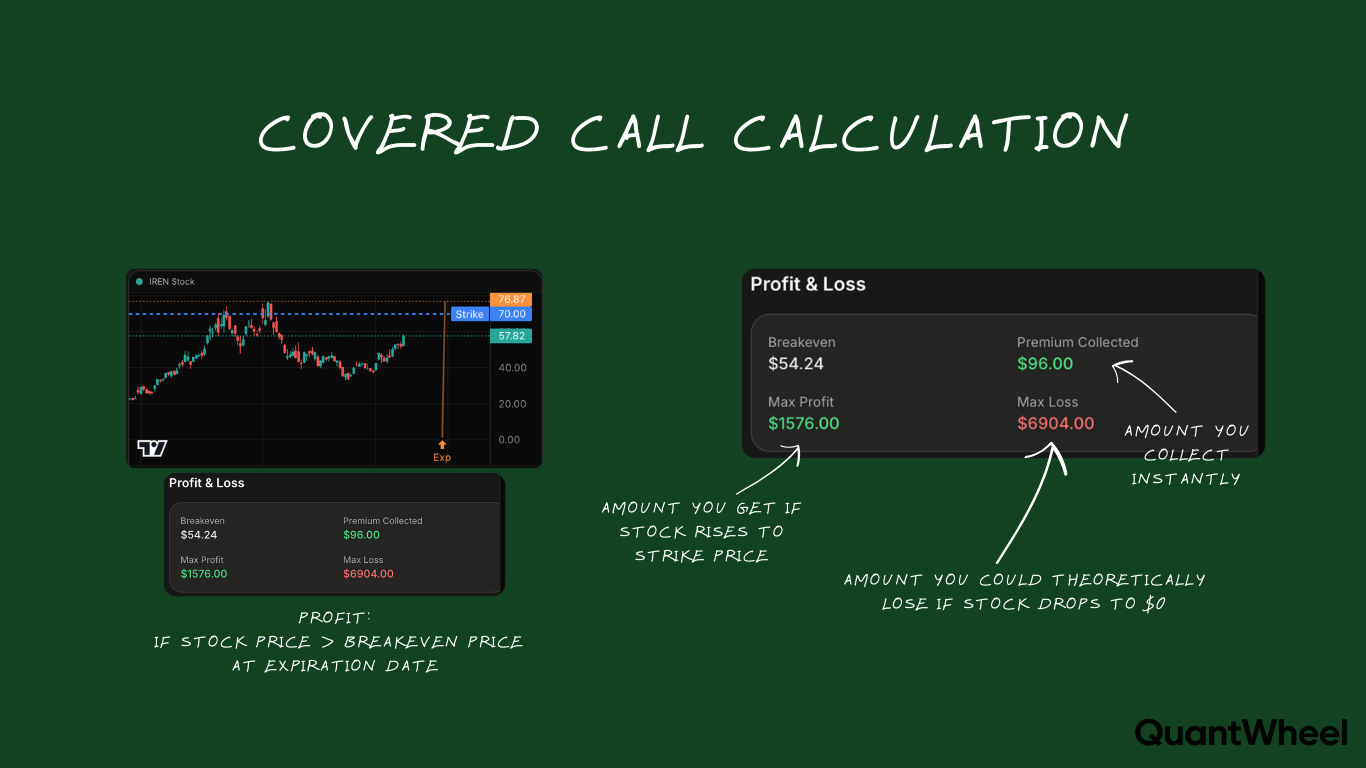
What Calculators Can Do
Options profit calculators can show:
- Profit/loss at various stock prices
- Breakeven points
- Maximum gain and maximum loss
- Return on investment at expiration
These are helpful for planning trades before entry.
What Calculators Miss
Standard calculators don't handle:
- Cost basis adjustments from earlier wheel stages
- Multiple rolls with different credits/debits
- Aggregate portfolio returns across many positions
- Tax implications of short-term vs long-term gains
- Time-weighted returns across varying position sizes
For real portfolio management with multiple covered call positions, you need something more sophisticated than a single-trade calculator.
The Case for Automated Tracking
After managing your first 5-10 covered call positions, the manual math becomes tedious. You need:
- Automatic premium tracking
- Cost basis adjustments through the full wheel cycle
- Aggregate portfolio return calculations
- Historical performance by stock, strategy, and time period
- Tax reporting that accounts for all premiums and assignments
QuantWheel handles all of this automatically. When you get assigned, the platform adjusts your cost basis. When you sell covered calls, it tracks premium against your true cost. When you roll, it accounts for the net credit or debit.
No spreadsheet updates. No manual calculations. Just accurate returns that reflect your real trading performance.
Start your free trial of QuantWheel to see how professional tracking improves your decision-making.
Comparing Covered Call Returns to Buy-and-Hold
The ultimate question: does selling covered calls actually beat just holding your stocks?
The Math of the Comparison
Take the same $5,000 position over one year:
Scenario A: Buy-and-Hold
- Stock appreciates from $50 to $58 (+16%)
- Total return: 16%
Scenario B: Covered Calls (4 quarterly cycles)
- Q1: Collect $150 premium, assigned at $55 (+10% for quarter)
- Q2-Q4: Repeat similar cycles
- Total return: ~12-14% (varies by executions)
In strong bull markets, buy-and-hold often wins because your upside is capped. In sideways or moderately bullish markets, covered calls typically outperform due to premium income.
When Covered Calls Outperform
- Flat or sideways markets (premium is pure profit)
- Moderately bullish markets (premium + some appreciation)
- High volatility environments (larger premiums available)
- Dividend-paying stocks (combine premium + dividends)
When Buy-and-Hold Wins
- Strong bull markets (you cap your upside)
- Low volatility environments (premiums too small to matter)
- Fast-moving growth stocks (constantly getting assigned below true value)
The Boring Middle Ground (Where Most Traders Live)
Most traders find covered calls generate an extra 3-7% annually compared to buy-and-hold of the same stocks, assuming disciplined execution. Not exciting, but consistent.
That's the QuantWheel philosophy: conservative, consistent, boring, profitable. We're not promising 50% annual returns. We're helping you systematically add 3-7% through premium collection, tracked accurately so you actually know if it's working.
Tax Implications of Covered Call Returns
Returns aren't just about the math—taxes affect your actual take-home profit.
Short-Term vs Long-Term Capital Gains
If you get assigned on covered calls, you're selling your shares. The holding period determines your tax treatment:
- Held > 1 year: Long-term capital gains (15-20% for most traders)
- Held < 1 year: Short-term capital gains (taxed as ordinary income, up to 37%)
This significantly affects after-tax returns.
Premium Income is Always Short-Term
Options premiums are always taxed as short-term capital gains, regardless of holding period. That $200 premium is taxed at your ordinary income rate.
The Qualified Covered Call Exception
Some covered calls qualify for special tax treatment that preserves long-term capital gains status on your shares. Requirements:
- Call must be > 30 days to expiration when sold
- Strike price must be above specific thresholds relative to stock price
- Stock must be held > 1 year at the time you sell the call
Consult a tax professional—these rules are complex.
After-Tax Return Example
Pre-tax return: 12% Tax rate on short-term gains: 32% After-tax return: 12% × (1 - 0.32) = 8.16%
If buy-and-hold of the same stock generated 10% long-term gains (taxed at 15%), the after-tax return is 8.5%. In this example, buy-and-hold wins after taxes despite lower pre-tax returns.
Always calculate after-tax returns for fair comparisons.
Real-World Return Expectations
Let's set realistic expectations for covered call returns.
Typical Premium Yields
Selling slightly out-of-the-money calls (5-10% above current price) typically generates:
- Low volatility stocks: 0.5-2% premium per month
- Medium volatility stocks: 2-4% premium per month
- High volatility stocks: 4-8% premium per month
But remember: higher volatility = higher risk of stock decline.
Assignment Rates
Expect to get assigned on approximately 20-30% of covered calls if you're selling slightly OTM strikes. This means:
- 70-80% of calls expire worthless (you keep premium + shares)
- 20-30% result in assignment (you sell shares at strike)
Realistic Annual Returns
Conservative covered call strategies on diversified portfolios typically generate:
- Base case: 8-12% annual total return
- Good year: 12-18% annual return
- Difficult year: 2-8% annual return
These include both premium income and stock appreciation/depreciation.
Compare this to buy-and-hold index returns of ~10% historically. You're not massively outperforming—you're generating somewhat more consistent returns with lower volatility.
Conclusion: Returns Are Only Valuable If You Track Them Correctly
Calculating covered call returns accurately isn't optional—it's essential for knowing if your strategy actually works.
You need to track:
- All premiums collected (including rolls)
- True cost basis (adjusted for earlier put premiums in the wheel)
- Capital gains and losses
- Time periods for proper annualization
- After-tax returns for real profitability
Get any of these wrong, and you're flying blind.
The traders who succeed with covered calls long-term are those who track performance religiously, learn from what works (and what doesn't), and continuously refine their approach based on data.
You can do this manually with spreadsheets if you have 2-3 positions. Beyond that, you need professional tools built specifically for options tracking.
QuantWheel automatically tracks every component of your covered call returns: premium collection, adjusted cost basis, capital gains, aggregate portfolio performance, and tax reporting. No manual math, no calculation errors, no missed premiums.
Start your free trial of QuantWheel and see your actual returns—calculated correctly, tracked automatically, displayed clearly.
Risk Disclosure
Options trading involves substantial risk and is not suitable for all investors. Past performance does not guarantee future results. This content is for educational purposes only and should not be considered investment advice. Always do your own research and consider consulting with a financial advisor before making investment decisions.
The examples used in this article are for educational purposes only and are not recommendations to buy or sell any security. All investment decisions should be based on your own analysis and risk tolerance.