If you're exploring options trading—especially the wheel strategy—you need to understand the fundamental difference between calls and puts. These are the two types of options contracts, and knowing how they work is essential before you execute your first trade.
This guide explains calls vs puts in plain English, shows you real examples, and helps you understand how both fit into systematic options strategies like the wheel.
After reading this text, the best approach in learning how to actually trade is to recognize what's a good trade and what's a bad trade. QuantWheel help you do that. It finds and ranks the best deals available so that you can immediately know the difference.
Learn faster with QuantWheel →
TLDR: Calls vs Puts Explained Simply
Call options give you the right to buy stock at a specific price (called the strike price) before a certain date (the expiration). Think of it like a coupon that lets you purchase stock at a locked-in price, even if the market price goes higher.
Put options give you the right to sell stock at a specific price before expiration. Think of it like insurance that guarantees you can sell at a certain price, even if the market crashes.
Simple Example: The $50 Stock
Imagine a stock trading at $50:
- Call option (strike $55): Gives you the right to buy the stock at $55. If the stock jumps to $70, you can still buy it at $55 and immediately profit $15 per share (minus what you paid for the option).
- Put option (strike $45): Gives you the right to sell the stock at $45. If the stock drops to $30, you can still sell it at $45, protecting you from the loss.
Key point for wheel traders: Most wheel strategy traders don't buy options—they sell them. When you sell a cash-secured put, you're on the other side: you're collecting premium from someone buying that protection. When you sell a covered call, you're collecting premium from someone buying that right to purchase shares.
What Are Call Options? Complete Explanation
A call option is a contract that gives the buyer the right (but not the obligation) to buy 100 shares of a stock at a predetermined price (the strike price) before the option expires.
Call Options: The Mechanics
- One contract = 100 shares of stock
- Premium = The price you pay (or collect) for the option
- Strike price = The price at which you can buy the stock
- Expiration date = When the option contract ends
- Call buyer = Pays premium, gets the right to buy stock
- Call seller = Collects premium, has obligation to sell stock if exercised
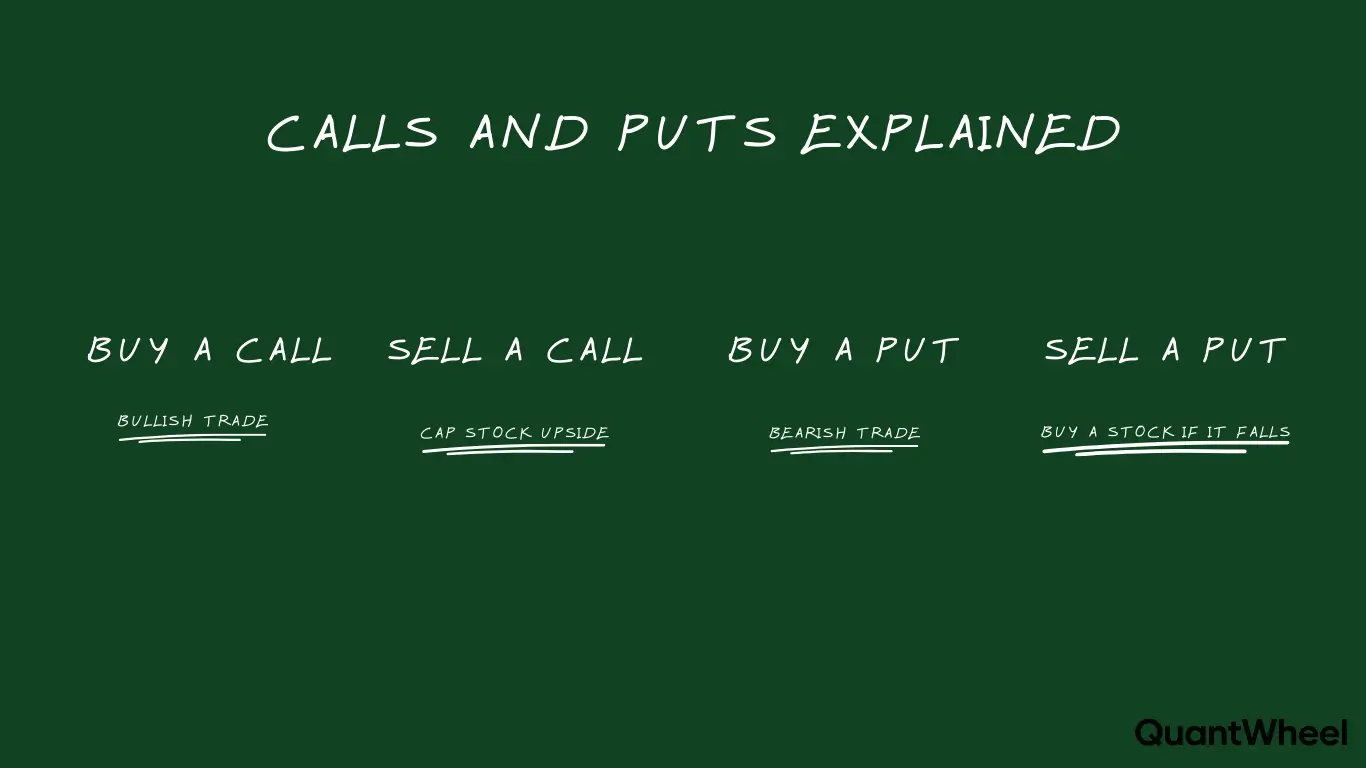
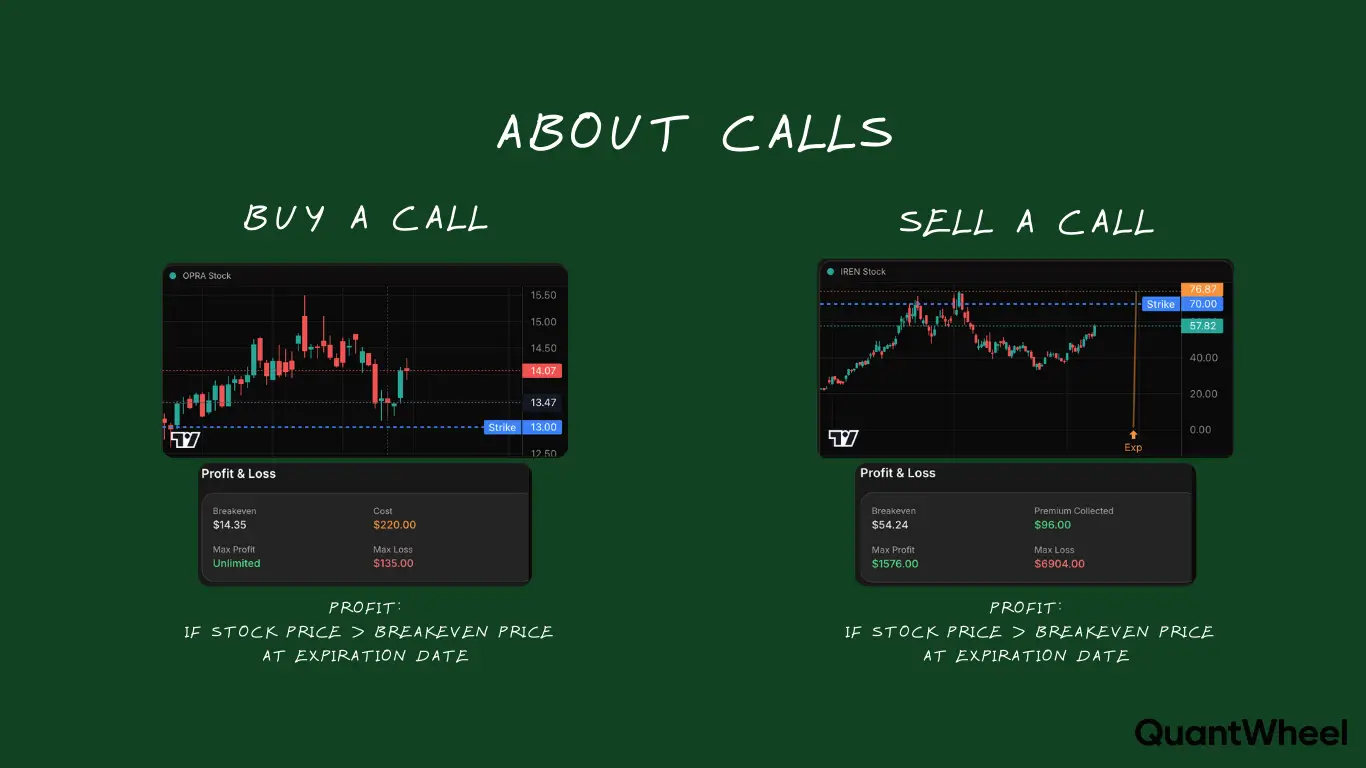
Buying Call Options: Bullish Speculation
When you buy a call option, you're betting the stock will go up. You pay a premium upfront for the right to buy shares at the strike price.
Example: Buying a Call
- Stock price: $100
- Buy $105 call expiring in 30 days
- Premium paid: $3 per share ($300 for one contract)
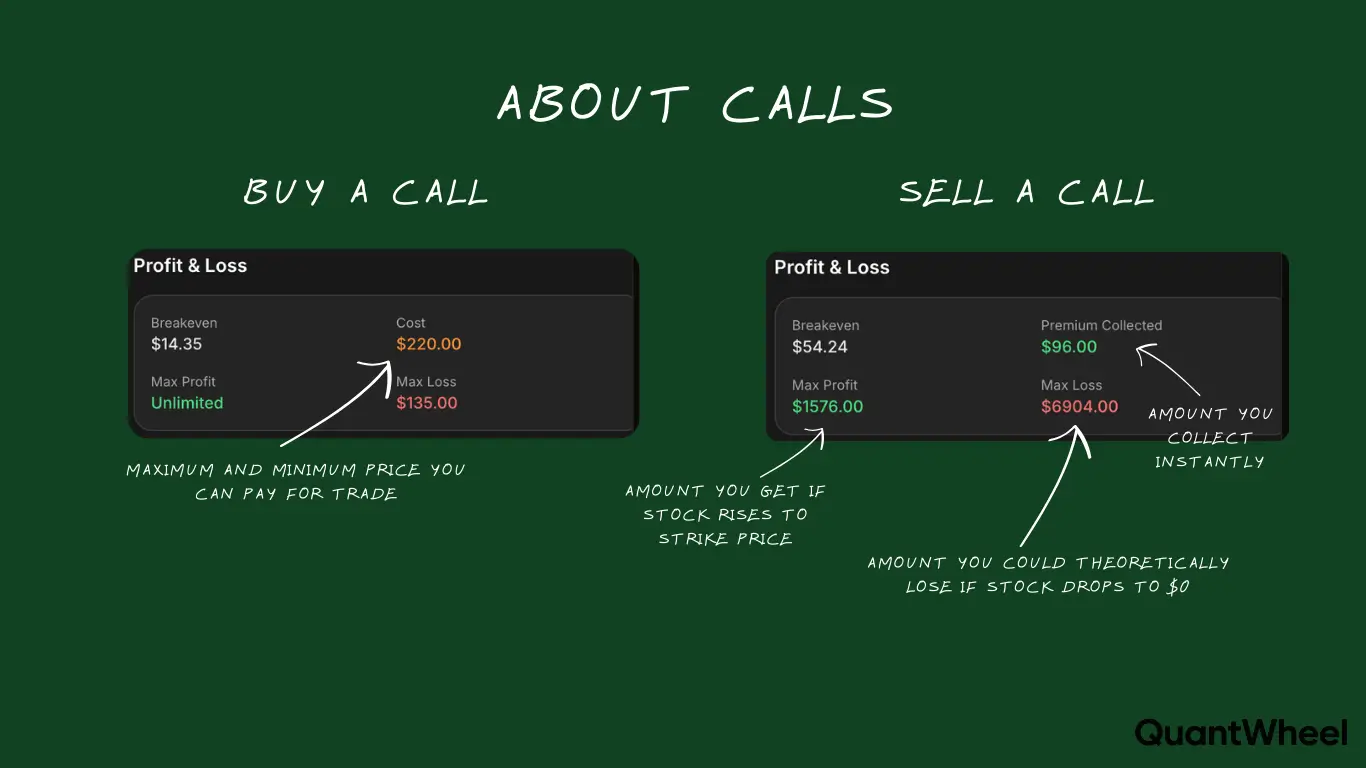
- Breakeven: $108 (strike + premium)
- Max loss: $300 (the premium paid)
- Max gain: Unlimited (if stock keeps rising)
If the stock rises to $120:
- Exercise your option to buy at $105
- Immediately worth $120
- Profit: $15 per share minus $3 premium = $12 per share ($1,200 total)
If the stock stays at $100 or drops:
- Option expires worthless
- Loss: $300 premium paid
Selling Covered Calls: Income Generation
When you sell a covered call (meaning you own the underlying 100 shares), you collect premium in exchange for giving someone else the right to buy your shares at the strike price.
Example: Selling a Covered Call
- You own 100 shares at $100 cost basis
- Sell $110 call expiring in 30 days
- Premium collected: $2 per share ($200 total)
Three possible outcomes:
- Stock stays below $110: Option expires worthless, you keep premium and shares
- Stock rises to $115: Shares get called away at $110, you keep premium
- Total profit: $10 per share (appreciation) + $2 premium = $1,200
- Stock drops to $95: You keep shares and $200 premium
- This reduces your effective loss to $5 per share instead of $5
This is the second phase of the wheel strategy—collecting premium while holding stock.
What Are Put Options? Complete Explanation
A put option is a contract that gives the buyer the right (but not the obligation) to sell 100 shares of stock at a predetermined strike price before expiration.
Put Options: The Mechanics
- One contract = 100 shares of stock
- Premium = The price you pay (or collect) for the option
- Strike price = The price at which you can sell the stock
- Expiration date = When the option contract ends
- Put buyer = Pays premium, gets the right to sell stock (or protection)
- Put seller = Collects premium, has obligation to buy stock if assigned
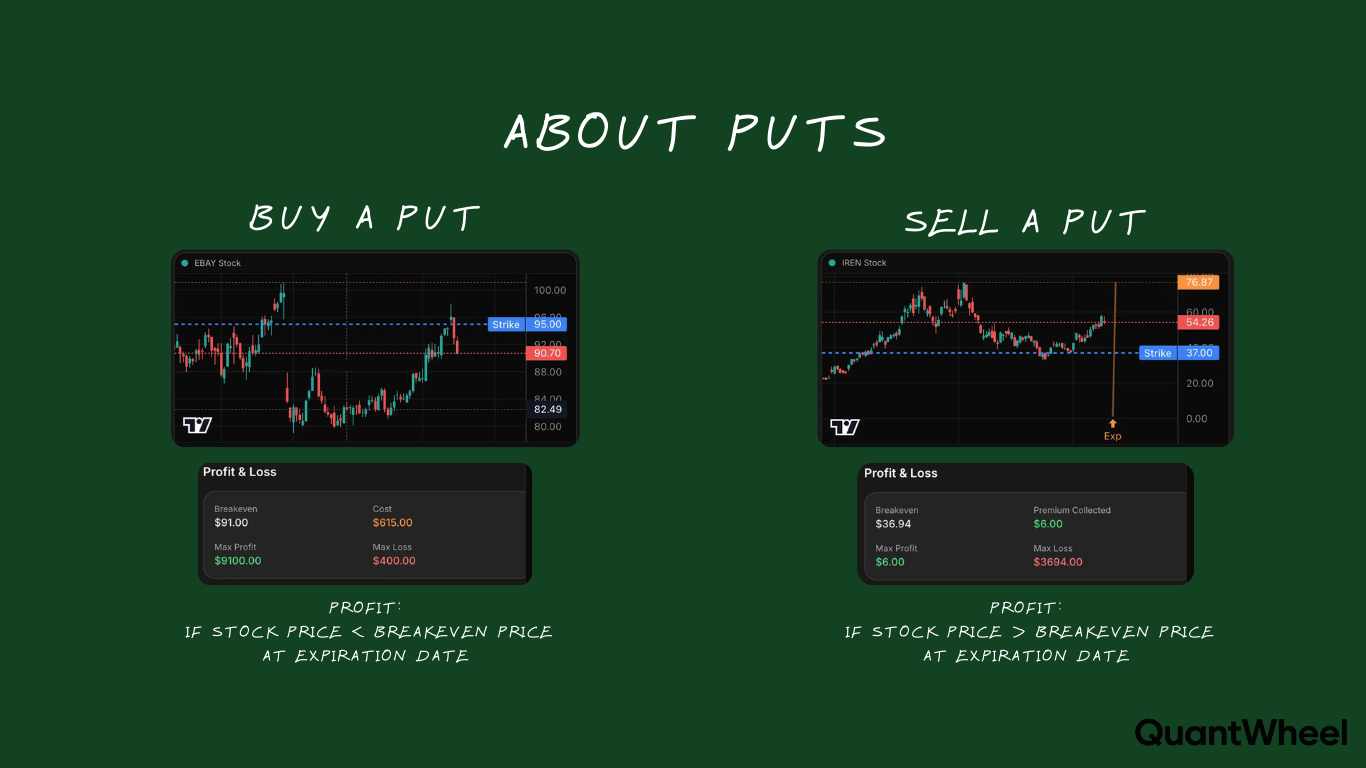
Buying Put Options: Bearish Speculation or Protection
When you buy a put option, you're either betting the stock will fall, or you're buying insurance to protect shares you already own.
Example: Buying a Put
- Stock price: $100
- Buy $95 put expiring in 30 days
- Premium paid: $2 per share ($200 for one contract)
- Breakeven: $93 (strike minus premium)
- Max loss: $200 (the premium paid)
- Max gain: $9,300 (if stock goes to $0)
If the stock drops to $80:
- Exercise your option to sell at $95
- Buy shares at $80, sell at $95
- Profit: $15 per share minus $2 premium = $13 per share ($1,300 total)
If the stock stays above $95:
- Option expires worthless
- Loss: $200 premium paid
Selling Cash-Secured Puts: Strategic Stock Acquisition
When you sell a cash-secured put, you collect premium in exchange for agreeing to buy 100 shares at the strike price if the stock falls below it. This is the first phase of the wheel strategy.
Example: Selling a Cash-Secured Put
- Stock price: $100
- Sell $95 put expiring in 30 days
- Premium collected: $2 per share ($200 total)
- Cash reserved: $9,500 (to buy shares if assigned)
Three possible outcomes:
- Stock stays above $95: Option expires worthless, you keep $200 premium
- Return: 2.1% in 30 days on cash reserved
- Stock drops to $90: You get assigned, must buy 100 shares at $95
- Effective cost basis: $93 per share ($95 strike minus $2 premium)
- You now own shares at a discount and can sell covered calls
- Stock rises to $110: Option expires worthless, you keep premium
- You missed the rally but made 2.1% on your cash
This is how wheel traders use puts—to get paid while waiting to buy quality stocks at prices they're comfortable owning.
Calls vs Puts: Side-by-Side Comparison
| Feature | Call Options | Put Options |
|---|---|---|
| Basic right | Right to BUY stock | Right to SELL stock |
| When to buy | Bullish on stock | Bearish on stock or hedging |
| Buyer profit | Stock rises above strike | Stock falls below strike |
| Seller obligation | Must sell stock if exercised | Must buy stock if assigned |
| Wheel strategy use | Sell covered calls for income | Sell cash-secured puts for entry |
| Risk when buying | Limited to premium paid | Limited to premium paid |
| Risk when selling | Unlimited (stock could rise infinitely) | Substantial (stock could fall to $0) |
| Common mistake | Buying far out-of-the-money calls | Selling puts on stocks you don't want to own |
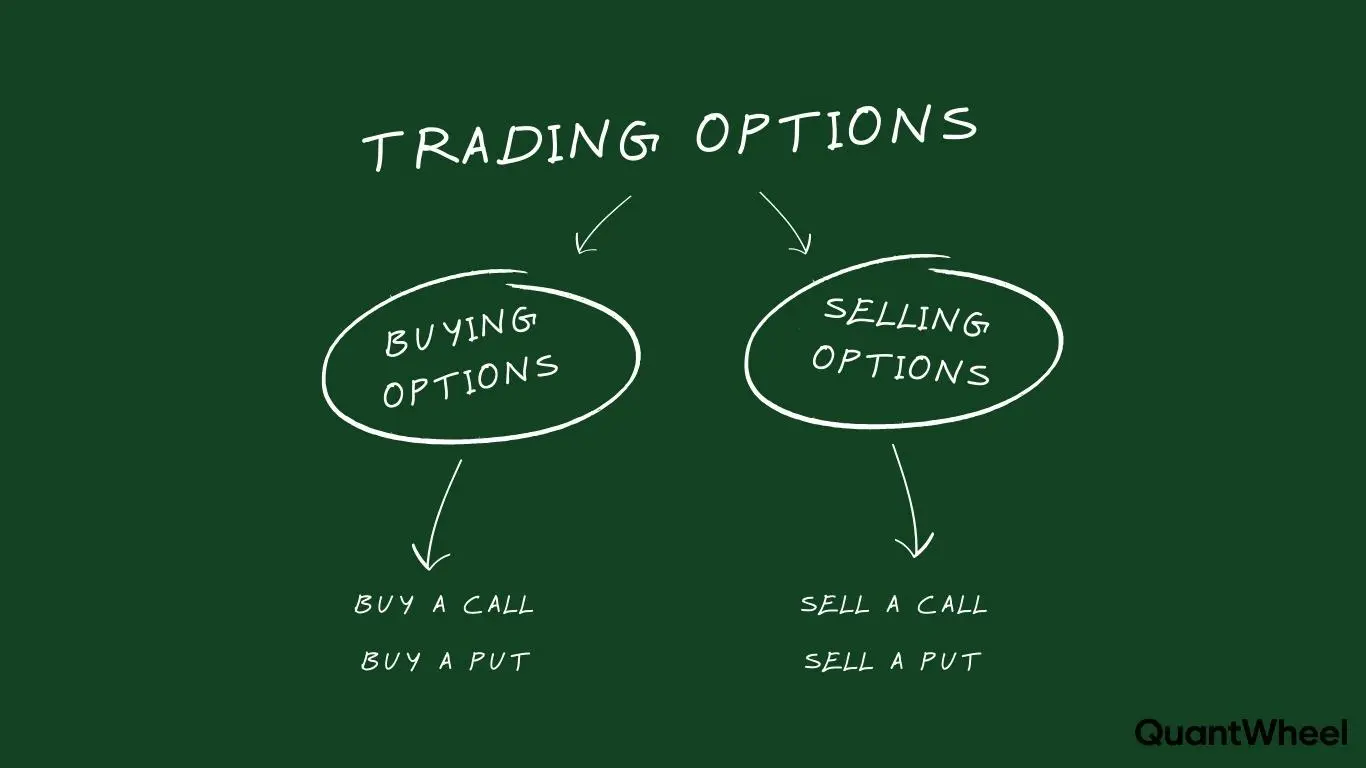
Buying vs Selling: The Critical Distinction
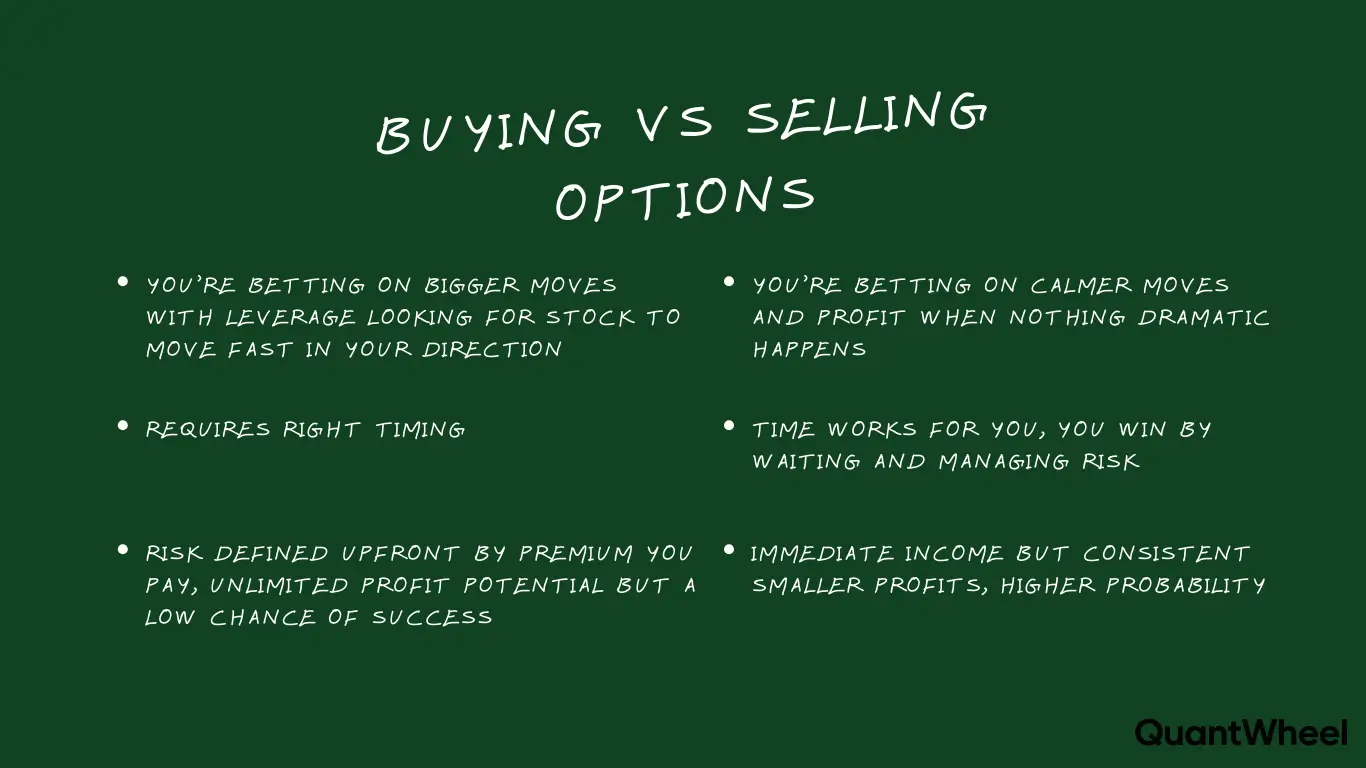
Understanding calls vs puts is one thing. Understanding buying vs selling is equally important, especially for wheel strategy traders.
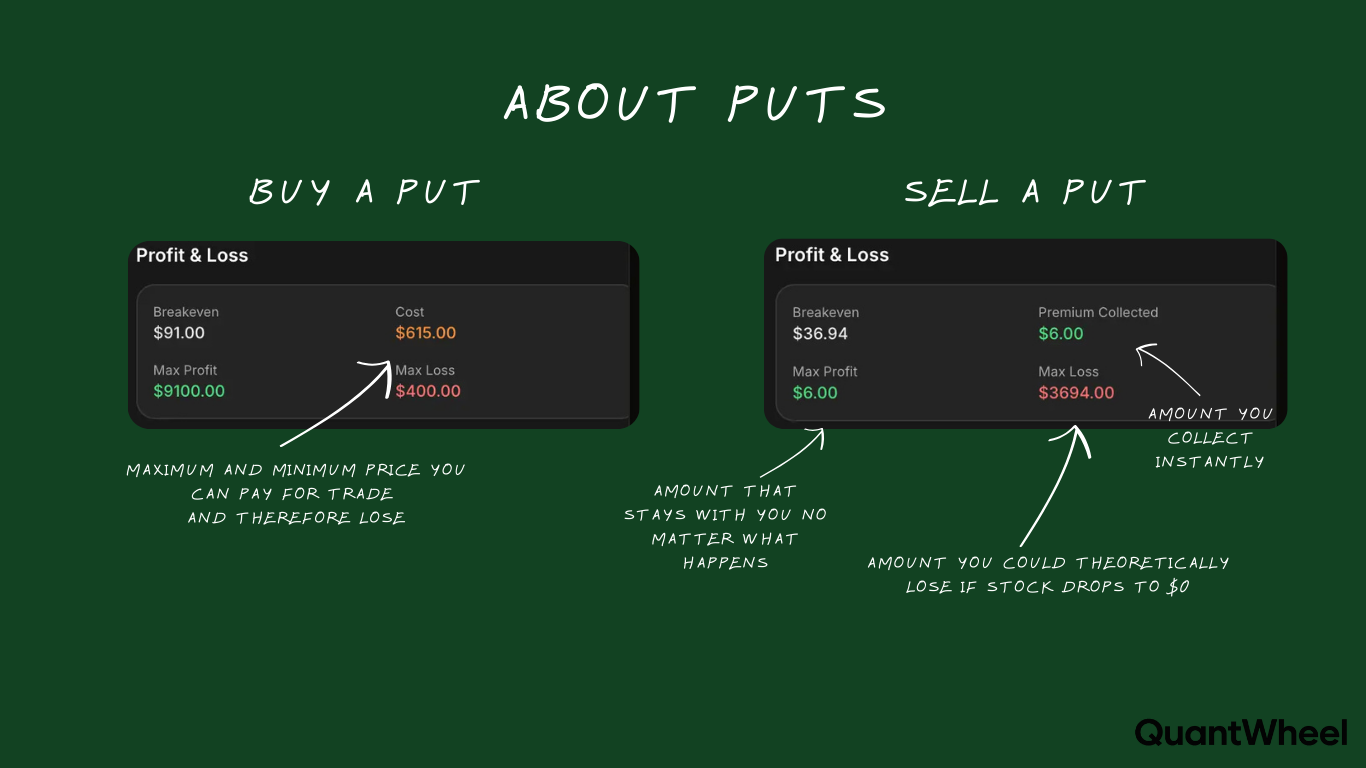
Buying Options (Long Positions)
Buying calls or puts:
- You pay premium upfront
- You have rights, no obligations
- Max loss = premium paid
- You need the stock to move significantly to profit (overcome premium + time decay)
- Roughly 60-70% of options expire worthless (buyers lose)
Who does this: Directional traders speculating on stock movement, hedgers protecting positions.
Selling Options (Short Positions)
Selling calls or puts:
- You collect premium upfront
- You have obligations if exercised/assigned
- Losses can be substantial (not unlimited for puts, since stocks can't go below $0)
- Probability on your side (most options expire worthless)
- You profit from time decay (theta)
Who does this: Wheel strategy traders, income-focused traders, traders selling volatility.
How Calls and Puts Work Together in the Wheel Strategy
The wheel strategy elegantly combines both puts and calls in a repeating cycle:
Phase 1: Sell Cash-Secured Puts
You sell puts on quality stocks you'd be happy to own at a discount.
- Collect premium while cash sits in your account
- If assigned, you acquire shares at an effective discount (strike minus premium collected)
- If not assigned, you keep premium and repeat
Phase 2: Sell Covered Calls
Once you own shares (either from assignment or direct purchase), you sell covered calls.
- Collect premium on shares you already own
- If shares get called away, you sell at a profit (strike above your cost basis) plus all the premium
- If not called away, you keep premium and shares, then repeat
The Continuous Cycle
Put premium → Assignment → Stock ownership → Call premium → Called away → Put premium → repeat
This is where most traders struggle: Tracking cost basis through this entire cycle. Your broker shows your assignment cost, but your real cost basis includes all the premium collected from puts. Then when you sell covered calls, that premium further reduces your effective basis.
This is exactly why QuantWheel exists. We automatically track your cost basis through every stage of the wheel: from the initial put sale, through assignment, through covered calls, all the way to exit. Your real breakeven and profit calculations are always accurate, without manual spreadsheet tracking.
Real-World Example: Complete Wheel Cycle with Calls and Puts
Let's walk through a complete wheel cycle to show how calls and puts work together:
Starting Position: Sell Cash-Secured Put
- Stock: Trading at $52
- Action: Sell $50 put expiring in 30 days
- Premium collected: $1.50 per share ($150)
- Cash reserved: $5,000
Outcome 1: Assignment on the Put
Stock drops to $48 at expiration. You get assigned. Great, you got a stock at a price you wanted AND for less.
- You now own: 100 shares at $50 per share
- Cash spent: $5,000
- Premium already collected: $150
- Real cost basis: $48.50 per share ($50 - $1.50)
- (Your broker shows $50, but QuantWheel shows your true $48.50 basis)
Phase 2: Sell Covered Call
Now you own shares. Time to sell covered calls. This is like collecting rent.
- Stock: Now at $51
- Action: Sell $53 call expiring in 30 days
- Premium collected: $1 per share ($100)
- Effective cost basis now: $47.50 ($48.50 - $1.00)
Outcome 2: Shares Called Away
Stock rises to $54 at expiration. Your shares get called away at $53.
Total P&L Calculation:
- Bought shares at: $50 (assignment)
- Sold shares at: $53 (called away)
- Put premium: +$150
- Call premium: +$100
- Total profit: $550 on $5,000 = 11% return in 60 days
What happened: You used a put to enter at $50, collected put premium, collected call premium, and sold shares at $53. Total premium collected was $250, plus $300 in stock appreciation.
Without proper tracking (like QuantWheel provides), many traders lose track of their true cost basis and can't accurately calculate whether they're actually profitable through these cycles.
Common Mistakes: Calls vs Puts Edition
Mistake 1: Buying Cheap Options That Expire Worthless
Many beginners buy far out-of-the-money calls or puts because they're cheap ($0.50 per share). The stock needs to move dramatically for these to profit. Most expire worthless.
Better approach: If you must buy options, buy closer to the money. Or better yet, sell options to collect premium.
Mistake 2: Selling Puts on Stocks You Don't Want to Own
Selling puts works great when you'd genuinely be happy owning the stock. It becomes a nightmare when you get assigned on a stock that's plummeting and you panic.
Better approach: Only sell puts on quality stocks at strikes where you'd be comfortable holding long-term.
Mistake 3: Not Understanding Assignment Mechanics
Getting assigned on puts means you BUY shares. Getting assigned (exercised) on calls means you SELL shares. Confusing these leads to surprise positions in your account.
Better approach: Use a platform like QuantWheel that clearly shows your obligations and tracks what happens at assignment.
Mistake 4: Ignoring Cost Basis Through Wheel Cycles
Your broker's cost basis doesn't account for premiums collected before assignment. After multiple wheel cycles, your real breakeven is completely different from what your broker shows.
Better approach: Track every premium collected through the complete cycle. QuantWheel does this automatically, adjusting your cost basis at each stage so you always know your true breakeven.
Mistake 5: Selling Calls Too Close to Your Cost Basis
If you get assigned at $50 and immediately sell $51 calls, you're capping your upside at just $1 per share. If the stock runs to $60, you miss huge gains.
Better approach: Sell calls at strikes above your cost basis where you'd be happy taking profit. Many wheel traders target strikes 5-10% above their basis.
Key Concepts: Greeks, Premium, and Time Decay
Understanding calls vs puts also means understanding what affects their prices.
Delta: Directional Exposure
Delta measures how much an option's price changes when the stock moves $1.
- Call delta: +0.30 means the call gains $0.30 if stock rises $1
- Put delta: -0.30 means the put gains $0.30 if stock falls $1
- Wheel traders typically sell: 0.20-0.30 delta options (out-of-the-money)
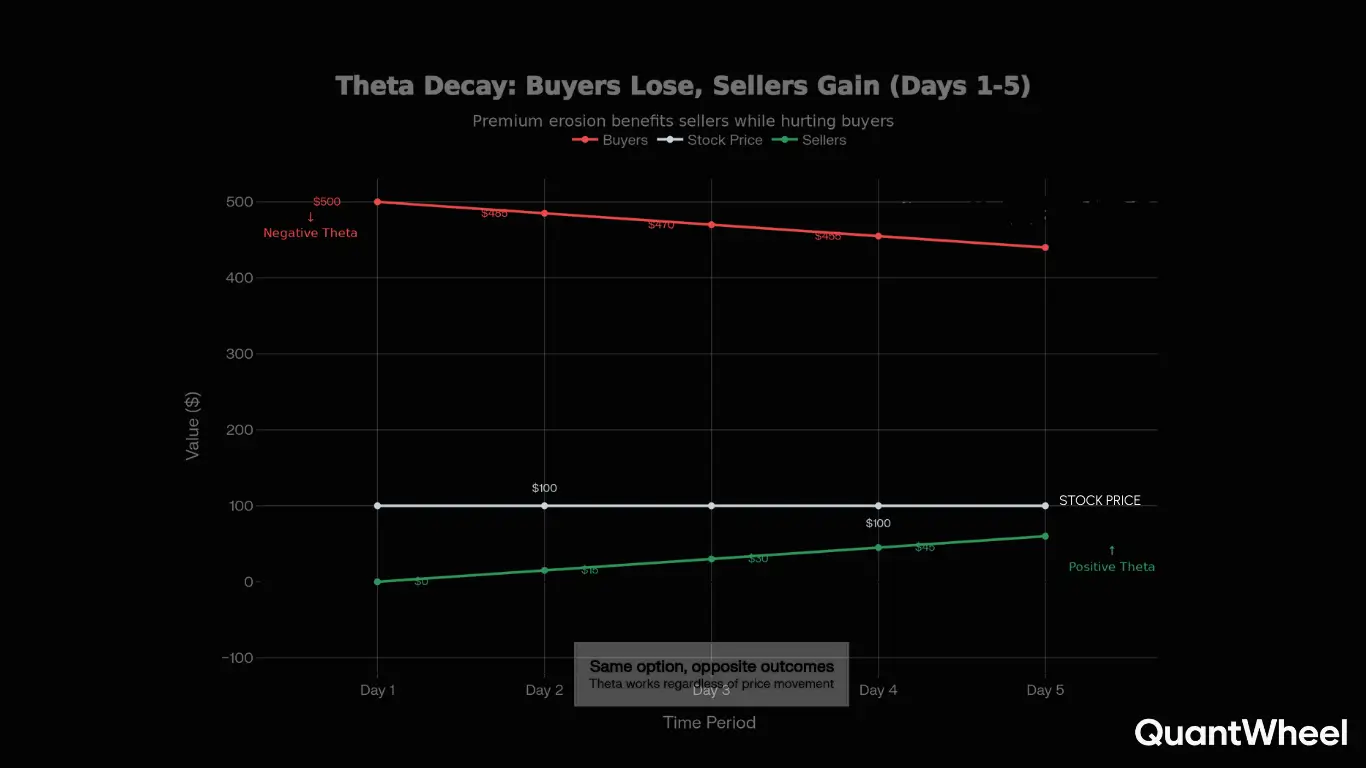
Theta: Time Decay
Theta measures how much an option loses in value each day as it approaches expiration.
- Option buyers: Theta works against you (value decays daily)
- Option sellers: Theta works for you (you profit from decay)
- Wheel strategy: Sells options to collect theta consistently
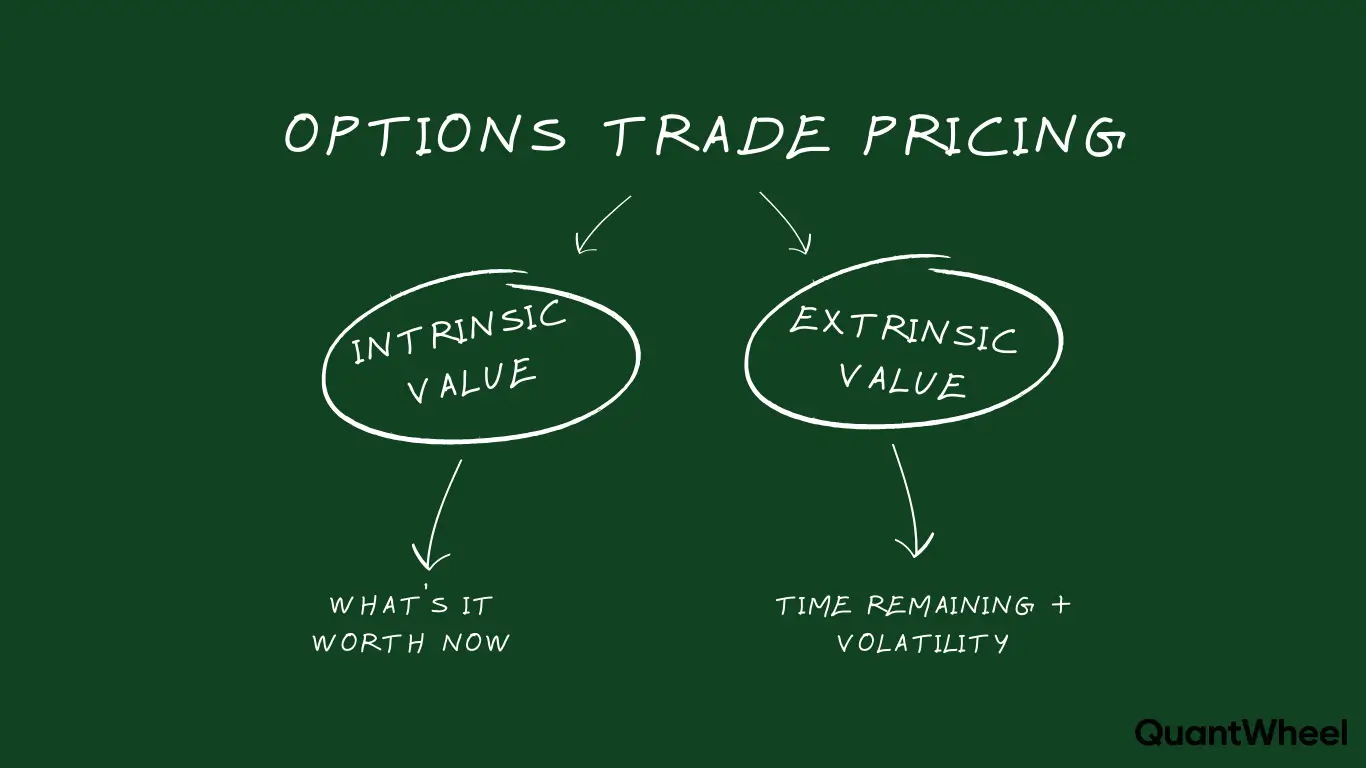
Premium: What You Pay or Collect
Premium is the price of the option—what buyers pay and sellers collect.
- Affected by: Stock price, strike price, time to expiration, volatility
- Higher IV (implied volatility) = higher premiums
- Wheel traders target: High-IV stocks with quality fundamentals
Which Should You Use: Calls or Puts?
The answer depends on your strategy:
For Wheel Strategy Traders (Income Focus):
Sell cash-secured puts when:
- You want to own shares at a lower price
- You're comfortable holding the stock long-term
- IV is elevated (higher premium)
- Strike price is where you'd happily buy
Sell covered calls when:
- You own shares from assignment or purchase
- You'd be happy selling at the strike price
- You want to generate income on holdings
- Stock has risen and you want to take profit
For Directional Traders (Speculation):
Buy calls when:
- You're bullish and want leveraged upside
- You have a catalyst (earnings, announcement)
- You want defined risk (limited to premium)
Buy puts when:
- You're bearish and expect a decline
- You want to hedge existing stock positions
- You're protecting gains in a portfolio
How QuantWheel Handles Calls and Puts
Tracking options manually through spreadsheets becomes a nightmare once you're managing multiple positions across both calls and puts. Here's what QuantWheel automates:
Automatic Position Tracking
- Every put and call you sell is tracked automatically
- No manual entry needed (broker integration)
- See all active positions in one dashboard
- Get alerted to upcoming expirations and earnings
Cost Basis Through Full Cycles
- When you sell a put and collect premium, QuantWheel notes it
- When assigned, your cost basis automatically adjusts downward
- When you sell covered calls, premium further reduces basis
- When called away, your true P&L is calculated accurately
- Tax reporting is ready at year-end
Roll Analysis for Both Calls and Puts
- Should you roll that losing put? QuantWheel analyzes all options
- Which strike and expiration optimize your return?
- Shows before/after comparison for every possible roll
- Takes the guesswork out of decision-making
Portfolio-Level View
- See total premium collected from all calls and puts
- Aggregate delta and theta across positions
- Sector concentration analysis
- Real-time P&L that accounts for all premiums
Without this level of automation, traders either spend hours in spreadsheets or lose track of their true performance. Most wheel traders we talk to say cost basis tracking after assignment was their biggest pain point before QuantWheel.
Calls vs Puts: Final Thoughts
Understanding the difference between call and put options is fundamental to options trading, especially if you're running the wheel strategy.
Remember the basics:
- Calls = right to buy stock
- Puts = right to sell stock
- Buying options = speculation with limited risk
- Selling options = income generation with probability advantage
For wheel traders specifically:
- Sell cash-secured puts to enter positions at a discount
- Sell covered calls to generate income on holdings
- Track cost basis through the complete cycle
- Focus on quality stocks at strikes you're comfortable with
The mechanics aren't complicated, but executing systematically and tracking everything accurately requires discipline—or the right tools. That's exactly why we built QuantWheel: to automate the tedious parts so you can focus on trading smart.
Start finding good deals inside QuantWheel →
Risk Disclosure
Options trading involves substantial risk and is not suitable for all investors. Past performance does not guarantee future results. This content is for educational purposes only and should not be considered investment advice. Always do your own research and consider consulting with a financial advisor before making investment decisions.
The examples used in this article are for educational purposes only and are not recommendations to buy or sell any security. All investment decisions should be based on your own analysis and risk tolerance.