The 100 shares of AMD you bought at $140 are now worth $160, up $2,000. You're happy with the gain, but now you're wondering: should you sell and lock in profits, or keep holding and hope for more upside?
There's a third option most investors miss: sell a covered call and get paid $300-$500 this month to potentially sell at $170. If AMD hits $170, you made $3,000 plus the premium. If it doesn't, you keep the premium and sell another call next month.
This is covered call investing - and choosing the right stocks makes all the difference between steady income and frustrating losses.
TL;DR: Best Stocks for Covered Calls
The best stocks for covered calls combine three qualities: moderate volatility for decent premiums (30-60% IV rank), stable fundamentals you'd hold long-term, and sufficient liquidity (1M+ daily volume). Target stocks generating 1-3% monthly premium - sweet spot between income and risk.
Top categories for covered calls:
- Tech Blue Chips: AAPL, MSFT, GOOGL (stability + growth)
- Dividend Aristocrats: JPM, KO, PG (income + premiums)
- Moderate Growth: AMD, PLTR, SQ (higher premiums, manageable risk)
Simple example: You own 100 shares of Microsoft at $380 ($38,000 position). You sell a $390 call expiring in 30 days for $500 premium. Two outcomes:
- MSFT stays below $390: You keep your shares + $500 premium (15.8% annualized return)
- MSFT rises above $390: Shares called away at $390. You made $1,000 gain + $500 premium = $1,500 total (47% annualized)
Either way you profit. The key is choosing stocks that go up over time, not stocks that look tempting because they pay huge premiums.
Understanding What Makes Quality Covered Call Stocks
Before diving into specific stocks, you need to understand what separates quality covered call candidates from premium traps that lose money long-term.
The Four Pillars of Covered Call Stock Selection
Pillar 1: Moderate Implied Volatility (The Premium Engine)
Implied volatility determines option premiums. Higher IV means higher premiums, but also higher risk of adverse price moves. The sweet spot for covered calls is 30-60% IV rank.
- Below 30% IV rank: Premiums too small to justify the strategy. You might collect 0.3-0.5% monthly - barely worth the effort and risk.
- 30-60% IV rank: Goldilocks zone. Collect 1-3% monthly premium with manageable risk.
- Above 60% IV rank: Warning sign. Extremely high premiums signal elevated risk of significant downside moves.
Example: Microsoft (MSFT) typically trades at 35-45% IV rank. On a $380 stock, you might collect $4-6 per share monthly (1.1-1.6% monthly premium). AMD at 55% IV rank might pay $8-10 per share monthly on a $160 stock (5-6% monthly premium) - but with proportionally higher risk.
Pillar 2: Stable Fundamentals (Your Safety Net)
This is where most covered call traders make their biggest mistake: chasing high premiums on stocks with deteriorating fundamentals. Remember: you own 100 shares. If the stock drops 30%, your $5 premium doesn't matter.
Quality fundamentals for covered calls include:
- Profitable companies with positive cash flow
- Reasonable debt levels (debt-to-equity under 2.0)
- Market leadership in growing or stable industries
- History of surviving market downturns
- Stocks you'd genuinely hold for 6-12 months if assigned
The "would I hold this?" test: Before selling a covered call, ask: "If the market dropped 20% tomorrow and I was stuck holding this stock for a year, would I be okay with that?" If no, don't sell covered calls on it.
Pillar 3: Sufficient Liquidity (Execution Quality)
Low liquidity creates two problems for covered call sellers:
- Wide bid-ask spreads that erode returns (you pay the spread on entry and exit)
- Difficulty closing when you want to roll or exit positions
Minimum liquidity requirements:
- Daily volume: 1M+ shares traded daily
- Option volume: 500+ contracts on your target strike
- Bid-ask spread: Under $0.10 for at-the-money options
Example: Selling calls on Apple (AAPL) with 50M daily volume means $0.01-0.03 spreads. Selling calls on a small-cap stock with 100K daily volume might mean $0.30-0.50 spreads - that's 5-10% of your premium lost immediately.
Pillar 4: Appropriate Price Range (Capital Efficiency)
Stock price affects both capital requirements and premium dollars collected.
- Under $20: Commission costs (typically $0.65 per contract) represent 3%+ of premium collected. Not worth it.
- $20-$50: Good for smaller accounts, but premiums in absolute dollars are modest.
- $50-$150: Sweet spot. Meaningful premium dollars with reasonable capital requirements.
- Over $200: Requires significant capital. $50,000 only buys 2-3 positions, limiting diversification.
Capital allocation example: With a $50,000 account:
- At $50/share: You can hold 10 different 100-share positions (full diversification)
- At $150/share: You can hold 3 different 100-share positions (limited diversification)
- At $400/share: You can hold 1 position (concentration risk)
Best Stock Categories for Covered Calls
Different stock categories serve different covered call strategies. Here's how to think about allocating your covered call portfolio.
Category 1: Tech Blue Chips (The Balanced Core)
Who they're for: Core holdings for stability with growth potential
Characteristics:
- Moderate IV rank (30-50%)
- 1-2% monthly premiums
- Market-leading positions
- Lower downside risk than growth stocks
Top Candidates:
Apple (AAPL) - The Conservative Choice
- Why it works: Massive liquidity, consistent growth, brand moat
- Typical premium: 1-1.5% monthly at 30-delta
- IV rank range: 30-45%
- Best for: Conservative investors wanting stable covered call income
- Dividend bonus: 0.5% annual yield
Microsoft (MSFT) - The Cloud Growth Play
- Why it works: Secular cloud growth, enterprise dominance, predictable revenue
- Typical premium: 1.2-1.8% monthly at 30-delta
- IV rank range: 35-50%
- Best for: Tech exposure with dividend income (0.8% yield)
- Note: Earnings can spike IV to 60%+ quarterly
Alphabet/Google (GOOGL) - The Value Tech
- Why it works: Search monopoly, YouTube dominance, AI investments, trades at discount to MSFT/AAPL
- Typical premium: 1.5-2% monthly at 30-delta
- IV rank range: 35-50%
- Best for: Higher premiums than AAPL while maintaining quality
- Watch out: No dividend, regulatory risks
Strategy for tech blue chips: These form your core covered call portfolio (40-50% allocation). Sell 30-35 delta calls 30-45 days out. Accept assignment happily if called away - these stocks trend up long-term.
Category 2: Dividend Aristocrats (The Income Stack)
Who they're for: Income-focused investors, retirees, conservative strategies
Characteristics:
- Lower IV rank (25-40%)
- 0.8-1.5% monthly premiums
- 2-4% annual dividend yields
- Exceptional stability
Top Candidates:
JPMorgan Chase (JPM) - Financial Sector Leader
- Why it works: Diversified revenue, dominant market position, consistent profitability
- Typical premium: 1-1.5% monthly at 30-delta
- IV rank range: 30-45%
- Dividend yield: 2.4%
- Combined income: 14-20% annual (dividends + covered calls)
Coca-Cola (KO) - Consumer Staples Stability
- Why it works: Recession-resistant, global brand, 60+ year dividend growth
- Typical premium: 0.8-1.2% monthly at 30-delta
- IV rank range: 25-35%
- Dividend yield: 3.1%
- Combined income: 12-17% annual
Procter & Gamble (PG) - Defensive Income
- Why it works: Essential consumer goods, pricing power, 65+ year dividend increases
- Typical premium: 0.7-1% monthly at 30-delta
- IV rank range: 22-32%
- Dividend yield: 2.5%
- Combined income: 11-15% annual
Johnson & Johnson (JNJ) - Healthcare Stability
- Why it works: Diversified healthcare (pharma + medical devices + consumer), AAA credit rating
- Typical premium: 0.8-1.2% monthly at 30-delta
- IV rank range: 25-35%
- Dividend yield: 3%
- Combined income: 12-17% annual
Strategy for dividend aristocrats: Allocate 30-40% here for stability. The lower premiums are offset by dividends and dramatically lower risk. Sell 25-30 delta calls to reduce assignment probability - you're holding these for dividend income first, covered call income second.
Category 3: Moderate Growth Stocks (The Premium Generators)
Who they're for: Experienced traders comfortable with higher volatility
Characteristics:
- Higher IV rank (45-70%)
- 2-4% monthly premiums
- Growth potential with established revenue
- Moderate downside risk (more than blue chips, less than speculation)
Top Candidates:
Advanced Micro Devices (AMD) - Chip Sector Leader
- Why it works: AI beneficiary, server share gains, gaming demand
- Typical premium: 3-5% monthly at 30-delta
- IV rank range: 50-70%
- Best for: Tech-savvy investors comfortable with chip sector volatility
- Watch out: Cyclical industry, competition from NVDA
Palantir (PLTR) - Government/AI Software
- Why it works: Sticky government contracts, AI hype, growing commercial revenue
- Typical premium: 4-6% monthly at 30-delta
- IV rank range: 60-80%
- Best for: Higher risk tolerance, belief in AI software long-term
- Watch out: Rich valuation, significant volatility
Block/Square (SQ) - Fintech Opportunity
- Why it works: Small business payment moat, Cash App growth, Bitcoin exposure
- Typical premium: 3-5% monthly at 30-delta
- IV rank range: 55-75%
- Best for: Diversification into fintech, comfortable with volatility
- Watch out: Competitive pressure, regulatory risks
Nvidia (NVDA) - AI Chip Leader
- Why it works: AI training/inference dominance, data center growth, pricing power
- Typical premium: 2-4% monthly at 30-delta (large stock price)
- IV rank range: 45-65%
- Best for: Core tech exposure with premium income
- Watch out: High valuation, competition risk, stock price requires significant capital
Strategy for moderate growth: Limit to 20-30% of covered call portfolio. These generate the highest premiums but carry proportionally higher risk. Sell 35-40 delta calls to balance income with assignment risk. Be prepared for assignment - have cash ready to roll into next position.
Stock Selection Criteria Checklist
Use this checklist before adding any stock to your covered call portfolio:
Fundamental Quality Checks:
- Profitable for last 4 quarters?
- Positive free cash flow?
- Debt-to-equity under 2.0?
- Market cap above $10B?
- Would I hold this stock for 12 months if the market crashed?
Options Market Quality Checks:
- IV rank between 30-70%?
- Daily stock volume above 1M shares?
- Option open interest above 500 contracts on ATM strikes?
- Bid-ask spread under $0.10 on ATM options?
- Weekly options available? (allows flexible management)
Premium & Risk Checks:
- 30-delta call generates 1-3% monthly premium?
- Stock price between $25-$200?
- Not facing imminent earnings in next 7 days?
- No major FDA approvals, trials, or binary events pending?
- Stock hasn't dropped 30%+ in last 3 months (falling knife)?
Portfolio Construction Checks:
- This position would be under 15% of covered call portfolio?
- Sector exposure under 30% after adding this position?
- At least 5 different stocks in overall portfolio?
- Mix of high/medium/low volatility stocks for diversification?
If you can't check at least 14 of these 20 boxes, reconsider the stock or wait for better entry opportunity.
Stocks to Avoid for Covered Calls
Knowing what NOT to trade is as important as knowing what TO trade. Here are the stock categories that consistently lose money for covered call sellers.
Avoid Category 1: Penny Stocks and Low-Priced Stocks
Why they're tempting: High percentage premiums (might show 5-10% monthly)
Why they fail:
- Wide bid-ask spreads (20-50% of premium lost to spreads)
- Poor liquidity (can't exit when needed)
- High commission relative to premium ($0.65 on $50 premium = 1.3% gone)
- Binary risk (stocks often drop 40-60% on bad news)
- Frequent reverse splits and dilution
Examples to avoid: Most stocks under $10, especially under $5
Real scenario: You see a $7 stock with $0.50 weekly calls (7% weekly, 28% monthly!). Seems amazing. Reality: bid-ask is $0.45-$0.55 ($0.10 spread = 20% of your premium). Stock drops to $5 on earnings miss. You lost $200 to make $50 in premium. Not worth it.
Avoid Category 2: Meme Stocks with Extreme Volatility
Why they're tempting: Massive premiums (5-10% monthly or more)
Why they fail:
- Extreme volatility causes whipsaw (stock rises 30%, falls 40%)
- Fundamentals don't support long-term holding
- Social media hype creates unpredictable moves
- You'll eventually get assigned at peak and watch stock fall 50%+
Examples to avoid: GameStop (GME), AMC Entertainment (AMC), various heavily shorted small caps
Real scenario: GME trades at $40 with 150% IV. You can collect $8 premium on a $45 call (20% monthly!). Stock explodes to $80 in two days on social media hype. You're assigned at $45, missing $35/share gain. Or worse: you own 100 shares at $45, stock falls to $25, your $8 premium doesn't matter.
Avoid Category 3: Stocks Below 20% IV Rank
Why they're tempting: They're not tempting - traders accidentally sell calls on these
Why they fail:
- Premiums too small to justify risk (0.2-0.5% monthly)
- Stock might be in low-volatility phase before big move
- Better opportunities exist elsewhere
Examples: Stable large caps during low volatility periods, utility stocks, REITs with compressed volatility
When it's okay: You own the stock long-term for dividends and want tiny extra income. Otherwise, skip it.
Avoid Category 4: Stocks Facing Known Binary Events
Why they're tempting: IV spikes before events, creating temporarily high premiums
Why they fail:
- Implied volatility correctly prices the risk
- Stocks commonly move 20-40% on FDA approvals, trial results, earnings surprises
- You collect 5% premium, stock drops 30%
- Risk-reward is against you
Examples to avoid:
- Biotech before FDA approval decisions
- Small caps before clinical trial readouts
- Highly volatile tech before earnings (IV above 100%)
- Any stock with binary lawsuit outcomes pending
Better strategy: Wait until after the event. Volatility crashes post-event (great time to sell calls at elevated IV before it normalizes).
Avoid Category 5: Stocks You Don't Understand
Why they're tempting: Friend recommended it, Reddit loves it, high premiums
Why they fail:
- You don't know when fundamentals deteriorate
- Can't make informed decisions on rolls vs assignment
- More likely to panic sell at wrong time
- Covered calls require conviction to hold through volatility
The rule: If you can't explain what the company does and why it makes money in 2-3 sentences, don't sell covered calls on it.
Building Your Covered Call Portfolio
Knowing individual stocks isn't enough. You need portfolio construction principles to manage risk across positions.
The 40/30/30 Allocation Framework
40% Stable Core (Tech Blue Chips + Dividend Aristocrats)
- AAPL, MSFT, GOOGL, JPM, KO, PG
- 1-2% monthly premiums
- Lowest risk, most likely to recover from downturns
- Hold through assignment, keep selling calls
30% Moderate Growth (Established Growth Stocks)
- AMD, NVDA, SQ, NET, SNOW
- 2-3% monthly premiums
- Moderate risk, require more active management
- Sometimes take assignment, sometimes roll
30% Higher Premium Opportunities (Elevated IV, Not Speculation)
- PLTR, COIN, U, DKNG
- 3-4% monthly premiums
- Highest risk in portfolio, careful position sizing
- Most likely to be assigned, least likely to hold long-term
Why this works: Diversification across volatility profiles. When market crashes, your stable core holds value while higher-volatility positions get hit harder - but you've been collecting proportionally higher premiums from those positions.
Position Sizing Rules
Rule 1: Maximum 15% per position Never allocate more than 15% of your covered call portfolio to a single stock. Even quality stocks have bad years (Microsoft dropped 30% in 2022).
Rule 2: Maximum 30% per sector Tech is tempting because premiums are good. But 2022 showed tech can all fall together. Limit sector exposure:
- Tech: 30% max
- Financials: 30% max
- Consumer: 30% max
- Healthcare: 30% max
- Other: 10% max
Rule 3: Minimum 5 positions Below 5 positions, single stock risk becomes too high. If one position drops 40%, it's 20%+ portfolio drawdown with only 4 positions. With 8-10 positions, same stock drop is 4-5% portfolio impact.
Example portfolio with $50,000:
Position 1: AAPL - $7,500 (15%) Position 2: MSFT - $7,500 (15%) Position 3: JPM - $5,000 (10%) Position 4: AMD - $6,500 (13%) Position 5: NVDA - $7,000 (14%) Position 6: KO - $5,000 (10%) Position 7: PLTR - $5,000 (10%) Position 8: SQ - $6,500 (13%)
Total: $50,000 across 8 positions Tech exposure: 43% (AAPL + MSFT + AMD + NVDA) Sector diversification: Tech 43%, Financial 10%, Consumer 10%, Software 23%
Rolling vs Assignment Strategy by Stock Category
Stable Core Stocks (AAPL, MSFT, JPM):
- Default: Roll when challenged
- Why: You want to keep holding these long-term
- When to accept assignment: Stock ran 20%+ above your cost basis, take profits
Moderate Growth (AMD, NVDA, SQ):
- Default: Make decision based on technical position and IV
- Roll if: Stock still looks constructive, high IV remains for new position
- Accept assignment if: Stock approaching resistance, IV collapsing, or 30%+ profit available
Higher Premium (PLTR, COIN):
- Default: Accept assignment more readily
- Why: These stocks are in portfolio specifically for premiums, not long-term holding conviction
- Roll if: You have strong conviction on continued move up
- Accept assignment if: Technical momentum fading or you want to rotate to better opportunity
Common Mistakes in Covered Call Stock Selection
Learn from others' expensive mistakes:
Mistake 1: Chasing Premium Over Quality
The trap: You see Stock X pays 4% monthly vs Stock Y pays 1.5% monthly. Stock X seems obviously better.
The reality: Stock X pays 4% because it has 70% chance of dropping 20%. Stock Y pays 1.5% because it's more stable.
Real example: Trader sells covered calls on PLTR at $30, collecting $3 premium (10% monthly!). Stock drops to $22 over 3 months. They collected $9 in total premium but lost $8 per share in value. Net: $1 gain instead of accepting assignment at $30 and redeploying to better opportunity.
The fix: Target 1-3% monthly premium. Anything above 3% requires exceptional circumstances to justify the risk.
Mistake 2: Ignoring Assignment Risk
The trap: You love the stock at $100, sell $110 call for $3 premium. Stock rises to $130. You're assigned at $110, missing $20/share of gains.
The reality: Covered calls cap upside. You must be okay with missing explosive moves.
The fix: Only sell covered calls on stocks where you'd be happy taking 10-15% gains. If you think stock is going to 3x, don't sell covered calls - just hold the stock.
Mistake 3: Selling Calls Before Earnings
The trap: Earnings in 2 weeks, IV is spiked at 80%, you can collect 4% premium on a 2-week call. Seems great.
The reality: Stock reports earnings, drops 15%. Your 4% premium doesn't help.
Real example: You sell calls on MSFT before earnings at $400 strike, collecting $8. Microsoft misses guidance, drops to $370. You lost $30 per share. The $8 premium isn't compensation for $30 loss.
The fix: Close covered calls before earnings (buy back), wait for earnings to pass, sell new calls after IV crush. Or simply avoid selling calls into earnings on volatile stocks.
Mistake 4: Not Diversifying
The trap: You love tech, all 5 positions are tech stocks (AAPL, MSFT, GOOGL, NVDA, AMD).
The reality: 2022 happens. All tech falls together. Your entire covered call portfolio drops 25-40%.
The fix: Force sector diversification. Even if tech premiums are best, limit to 30% exposure. Add financials, consumer, healthcare for uncorrelated returns.
Mistake 5: Ignoring Liquidity
The trap: Small cap stock has 15% monthly premium potential but only trades 100K shares/day.
The reality: When you want to roll, bid-ask spread is $0.40. When you want to exit, there's no liquidity.
The fix: Require minimum 1M daily volume. On options, require 500+ open interest on your target strikes. Pay attention to bid-ask spreads - under $0.10 for at-the-money options.
Advanced Stock Selection: Using IV Rank and Percentile
Understanding IV rank and IV percentile helps you identify optimal times to sell covered calls on quality stocks.
What IV Rank Tells You
IV Rank = (Current IV - 52-week low IV) / (52-week high IV - 52-week low IV) × 100
- IV Rank 0-25: Volatility is very low historically (bad time to sell options)
- IV Rank 25-50: Volatility is moderate (okay time to sell options)
- IV Rank 50-75: Volatility is elevated (good time to sell options)
- IV Rank 75-100: Volatility is extremely high (great time to sell options, but watch risk)
Strategic Entry Points
Best scenario: Quality stock + High IV Rank
Example: AAPL normally trades at 30-40% IV. During market panic, IV spikes to 65% (IV rank 90). This is optimal time to sell covered calls - you're getting paid 2-3x normal premium on a quality stock.
Bad scenario: Junk stock + High IV Rank
Example: Speculative biotech at 120% IV (IV rank 95). Yes, premium is huge, but high IV is correctly pricing severe risk. Pass.
Waiting scenario: Quality stock + Low IV Rank
Example: MSFT at 25% IV (IV rank 10). Premium is only 0.6% monthly. Either wait for IV to increase, or accept lower premium on quality stock you want to hold anyway.
IV Rank by Stock Category
Tech Blue Chips (AAPL, MSFT, GOOGL):
- Normal range: 30-50% IV rank
- Sell calls when: IV rank above 40
- Hold off when: IV rank below 25
- Elevated periods: Market corrections, Fed announcements, elections
Dividend Aristocrats (JPM, KO, PG):
- Normal range: 25-40% IV rank
- Sell calls when: IV rank above 35
- Hold off when: IV rank below 20
- Elevated periods: Banking stress, recession fears, rate shocks
Moderate Growth (AMD, PLTR, SQ):
- Normal range: 50-70% IV rank
- Sell calls when: IV rank above 50 (most of the time)
- Hold off when: IV rank below 40
- Elevated periods: Earnings, sector rotation, market volatility
Practical application: When screening for covered call opportunities, filter for stocks with IV rank above 40. These stocks are paying above-average premium right now. If quality stock drops into 60-80% IV rank during market panic - that's your best opportunity to establish covered call positions.
Sector-by-Sector Analysis
Technology Sector
Best for covered calls: AAPL, MSFT, GOOGL, NVDA, AMD, CRM Why it works: High liquidity, good premiums (1.5-3% monthly), long-term growth Watch out: Sector concentration risk, regulatory headwinds, valuation compression Allocation: 25-35% max
When to favor tech: Bull markets, rate cuts, AI adoption cycles When to reduce tech: Rate hikes, recession fears, antitrust concerns
Financial Sector
Best for covered calls: JPM, BAC, WFC, GS, BLK Why it works: Stable dividends (2-3%), moderate premiums (1-2% monthly), economic recovery play Watch out: Interest rate sensitivity, banking crises, regulatory changes Allocation: 15-25%
When to favor financials: Rising rates, economic growth, deregulation When to reduce financials: Rate cuts, recession, banking stress
Consumer Staples
Best for covered calls: KO, PG, WMT, COST, PEP Why it works: Recession-resistant, strong dividends (2-3%), consistent stability Watch out: Lower premiums (0.8-1.5% monthly), slower growth Allocation: 15-20%
When to favor staples: Recession fears, defensive positioning, market volatility When to reduce staples: Bull markets (underperform), rising rates
Healthcare Sector
Best for covered calls: JNJ, UNH, LLY, ABBV Why it works: Demographic tailwinds, dividends, moderate premiums Watch out: FDA risk, drug pricing pressure, patent cliffs Allocation: 10-20%
When to favor healthcare: Aging demographics, defensive positioning When to reduce healthcare: Patent expirations, political drug pricing risk
Energy Sector
Best for covered calls: XOM, CVX Why it works: High dividends (3-4%), good premiums during volatility Watch out: Commodity price dependency, ESG pressure, cyclicality Allocation: 0-15%
When to favor energy: Inflation, supply constraints, geopolitical risk When to reduce energy: Recession, demand destruction, clean energy shift
Tracking Your Covered Call Portfolio
Managing 5-10 covered call positions across multiple stocks becomes complex quickly. You need systematic tracking for cost basis, premium collected, rolls, and assignments.
What You Need to Track
Per Position:
- Initial stock purchase price
- Premiums collected (running total)
- Adjusted cost basis (purchase price - premiums)
- Current unrealized gain/loss
- Current covered call details (strike, expiration, premium)
- Number of times rolled
- Days held
- Dividend income collected
Portfolio Level:
- Total premium collected (monthly and YTD)
- Win rate (percentage of profitable trades)
- Average return per position
- Sector allocation
- IV exposure (sum of individual position IVs)
- Upcoming expirations calendar
- Assignment likelihood
Tax Reporting:
- Short-term vs long-term gains
- Wash sale tracking
- Premium income categorization
- Stock assignment dates for holding period calculation
The Spreadsheet Problem
Most covered call traders start with Excel or Google Sheets. This works for 1-2 positions. At 5+ positions with regular rolls, spreadsheets break down:
- Manual entry errors (forgot to update cost basis)
- Formula errors after copy-paste
- Can't see upcoming expirations at a glance
- No automatic alerts when positions need attention
- Tax reporting nightmare at year-end
- Hours spent updating instead of analyzing
Example spreadsheet failure: You sell covered calls on 8 stocks. AMD gets assigned, you sell cash-secured puts, get assigned again, sell covered calls again (full wheel cycle). Now you're tracking: original stock purchase, 3 call premiums collected, assignment, put premium, second assignment, new call premium. That's 8+ cells to update manually - per position. Multiply by 8 positions, add regular rolls, and you're spending 2-3 hours/week on spreadsheet maintenance.
Automation Alternative
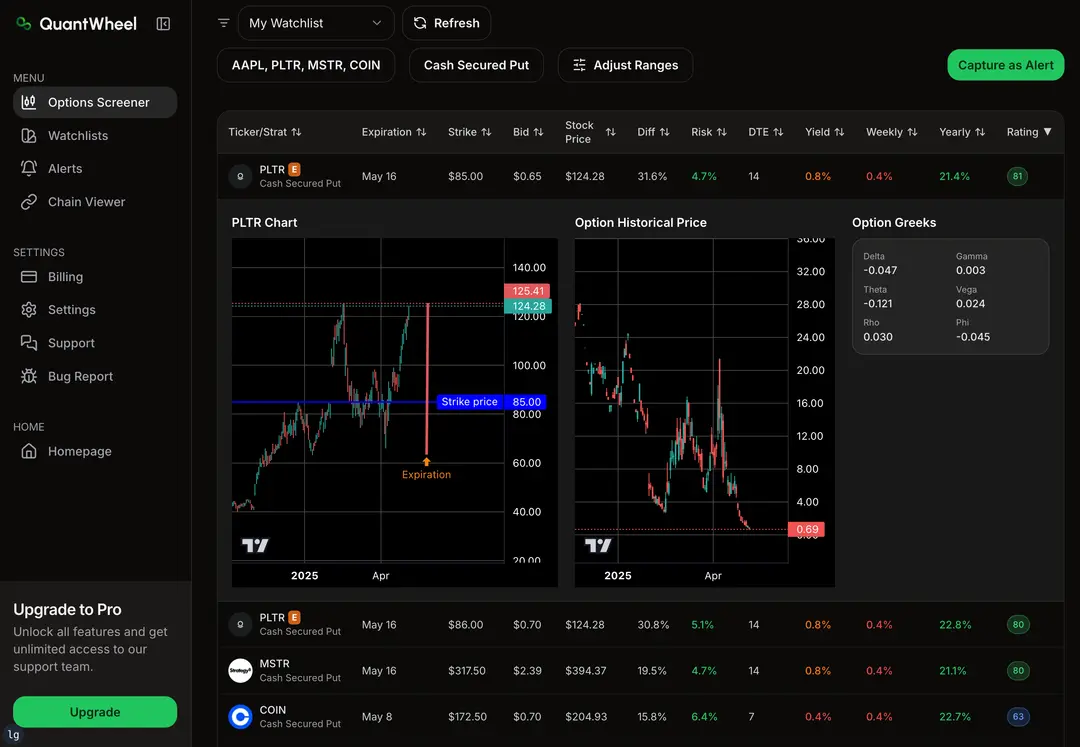
This is exactly why platforms like QuantWheel exist - built specifically for covered call and wheel strategy traders who need automated position tracking.
What QuantWheel automates:
- Syncs directly with your broker (no manual entry)
- Automatically adjusts cost basis on assignments
- Tracks full wheel cycles (stock → covered call → assignment → cash-secured put → assignment → covered call)
- Alerts you when positions hit your profit targets
- Shows upcoming expirations across all positions
- Calculates real return including premiums and stock gains
- Generates tax reports for year-end
After tracking 15+ covered call positions in spreadsheets and watching formulas break constantly, QuantWheel handles the tedious accounting automatically so you can focus on stock selection and position management instead of spreadsheet maintenance.
Putting It All Together: Your Action Plan
You now understand what makes quality covered call stocks. Here's your step-by-step plan to build a profitable covered call portfolio.
Step 1: Define Your Strategy (15 minutes)
Answer these questions:
- Account size: How much capital for covered calls? ($25K minimum recommended)
- Risk tolerance: Conservative (dividend aristocrats), balanced (50/50 mix), or aggressive (growth stocks)?
- Time commitment: How much time weekly for position management? (2-5 hours recommended)
- Goals: Target monthly return? (1.5-2.5% realistic for balanced approach)
Step 2: Screen for Quality Candidates (30 minutes)
Using your broker's screener or QuantWheel:
Filter 1: Fundamental Quality
- Market cap > $10B
- Profitable (positive EPS)
- Debt-to-equity < 2.0
Filter 2: Options Market Quality
- Stock price: $25-$200
- Daily volume > 1M shares
- IV rank: 35-75%
- Option volume > 500 contracts on ATM strikes
Filter 3: Premium Requirements
- 30-delta call generates 1-3% monthly premium
- Bid-ask spread < $0.10 on ATM options
This should generate 20-40 quality candidates.
Step 3: Select 6-10 Stocks (30 minutes)
From your screened list, choose stocks that:
- You'd hold for 12+ months if market crashed
- Spread across 3-4 different sectors
- Mix of stable core (AAPL, MSFT) + moderate growth (AMD, SQ)
- No single position over 15% of portfolio
- No sector over 30% of portfolio
Step 4: Enter Initial Positions (1-2 weeks)
Don't enter everything on day 1. Scale in over 1-2 weeks:
Week 1: Enter 3-4 core positions (AAPL, MSFT, JPM) when IV rank is favorable Week 2: Add 2-3 growth positions (AMD, SQ) when IV rank above 50
For each position:
- Buy 100 shares
- Wait 1-2 days (let purchase settle)
- Sell 30-35 delta call, 30-45 days to expiration
- Set alert at 50% profit on the call
Step 5: Manage Positions (Weekly 30-60 minutes)
Weekly checklist:
- Review positions approaching expiration (7-10 days out)
- Check for hits on profit targets (50% call value decay)
- Identify stocks with IV rank spike (new opportunities)
- Review any earnings announcements next week (close or roll if needed)
- Rebalance if any sector over 30% or position over 15%
When call hits 50% profit with 21+ DTE remaining: Close the call, collect 50% profit, sell new call at same or higher strike
When call is near expiration:
- If stock below strike: Let expire worthless, sell new call
- If stock above strike: Accept assignment OR roll up and out
- If stock near strike: Let assignment decision happen naturally
Step 6: Track and Improve (Monthly)
End of month review:
- Total premium collected this month
- Winning positions vs losing positions
- Which stock categories performed best
- Any positions to close and reallocate
- Sector rebalancing needed?
- Update target list for next month
Quarterly deep dive:
- Year-to-date return vs SPY buy-and-hold
- Win rate percentage
- Average return per position
- Best performing sectors
- Strategy adjustments needed?
Final Thoughts: Quality Over Premium
The best stocks for covered calls aren't the ones paying the highest premiums - they're the stocks you'd happily own without selling any calls at all.
When you start with quality companies, covered call premium becomes a nice enhancement to already-solid investments. When you start with junk stocks paying high premiums, you're playing a losing game where occasional big premium months don't make up for long-term stock depreciation.
Build your core with AAPL, MSFT, JPM, and similar quality names. Add growth like AMD and NVDA for higher premiums when their IV rank spikes. Diversify across sectors. Size positions appropriately. Track systematically.
That's the formula for sustainable covered call income - boring, consistent, and profitable.
Risk Disclosure
Options trading involves substantial risk and is not suitable for all investors. Past performance does not guarantee future results. This content is for educational purposes only and should not be considered investment advice.
The examples used in this article are for educational purposes only and are not recommendations to buy or sell any security. All investment decisions should be based on your own analysis and risk tolerance.
Always do your own research and consider consulting with a financial advisor before making investment decisions.